Team:NTNU Trondheim/Flow-Cytometry
From 2011.igem.org
(Difference between revisions)
(→Flow Cytometry) |
(→Flow Cytometry) |
||
| Line 3: | Line 3: | ||
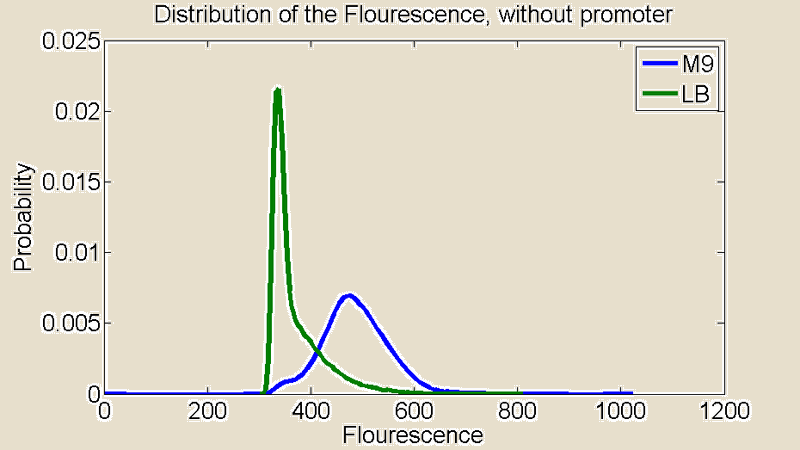
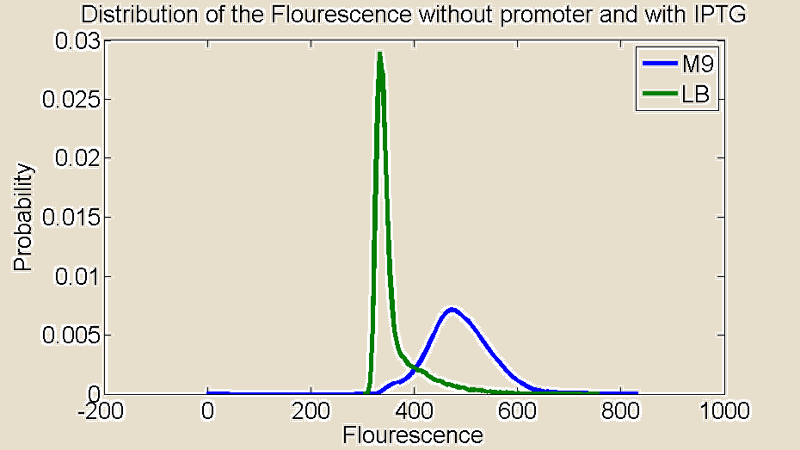
Several measurements were performed using a Flow Cytometer, this allowed us to measure the flouresence from single cells. The resulting plots shows the distributions of the flouresence for the red end of the spectrum (i.e around the wavelength corresponding to mCherry). | Several measurements were performed using a Flow Cytometer, this allowed us to measure the flouresence from single cells. The resulting plots shows the distributions of the flouresence for the red end of the spectrum (i.e around the wavelength corresponding to mCherry). | ||
| - | [[File:+P.png| | + | [[File:+P.png|430x340px]] |
| - | [[File:-P.png| | + | [[File:-P.png|430x340px]] |
| - | [[File:+IPTG.png| | + | [[File:+IPTG.png|430x340px]] |
| - | [[File:-IPTG.png| | + | [[File:-IPTG.png|430x340px]] |
Revision as of 19:32, 13 September 2011

Flow Cytometry
Several measurements were performed using a Flow Cytometer, this allowed us to measure the flouresence from single cells. The resulting plots shows the distributions of the flouresence for the red end of the spectrum (i.e around the wavelength corresponding to mCherry).
 "
"


