Team:Edinburgh/Cellulases (Kappa model)
From 2011.igem.org
Cellulases (Kappa model)
Contents |
Kappa
Kappa is a stochastic, agent-based language for simulating interactions in (mostly) biological systems. There are a few implementations available - we used KaSim developed by Jean Krivine and available for free from here. It has been used by several iGEM teams before, most notably by Team Edinburgh 2010, who used it to develop a model awarded the Best Model Prize.
A model in Kappa would be represented in terms of agents and rules. Agents could be thought of as 'idealised proteins' (Danos et al., 2008), or other entities (like cells). They can have multiple sites, which can bind to one another; and states of different values. For example, an agent called Glucose in our system is defined as:
%agent: Glucose(end1, end4, belongs~cellulose~cellobiose~nothing~complex)
That means that a molecule of glucose has two sites: end 1, end 4 (meaning 1' and 4' carbons) and one state: belongs (which is only really used for the purpose of counting different substances).
Reactions define the interactions between the agents. The left side of the reaction defines the preconditions of reaction, and the right side represents what happens to the substrates. A reaction can create or delete bonds between chemicals, create or delete agents, and change states of agents. A reaction also happens at a certain rate. For example, cutting cellulose in the middle of the chain by Endoglucanase can be represented as the following rule:
Endoglucanase(activeSite),
Glucose(end1?, end4!1, belongs~cellulose),
Glucose(end1!1, end4!2, belongs~cellulose),
Glucose(end1!2, end4!3, belongs~cellulose),
Glucose(end1!3, end4?, belongs~cellulose) ->
                                Endoglucanase(activeSite),
                                Glucose(end1?, end4!1, belongs~cellulose),
                                Glucose(end1!1, end4, belongs~cellulose),
                                Glucose(end1, end4!3, belongs~cellulose),
                                Glucose(end1!3, end4?, belongs~cellulose)
                                @ 'γ_Endo_forward'
This means that an agent called Endoglucanase with a free active site (i.e. not bound to an inhibiting molecule) needs to be present with a chain of at least 4 glucoses, and as a result one of the bonds within cellulose chain is cut. This happens at a rate 'γ_Endo_forward', which is a defined constant.
The Kappa simulator uses 'biological time', which is roughly corresponding to actual 'wall clock time'. The state of the system is evolved by choosing a reaction to happen and a corresponding time step to take. These are selected in a stochastic way, based on the following factors:
- The kinetic rates of reactions contribute towards the 'activity' of every reaction rule. More active rules get higher probability of firing next.
- The time step is also dependent on activity of rules.
For the purposes of model development and testing, we initialised the simulator with the same seed, thus making the behaviour of the system predictable. See further for more information on testing the stochastic behaviour of the system.
Structure of the model
We thought that a neat model would represent cellulose as a long fibre of glucoses linked together:
However, manually inputting that would be a considerable effort. Instead, we made a Kappa system which would build cellulose for us, and then, using Kappa syntax, took a snapshot of the model. Two variants were created, one with long (10,000 glucoses) fibres of cellulose and another one with short (1,000 glucoses) fibres.
Then, Endoglucanase would cut Cellulose somewhere in the middle:
Also, Exoglucanase would cut Cellulose at end-points:
[http://dx.doi.org/10.1146/annurev-biochem-091208-085603 Fontes and Gilbert (2010)] have suggested that Exoglucanase is inhibited by its end product - Cellobiose, so we modelled that interaction as well.
Finally, β-glucosidase would cut dimers (i.e. Cellobiose):
We also modelled end-product inhibition of β-glucosidase by glucose.
Non-synergistic model
We developed our first, non-synergistic model in Kappa, based on the system as seen above. We carried out a series of experiments in order to fit parameters to our model. The aim was to generate graphs similar to those in Kadam, Rydholm & McMillan (2004) (since back then we did not have any data available from the wet lab). We manipulated the kinetic rates of reactions and relative concentrations of enzymes.
After an overnight series of experiments using a computing cluster in the [http://www.inf.ed.ac.uk School of Informatics], we came up with a set of values for parameters of our model. We would stick to these values of parameters across all our Kappa models.
Dependency of model on kinetic rates
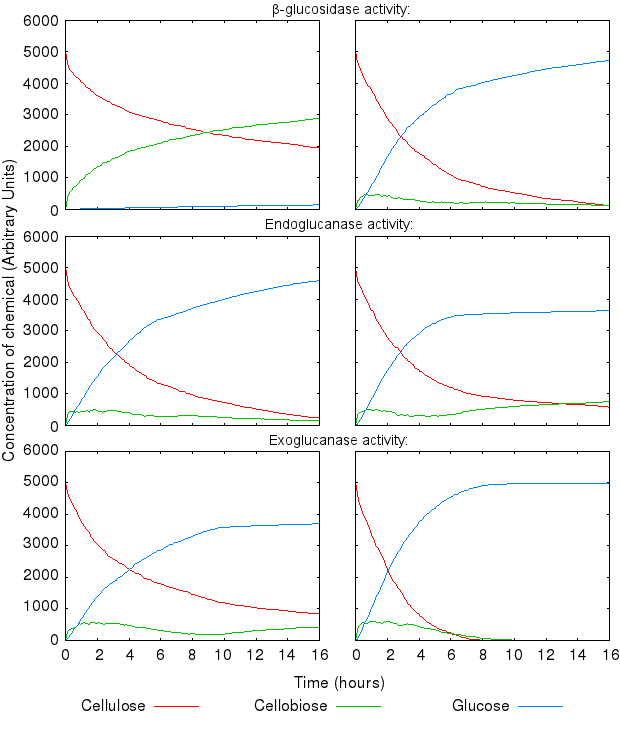
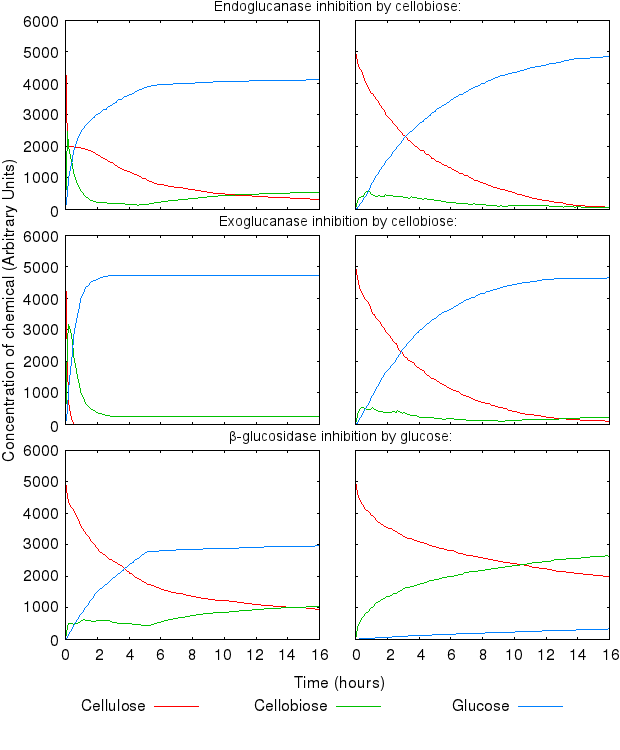
During this experimental phase, we found that the model dynamics is hugely affected by varying the reactions' kinetic rates. The following graphs present the effect of varying single kinetic rates, with all other being equal. We tested combinations of all the reaction rates, but these are omitted from the graphs for clarity.
The activity of the three enzymes influences the behaviour of the system in slightly different ways.
- β-glucosidase influences how quickly cellobiose is degraded into glucose
- endoglucanase influences the level of partial degradation of cellulose
- exoglucanase influences the amount cellobiose available to β-glucosidase.
The effect of β-glucosidase and exoglucanase activity is as expected and logically following from how the reactions are defined. higher activity of these enzymes causes faster cellulose degradation.
High activity of endoglucanase was found to place a (temporary) limit on production of glucose.
Increase in all the inihibition rates causes a decline in cellulose degradation. β-glucosidase inhibition is has the most influence on the time taken to fully degrade cellulose, because the enzyme inhibited is the one producing the end product of the reaction chain.
Synergistic model
Since Kappa models can be easily extended (by adding new agents, or reaction rules), we tried to make a synergistic model based on the non-synergistic model.
We introduced new agents: an E.Coli cell and several copies of INP, to be linked together as shown below:
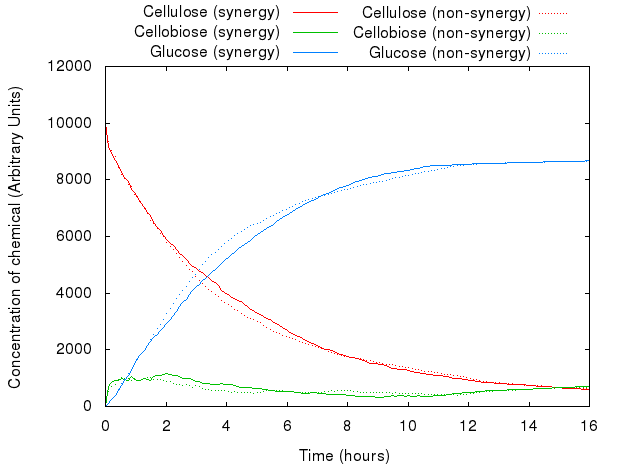
However, that did not act as we predicted. The following graph presents both models.
The graph above shows that for the same set of parameters, there is virtually no difference between the two systems. This is because Kappa does not have the notion of proximity, i.e. the simulator has no way of distinguishing between the products of enzymes produced just a second ago and the ones floating far away in the solution:
You can download the ready model as a .zip file (instructions in README file):

Spatial Kappa
[http://www.demonsoft.org/SpatialKappa/ Spatial Kappa] is an extension to Kappa made by our last year's team (Team Edinburgh 2010) and currently maintained by Donal Stewart. It seems like the extra functionality of compartments added by Spatial Kappa would help develop a model of synergistic action.
Our model could work in the following way:
- In the synergistic system, the enzymes are all in one compartment. The products and substrates would be allowed to diffuse across compartments, while the enzymes would not.
- The non-synergistic system would be very similar, but the enzymes could diffuse across compartments.
The resulting system should show that enzymes being in close proximity degrade cellulose faster.
Because of the design choice we made at the beginning - representing cellulose as a chain of glucoses - we encountered a problem while setting up diffusion rules. It is trivial to set up diffusion rules for enzymes (just one rule per enzyme), but for the diffusion of cellulose, we would need to set up a separate rule for every possible length of cellulose chain - in our case that would amount to 1000 rules. While it is possible to automatically generate the rules (e.g. using Python), this would slow the model down, meaning it would become intractable.
Therefore we tried a different representation of cellulose, where the agent Cellulose has a length n,
n ∈ {1..10}
(representing a chain of cellulose of length 2n+1 glucoses).Then,
- Endoglucanase would take a chain of length n, and produce two chains of length n-1 (or two cellobioses from a chain of length 1);
- Exoglucanase would take a chain of length n, and produce n-1 chains of decreasing length, connected to each other, plus an extra chain of length n = 1, plus a particle of Cellobiose, thus conserving the amount of glucose:
2n+1 = 2n + 2n-1 + … + 23 + 22 + 2 + 2
- Endoglucanase could then split chains made in Exoglucanase reaction;
- β-glucosidase would split Cellobiose into two glucoses;
- β-glucosidase is inhibited by its end-product, glucose;
- Exogluconase is inhibited by cellobiose.
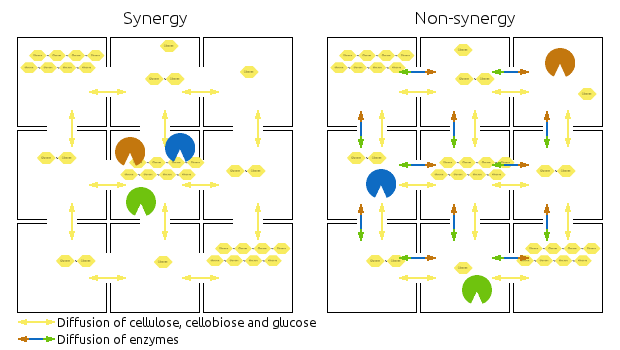
Compartments are represented by squares, the arrows indicate diffusion of relevant chemicals. Chains represent cellulose, cellobiose and glucose.
Left side shows then synergistic model, the non-synergistic model is shown in the right.
Note that the amounts of enzymes and substrates is identical in both models.
You can also view it as an animation.
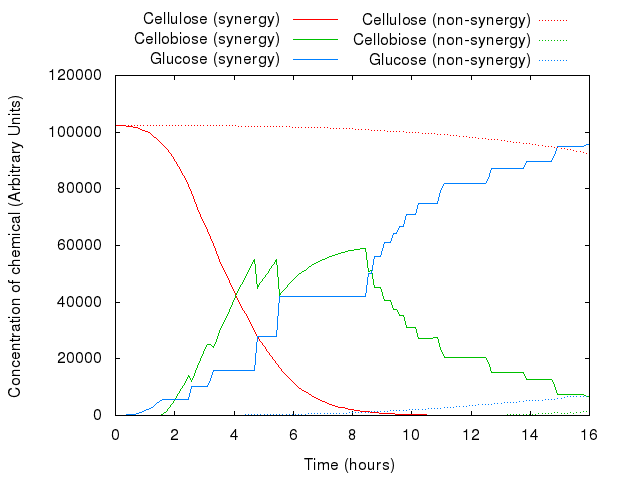
An example simulation of the system is shown below. You can see the difference between synergistic and non-synergistic system.
Manipulating the initial mixture
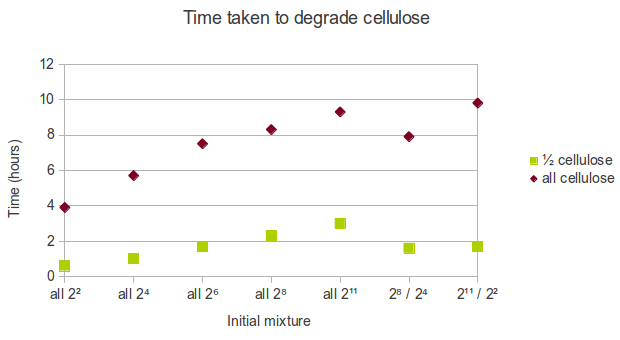
In real life, cellulose might exist in the form of a mixture of chains of varying length. As a result of the way we represented cellulose in Spatial Kappa, it is easy to manipulate the initial conditions. We decided that the following initial mixtures represent a range of possible states cellulose might be in:
- all cellulose is in short form (22 glucoses length),
- all cellulose is in relatively short form (24 glucoses length),
- all cellulose is in medium form (26 glucoses length),
- all cellulose is in relatively long form (28 glucoses length),
- all cellulose is in long form (211 glucoses length),
- half cellulose is in long form (211 glucoses length) and half cellulose is in short form (22 glucoses length),
- half cellulose is in relatively long form (28 glucoses length) and half cellulose is in relatively short form (24 glucoses length).
We found that using shorter chains of glucose increases the rate at which cellulose is degraded. Therefore, in a biorefinery, it would be beneficial to use shorter chains of cellulose as the feedstock.
Additional cellulose
In a real-world biorefinery, one might be interested to produce glucose continuously as opposed to in a batch process. To achieve that, cellulose must be added to the system at some point, and some of the glucose removed from the bioreactor. The point at which cellulose is added to the system can be optimised with respect to glucose output over time.
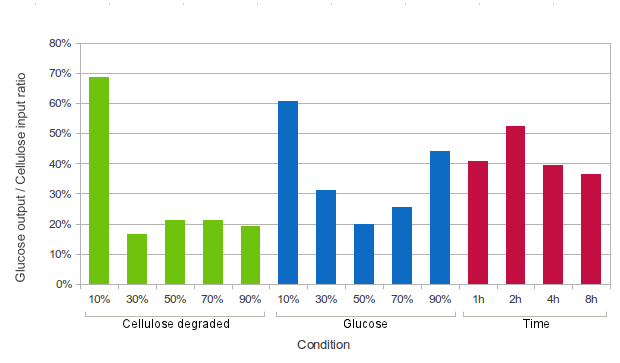
Kappa can simulate exactly that - adding or removing agents from the reaction mixture. We could test a range of conditions in which cellulose is added, e.g.:
- when a certain percent of cellulose is degraded (10%, 30%, 50%, 70% or 90%),
- at fixed time intervals (every 1 hour, 2 hours, 4 hours, or 8 hours),
- when a certain amount of end-product (glucose) is produced (10%, 30%, 50%, 70% or 90%).
At each of these events, half of the amount of free-floating glucose would be removed from the system, and an equivalent amount of cellulose would be added. The glucose which is removed from the system will be tallied.
To get a meaningful number, the amount of glucose will be divided by the amount of cellulose put into the system, thus providing the expected return ratio for cellulose.
It can be seen from the graph above that in principle, it is beneficial to add cellulose to the system at an early opportunity (after 10% of cellulose is degraded or after 10% of glucose is produced, or every two hours). However, other factors also need to be taken into account when choosing the point at which to add more cellulose.
- Firstly, in practice it is impossible to remove just glucose from the system. In real life one would remove a part of the reaction mixture, including partially degraded cellulose, cellobiose, glucose and some enzymes. That would need to be purified and the cost of that process would be a factor in choosing the point at which cellulose is degraded.
- Secondly, especially in the case of the '10% degraded cellulose' set-up (but also other set-ups where cellulose is added after degrading x% of initial cellulose), we noted abnormally high amounts of cellulose produced in the system (after 16 hours of simulated time, cellobiose was over 100% of the initial mass of cellulose). This is possibly because the high amounts of glucose (and cellobiose) inhibit the enzymes, especially β-glucosidase. A possible solution to this problem might be removing not only glucose, but also cellobiose from the system, or adding more enzymes together with cellulose.
- Thirdly, in the systems where cellulose is added after a certain amount of glucose is produced, relatively little cellobiose is left in the system at the end of simulation. Therefore the product of these systems might have higher glucose content, so one might prefer this option.
Multiple runs
References
- Danos V, Feret J, Fontana W, Harmer R, Krivine J (2008) [http://dx.doi.org/10.1007/978-3-540-68413-8_8 Rule-Based Modelling, Symmetries, Refinements]. Lecture Notes in Computer Science 2008(5054): 103-122 (doi: 10.1007/978-3-540-68413-8_8)
- Fontes CMGA, Gilbert HJ (2010) [http://www.annualreviews.org/doi/abs/10.1146/annurev-biochem-091208-085603 Cellulosomes: highly efficient nanomachines designed to deconstruct plant cell wall complex carbohydrates]. Annual Review of Biochemistry 79: 655-81 (doi: 10.1146/annurev-biochem-091208-085603).
- Kadam KL, Rydholm EC, McMillan JD (2004) [http://onlinelibrary.wiley.com/doi/10.1021/bp034316x/full Development and validation of a kinetic model for enzymatic saccharification of lignocellulosic biomass]. Biotechnology Progress 20(3): 698–705 (doi: 10.1021/bp034316x).
- ECDF. 1 August 2007. U of Edinburgh. 12 Sep. 2011 [http://www.ecdf.ed.ac.uk].
 "
"


