Team:Cornell/Results
From 2011.igem.org
(Difference between revisions)
Rockyshell92 (Talk | contribs) |
(→Enzymatic Pathway) |
||
| Line 16: | Line 16: | ||
[[file:Graph-Tryptophan,Vioenzymes Cornell2011.jpg|900px|center]] | [[file:Graph-Tryptophan,Vioenzymes Cornell2011.jpg|900px|center]] | ||
| + | |||
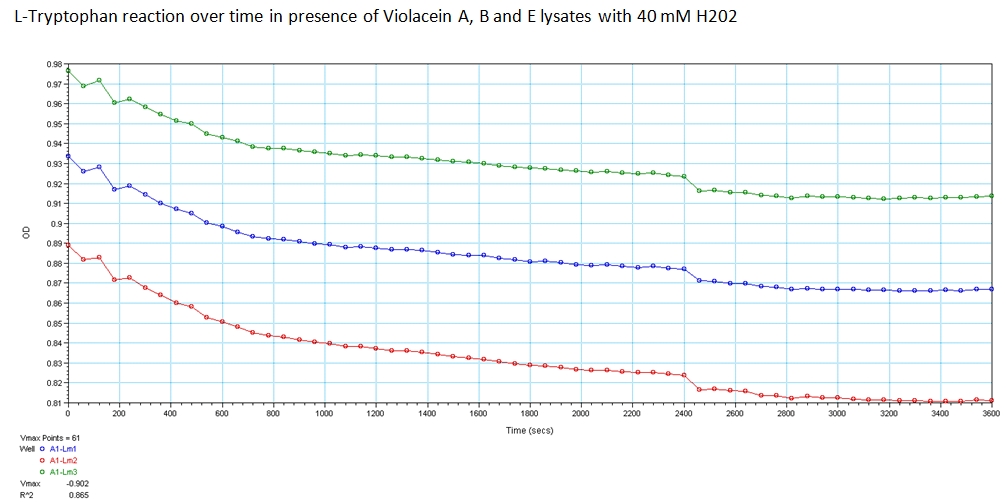
| + | The green points represent readings at 562 nm, blue at 590 nm, and red at 638 nm at 0.008 g/ml concentration of L-Tryptophan and 40 mM H202. As you can see, the absorbance of Tryptophan noticably decreases over a time course of 1 hour. This experiment was recreated varying the ratio of enzymes and concentration of initial tryptophan. The results showed a similar decreasing trend. | ||
=Microfluidics Assembly= | =Microfluidics Assembly= | ||
=Light Induced Lysis= | =Light Induced Lysis= | ||
</font> | </font> | ||
Revision as of 02:52, 29 September 2011
Results |
Protocol |
Notebook |
Parts Submitted
Contents |
Enzymatic Pathway
- Through the summer, we were able to successfully constructed the tagged violacein pathway enzymes VioA, VioB, VioE and submitted those parts to the registry. These three enzymes in series are capable of converting L-tryptophan into prodeoxyviolacein, a dark green colored intermediate of the violacein pathway. Each enzyme sequence was constructed to have the Avi-tag sequence included on its C-terminus, followed by the stop codon so that one single fusion protein is expressed. The avitag is capable of biotinylating the enzymes so that they could be bound to surfaces using a simple NeturAvidin ligand system.
-
- To simplify the construction process, each enzyme sequence was PCR'd off the iGEM Distribution sample with a KpnI site followed by the iGEM prefix, the gene of interest, and ended with an SphI or HindIII site that replaced the location of the stop codon. These PCR products could then be ligated into a modified pZE12-SMCS backbone which contained the Avitag sequence followed by the stop codon, iGEM suffix and ClaI site. This backbone was constructed using the primer insert method outlined in the Project Description.
-
- With the modified enzymes, we performed experiments to show their expression and utilization of tryptophan using a UV/Vis spectrometer at the peak wavelengths at which tryptophan responds to (590,638, and 562 nm). The OD measurements of solutions containing equivolume of VioA, VioB, 40 mM Hydrogen Peroxide (for oxidation of tryptophan) and VioE lysate with varying concentration of tryptophan. The results are shown below.
The green points represent readings at 562 nm, blue at 590 nm, and red at 638 nm at 0.008 g/ml concentration of L-Tryptophan and 40 mM H202. As you can see, the absorbance of Tryptophan noticably decreases over a time course of 1 hour. This experiment was recreated varying the ratio of enzymes and concentration of initial tryptophan. The results showed a similar decreasing trend.
Microfluidics Assembly
Light Induced Lysis
 "
"


