Team:USTC-China/Project/application/Experiment
From 2011.igem.org
Experimental Design and Results (protocol)
To put the original Toggle Switch-Aptamer-cheZ in use, we choose the second design above(As shown in Figure 5.) to be the experimental construction(Figure 6.).
Figure6.
In this design, we use biobrick BBa_K117000 as the Lysis protein, and use biobrick BBa_K117001 to replace the pyosin. In which, the biobrick BBa_K117001 is ColE7-ImmE7 protein complex, and the lysis protein can remove Immunity protein from the complex with ColE7, then ColE7 regains its toxicity and ability to kill the EHEC bacteria or other bacteria nearby. Lysis protein itself can induce the lysis of host cell, exposing the interior cell contents and hence allows free diffusion of ColE7 proteins towards pathogenic bacteria strain.
Under the consideration of bio-safety, we just use the ordinary E.coli strain with the chloramphenicol and tetracycline resistance as the target bacteia. After the experiment (details are shown in the Protocol), we have some reliable results shown below.
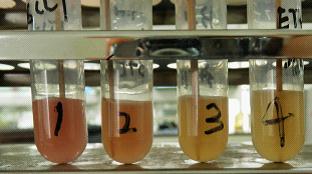
Figure7.
Figure7 shows the fluctuation of expression of the Toggle Switch device, the number of bacteria with red fluorescent decreases from tube1 to tube2.
Figure8.The growing state of the target bacteria as the control. Left(after 3h), Right(after 10h)
Figure8 shows the growing state of the target bacteria as the control of the experiment, in which the red circle represent the range of motion of the target(determined by the observation under the fluorescence microscope), and from left to right the concentration of the theophylline increases.
Figure9.The growing state of the reprogrammed bacteria(colony1,from tube2) and the target bacteria(colony2). Left(after 3h), Right(after 10h)
Figure9 shows the growing state of the reprogrammed bacteria(from tube2) and the target bacteria, in which the yellow circle represent the range of motion of reprogrammed bacteria and the red circle represent the range of motion of the target bacteria(determined by the observation under the fluorescence microscope), and from left to right the concentration of the theophylline increases.
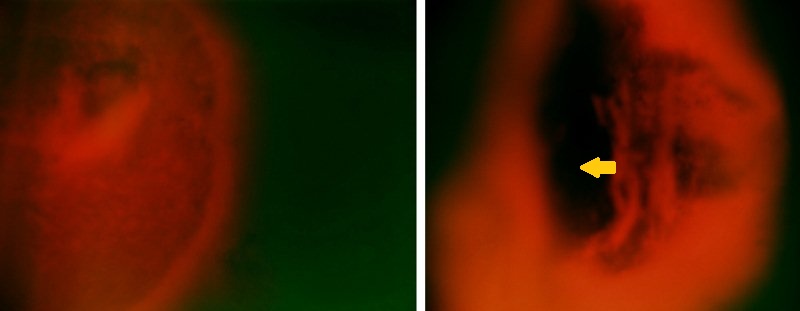
Figure10.The fluorescent Photo(4X Objective) of the reprogrammed bacteria(Left,from tube2) and the target bacteria(Right).
Figure10 shows two colonies, the colony of the reprogrammed bacteria which keeps the normal form, and the colony of the target bacteria which is deformed and has a hole in the middle of it.
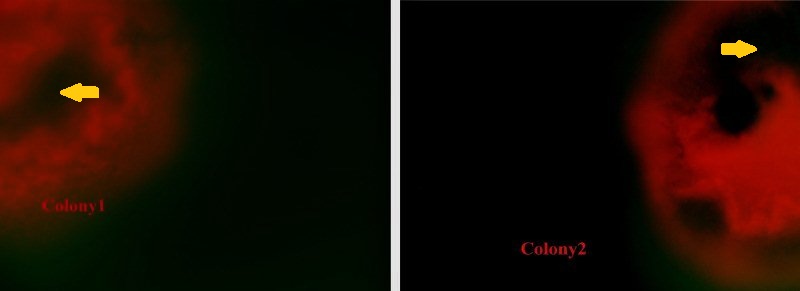
Figure11.The growing state of the reprogrammed bacteria(colony1,from tube3) and the target bacteria(colony2)(after 10h)
Figure11 shows the growing state of the reprogrammed bacteria(from tube3) and the target bacteria, in which the yellow circle represent the range of motion of reprogrammed bacteria and the red circle represent the range of motion of the target bacteria(determined by the observation under the fluorescence microscope), and from left to right the concentration of the theophylline increases.
Figure12.The fluorescent Photo(4X Objective) of the reprogrammed bacteria(Left,from tube2) and the target bacteria(Right).
Figure12 shows two colonies, the colony of the reprogrammed bacteria and the colony of the target bacteria,both of them are deformed and have holes in the middle of the colony. This means the reprogrammed bacteria not only kill the target bacteria by self-destruction, but also lead to a massive destruction in the original colony.
 "
"


