Team:ETH Zurich/Overview/Informationprocessing
From 2011.igem.org
Information processing
SmoColi processes a gaseous into a visible signal. At first the gaseous signal molecules will be dissolved in our reservoir with water. Out of this dissolution our signal molecule diffuses into the agarose forming a spatial concentration gradient out of spatial absolute value in the reservoir. The signal molecules were either imported actively or by diffusion into our SmoColi cells. These signal is in the cells processed to a visible signal via a signal cascade. The visible signal is either a spatially located green band or red signal.

Signal Pre-Processing
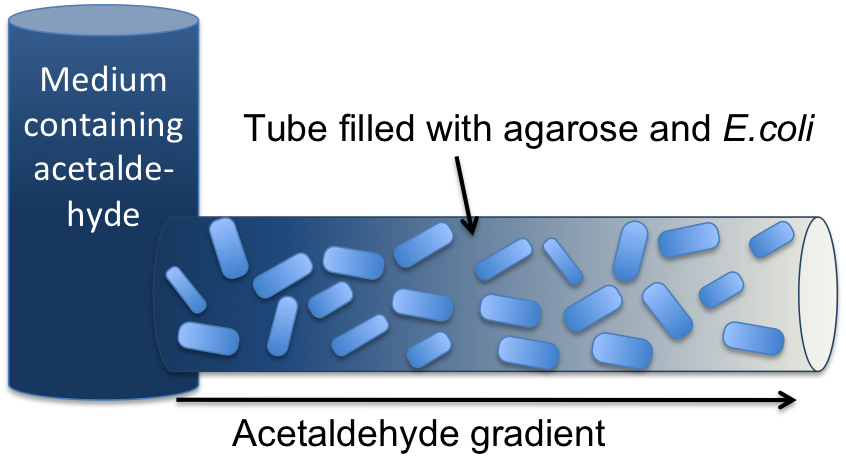
The first step for both designs is to map an absolute acetaldehyde (xylene) concentration into a spatial signal for further analysis. For this pre-processing step we constructed a flow-channel consisting of a tube filled with agarose and the SmoColi cells (see Figure 3), and which contains initially no acetaldehyde (xylene). The channel is then connected at one side to the sample medium for which the acetaldehyde (xylene) concentration should be measured, leading to acetaldehyde (xylene) diffusing from the sample medium into the tube.
Acetaldehyde is naturally degraded in E. coli by the acetaldehyde dehydrogenase. For the second design we engineered SmoColi to also degrade xylene by integrating the upper TOL pathway into the cells. The degradation of acetaldehyde (xylene) counteracts its diffusion into the channel, leading to the establishment of a spatial steady state acetaldehyde (xylene) concentration gradient. The shape and hight of the gradient only depends on the cell density, the degradation rate per cell, the diffusion constant, and the acetaldehyde (xylene) concentration in the sample medium. Thus, by increasing or decreasing the acetaldehyde (xylene) concentration in the sample medium and keeping the other parameters unchanged, the gradient is shifted to the right or to the left. In the following we describe how we use this spatial shift of the gradient to detect and quantify the concentration of acetaldehyde (xylene) in the sample medium.
Signal Detection
Inside the tube, acetaldehyde (xylene) diffuses through the cellular membranes of the SmoColi cells and associates with its constitutively expressed receptor AlcR (XylR). Upon binding, the AlcR-acetaldehyde (XylR-xylene) complex can bind to its cognate operator, and inhibits (activates) the transcription of the genes under the control of the PAlcR (PU) promoter.
Since for the further signal processing it was necessary to have a POPS signal proportional to the signaling molecule concentration, and since the acetaldehyde sensor inhibits transcription, we decided to include an additional unit to invert the transduced signal downstream of acetaldehyde (this element is not necessary for the xylene sensor): we put TetR under the transcriptional control of AlcR, and since TetR acts as a transcriptional inhibitor for downstream proteins, the transduced acetaldehyde signal has a similar qualitative input/output relation as the transduced xylene sensor without inverter.
Signal Processing
I: The Band-Pass Filter
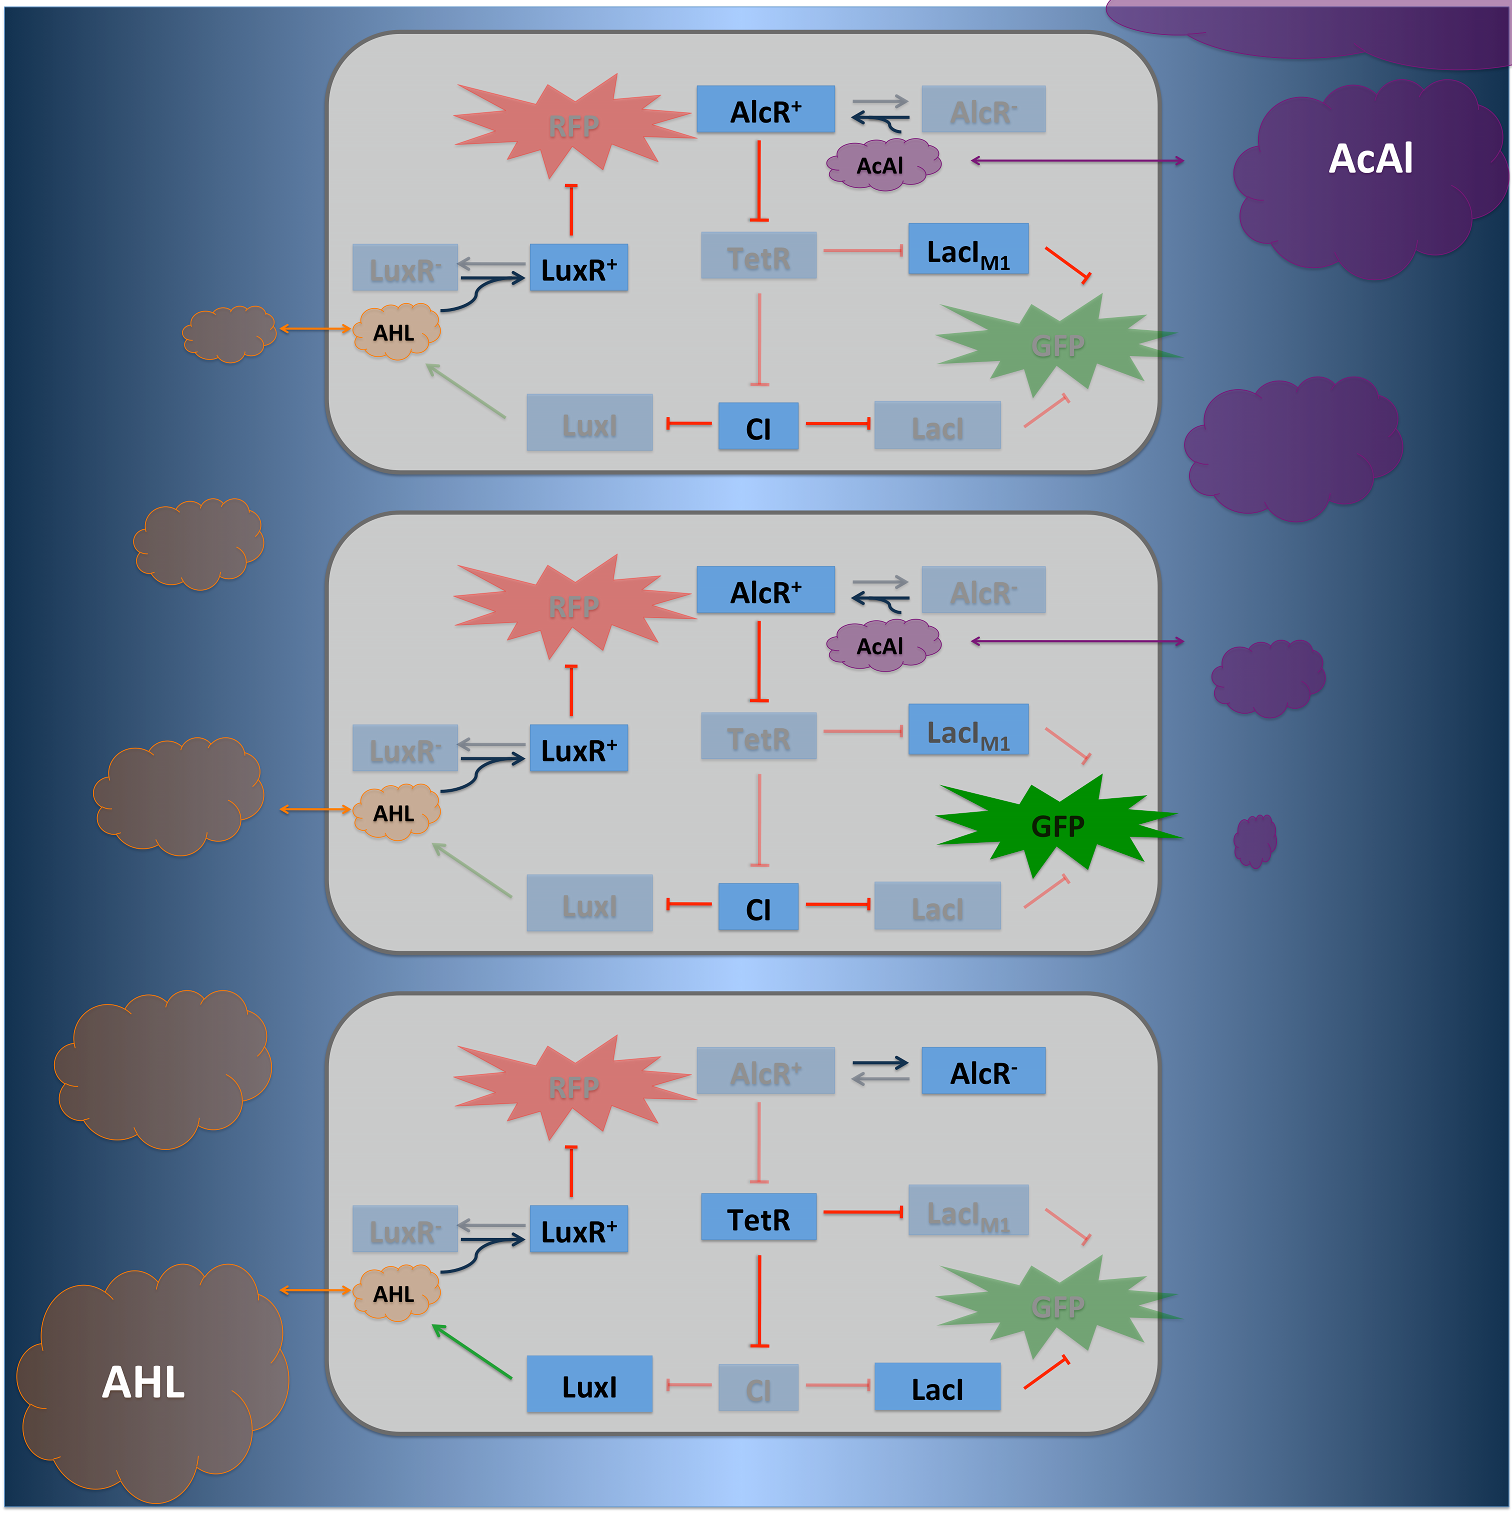
To realize the spatial green fluorescence band indicating the acetaldehyde (xylene) concentration (see Figure 4)), we implemented a signal processing unit, which transduces the incoming signal if and only if the signal is neither too strong nor too weak (band-pass filter [1]):
TetR represses (XylR enhances) the expression of the LacIM1 repressor (codon-modified LacI) and the lambda repressor CI. Thus, high acetaldehyde (xylene) concentrations result in high cytoplasmic levels of CI and of LacIM1. Since LacIM1 represses the expression of the green fluorescent protein (GFP), no green fluorescence signal can be detected for high concentrations.
Low acetaldehyde (xylene) concentrations result in low LacIM1 and CI concentrations. Although in this case, LacIM1 does not repress GFP production, GFP is transcriptional repressed by the non-codon modified LacI, which is expressed at low CI concentrations. Only intermediate signals results in a moderate level of CI and LacIM1. The repression of CI is significantly higher than the one of LacIM1. While moderate levels of CI effectively shuts off LacI expression, the LacIM1 concentration is to low to repress GFP
II: The Alarm Signal
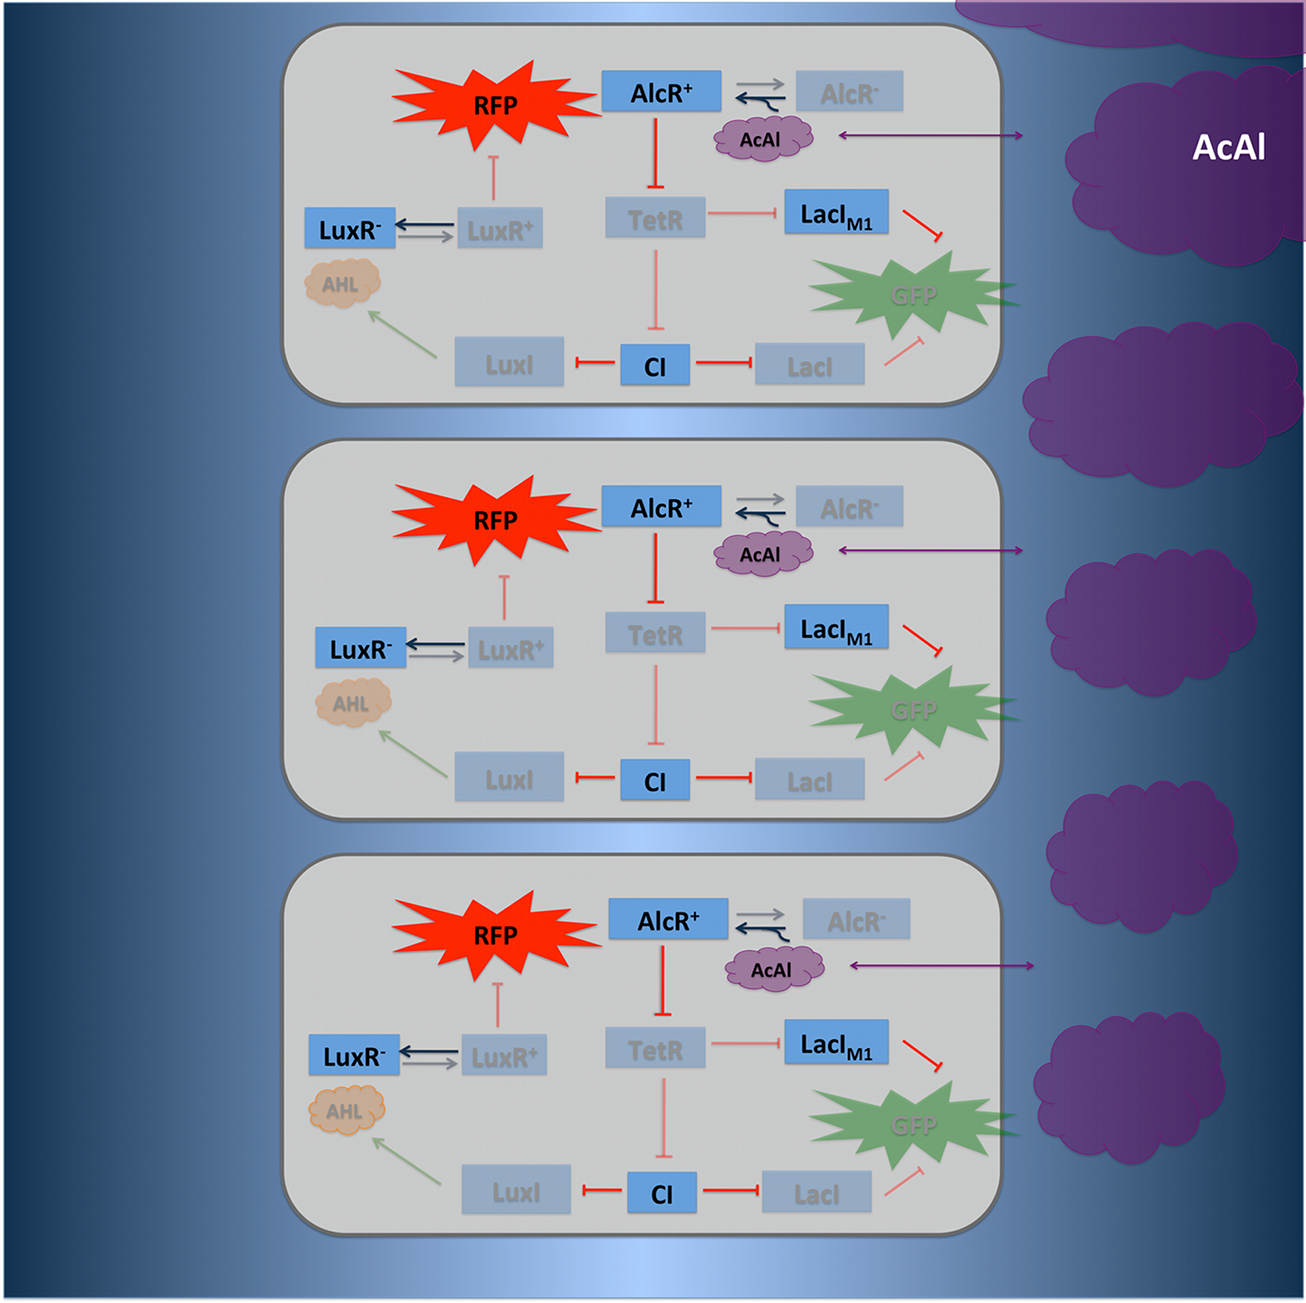
To realize the alarm signal for toxic acetaldehyde (xylene) concentrations (see Figure 5), we put the N-Acyl homoserine lactone (AHL) Synthase LuxI under the transcriptional control of CI, which is thus expressed only at low acetaldehyde (xylene) concentrations. LuxI syntesizes the small signaling molecule AHL which can quickly diffuse through the cell membrane in the extracellular space. Due to its relatively high diffusion constant, AHL diffuses through the whole tube and, thus, is present even in cells where no AHL is produced. Inside a cell, AHL can bind to its constitutively expressed receptor protein LuxR, and the thus activated LuxR represses the transcription of a red fluorescent protein (RFP). The transcriptional activator LuxR is used as an repressor in that case. Therefore we used a constructed artificial lacZ promoter with the lux box between -10 and -35 region. Thus, if the acetaldehyde concentration is below a threshold at least for a large enough minority of the cells in the channel, RFP is repressed in all cells. Only if the acetaldehyde concentration is above the threshold for all cells, no AHL is present in the channel and RFP is produced. Thus, the alarm signal RFP can be used to signal critical and potentially dangerous acetaldehyde (xylene) concentrations.
 "
"


