Team:ETH Zurich/Achievements/Results
From 2011.igem.org
| Experimental Results | |
| Experimental results for the characterization of our BioBrick parts. | |
Results of BBa_K625000/BBa_K625001 characterization
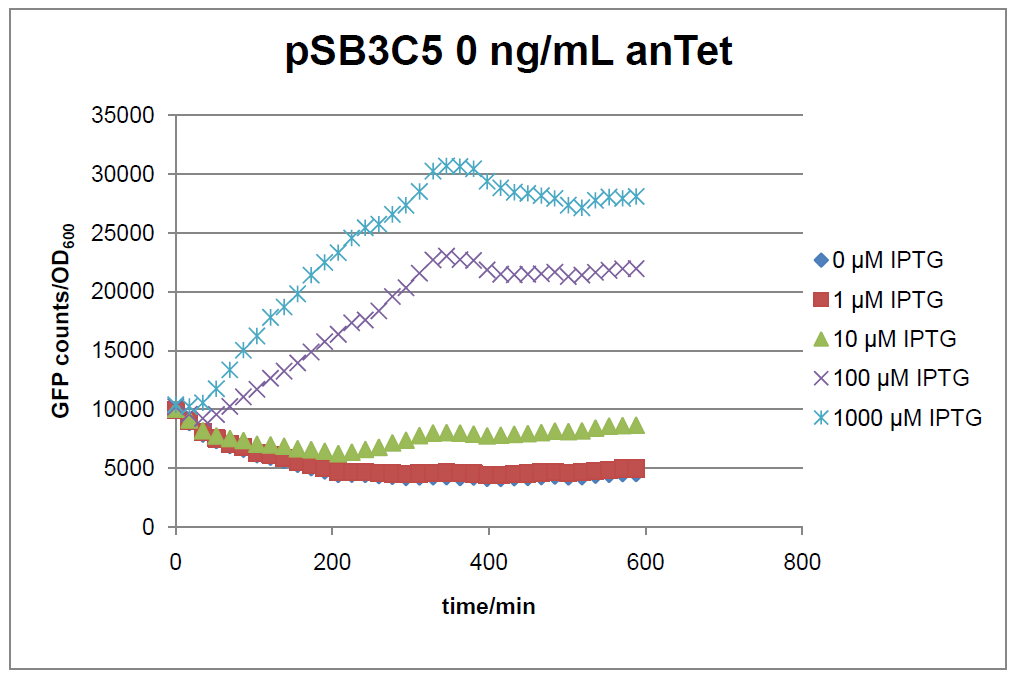
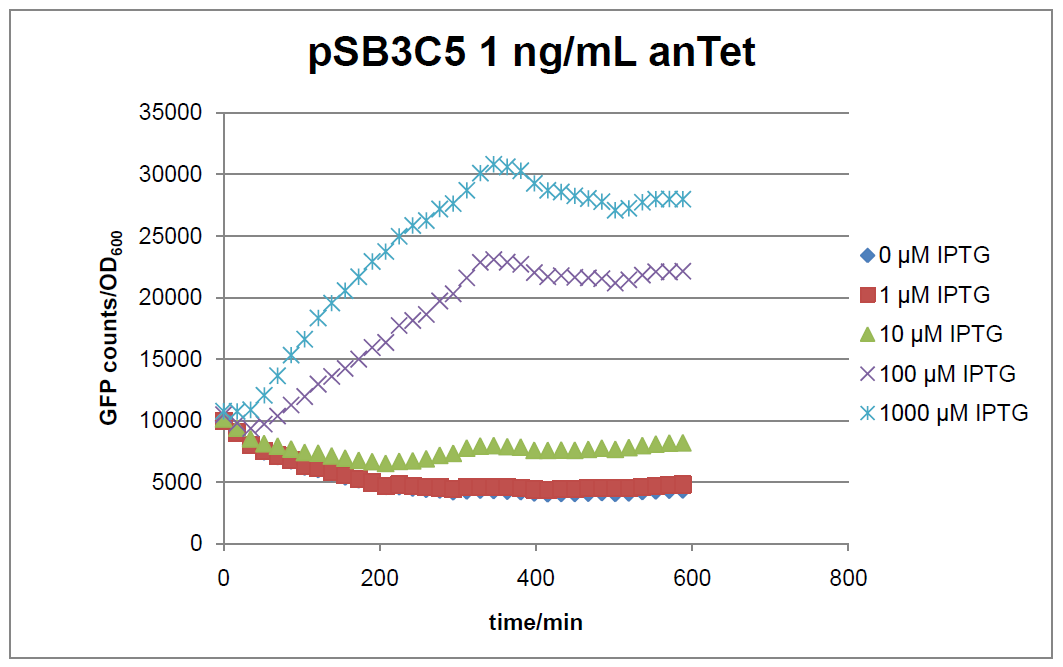
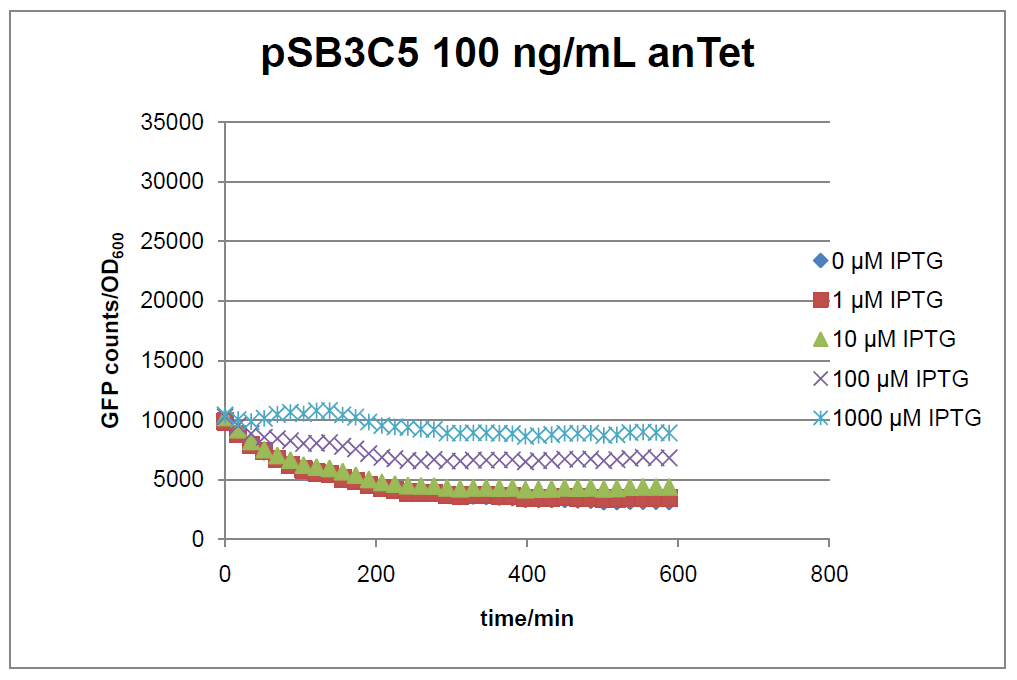
Figure 1: time course of fluorescence depending on different expression levels of the transcriptional regulator LacIM1. pSB3C5 was used as plasmid backbone for the test system.
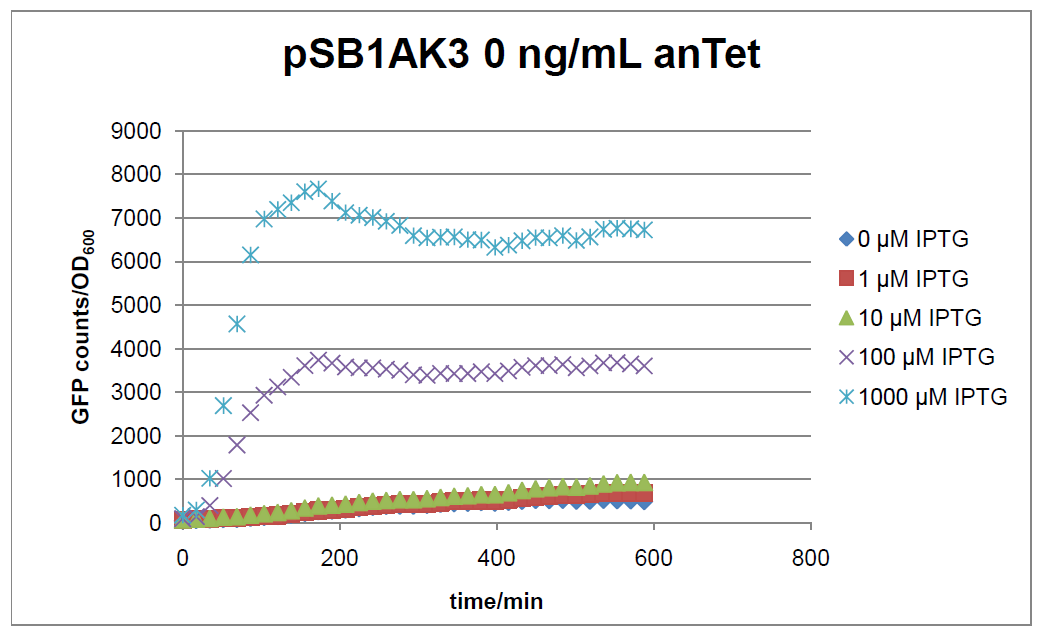
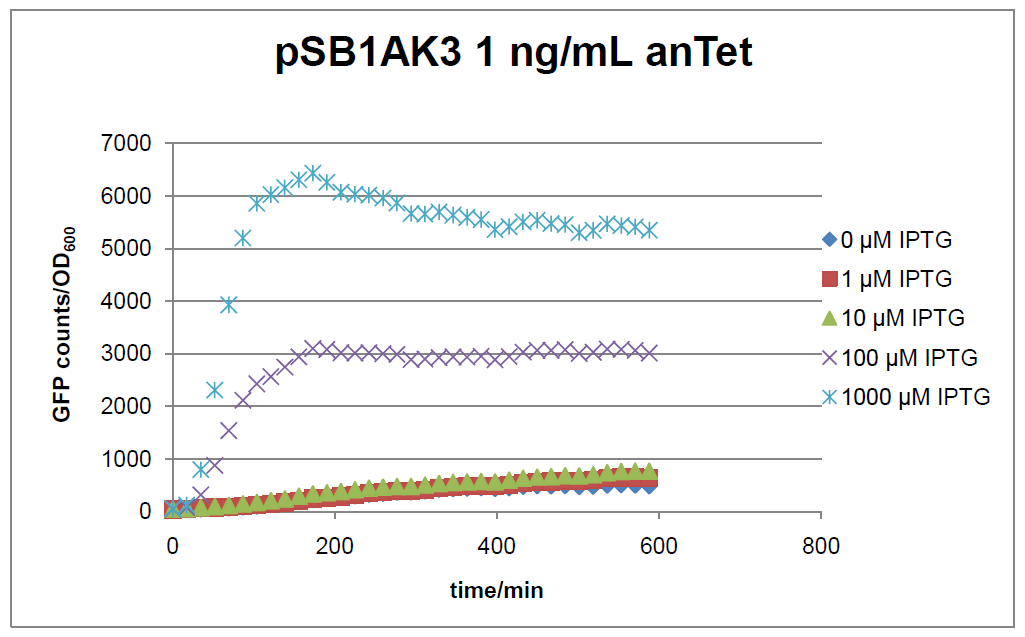
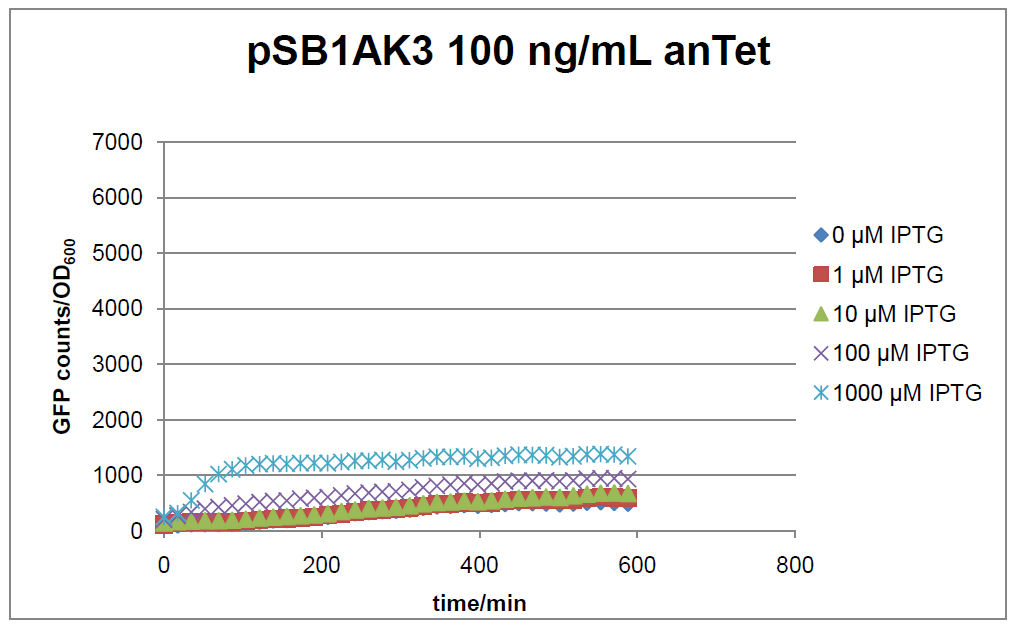
Figure 2: time course of fluorescence depending on different expression levels of the transcriptional regulator LacIM1. pSB1AK3 was used as plasmid backbone for the test system.
A detailed description of the experimental setup for the characterization part can be found in the Biology section.
In general the test system for characterization of our BioBrick parts BBa_K625000 respectively BBa_K625001 worked as expected. In both system we can see that the fluorescence decreases with increasing amounts of anhydrotetracycline. This indicates that LacIM1 is induced and thus represses the expression of gfp. By addition of IPTG LacIM1 gets inhibited and therefore the GFP response increses. This tendency can be observed both in figure 1 and figure 2.
At a concentration of 100 ng/mL anhydrotetracycline, only a slight increase in fluorescence can be observed for increasing IPTG concentrations. We are supposing that the expression of lacIM1 is fully induced at this level and thus the IPTG amount present in the system is not sufficient anymore to inhibit all of the LacIM1.
In the case where no anhydrotetracycline is present in the medium, there can still be observed a change in fluorescence depending on the level of IPTG. The same pattern of induction can be observed here as in the weakly induced systems. The reason for this is likely due to the leaky expression of the lacIM1 gene, resulting in a small amount of LacIM1 always present in the cells and thus inhibiting the GFP production.
After about 300 min for pSB3C5 and about 200 min for pSB1AK3, the cells enter stationary phase and the flourescence intensity and OD600 do not increase anymore.
Results of BBa_K625002/BBa_K625003 characterization
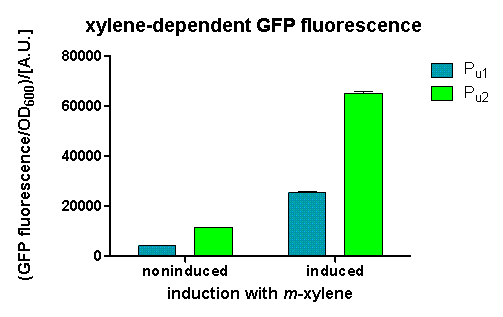
We could observe a clear increase in GFP fluorescence when m-xylene was added in a test tube. Thus GFP production can be induced by m-xylene present from the air. The results of the experiments can be seen in fig. 2. By comparing BBa_K625002 and BBa_K625003, we can see that the leaky expression of GFP is higher in the shortened promoter BBa_K625003 compared to the longer one. There are several possible reasons for this observation. Most likely it is due to the drop of the natural part downstream of the promoter, which is usually also included in Pu. Nevertheless, we could also see a higher level of induction in the setup with BBa_K625003 (around 7-fold) compared to the BBa_K625002 setup (around 5-fold). Thus both of the provided promoters can be used for transcriptional regulation with XylR.
Results for BBa_K625005
pSB6A5 is the version 5 BioBrick vector backbone of the medium copy (minimal pBR322 origin) pSB6A1 plasmid. This means, that the cassettes for the ORI and antibiotic resistance have been minimized (reduction of the size and transcriptional terminators flanking the prefix and the suffix have been added, to trancriptionally insulate the inserted parts from the vector backbone machinery and vice versa. This minimization yielded a reduction in size from 4022 bp to 2743 bp.
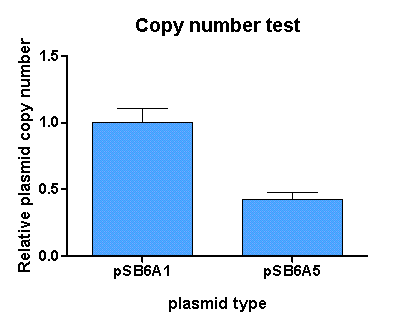
For comparison of the copy number of the plasmids, triplicates of OD normalized bacterial cultures containing the respective plasmids were miniprepped. The DNA concentration was then determined by an agarose DNA gel electrophoresis of EcoRI digests of the purified plasmids (Figure 4). This experiment showed a clear reduction in copy number of the minimized version of the original plasmid (Figure 5). Possible reasons for this could be deletion of some unknown regulatory sequences during minimization of the ORI or transcription from within the insert into the origin region in psB6A1 impacting the replication machinery.
 "
"
