Team:Cambridge/Experiments/Reflectin Thin Films VII
From 2011.igem.org
Contents |
Spectral Measurements of Thin Films
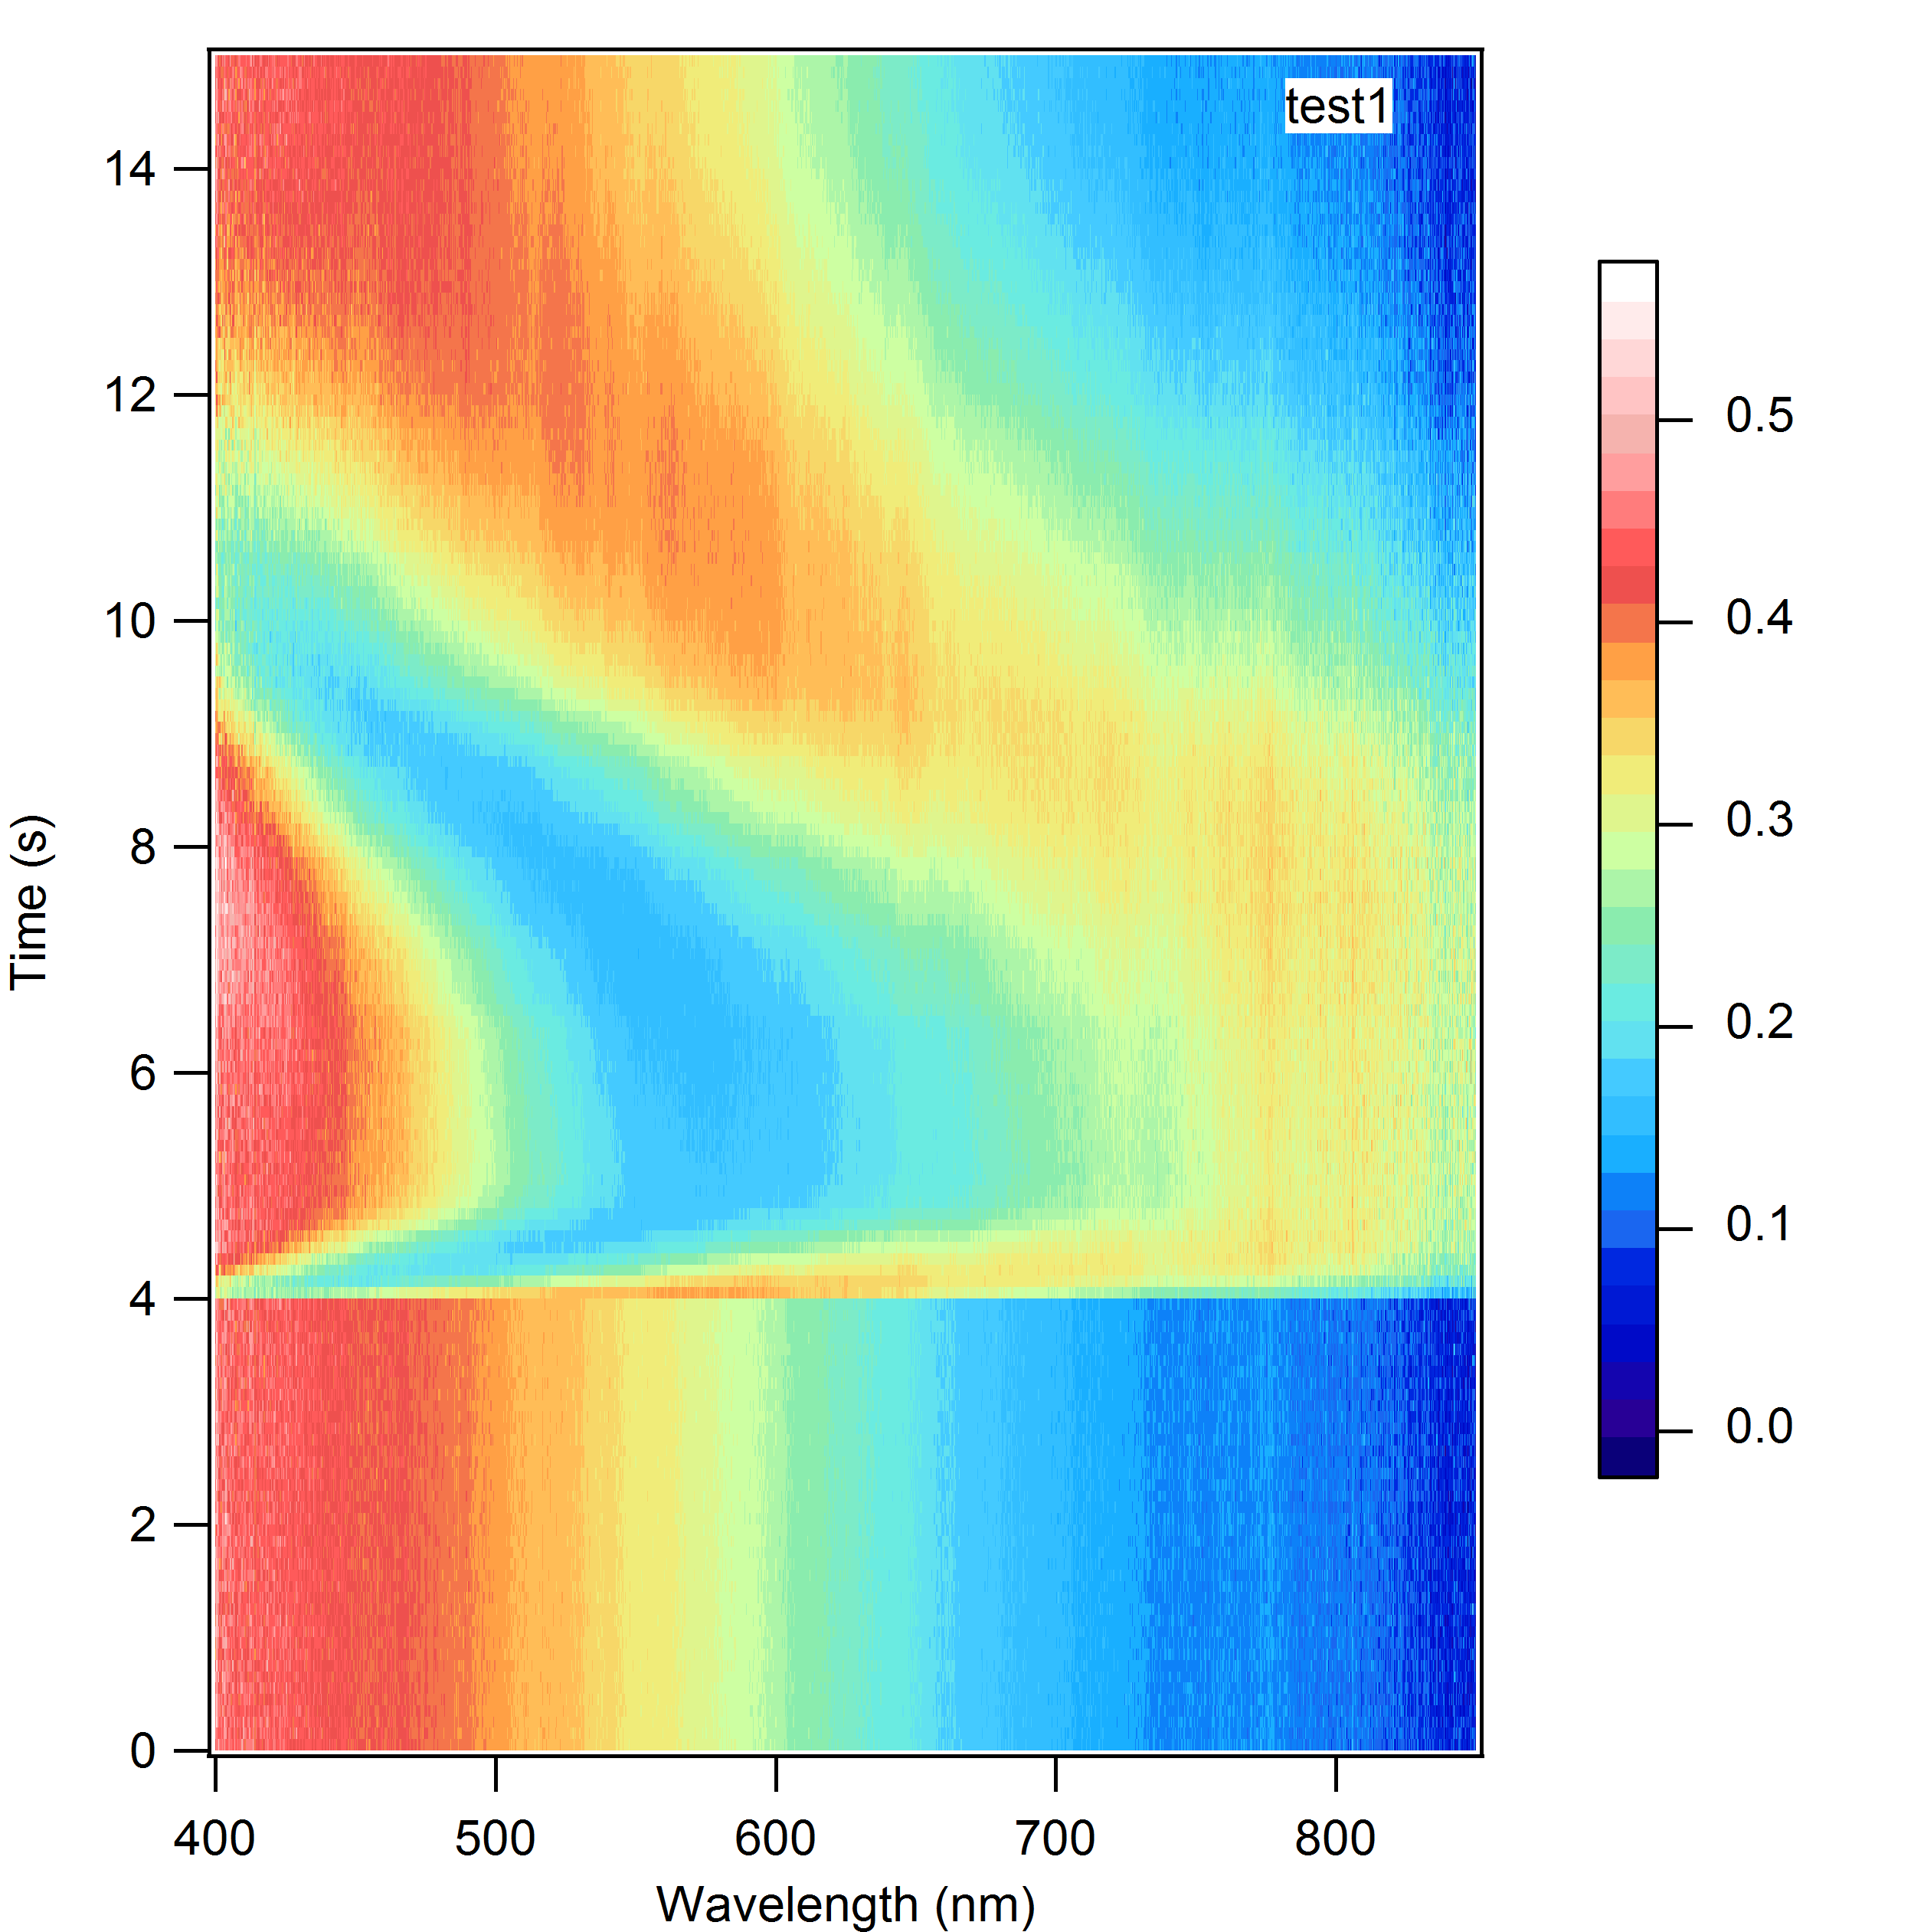
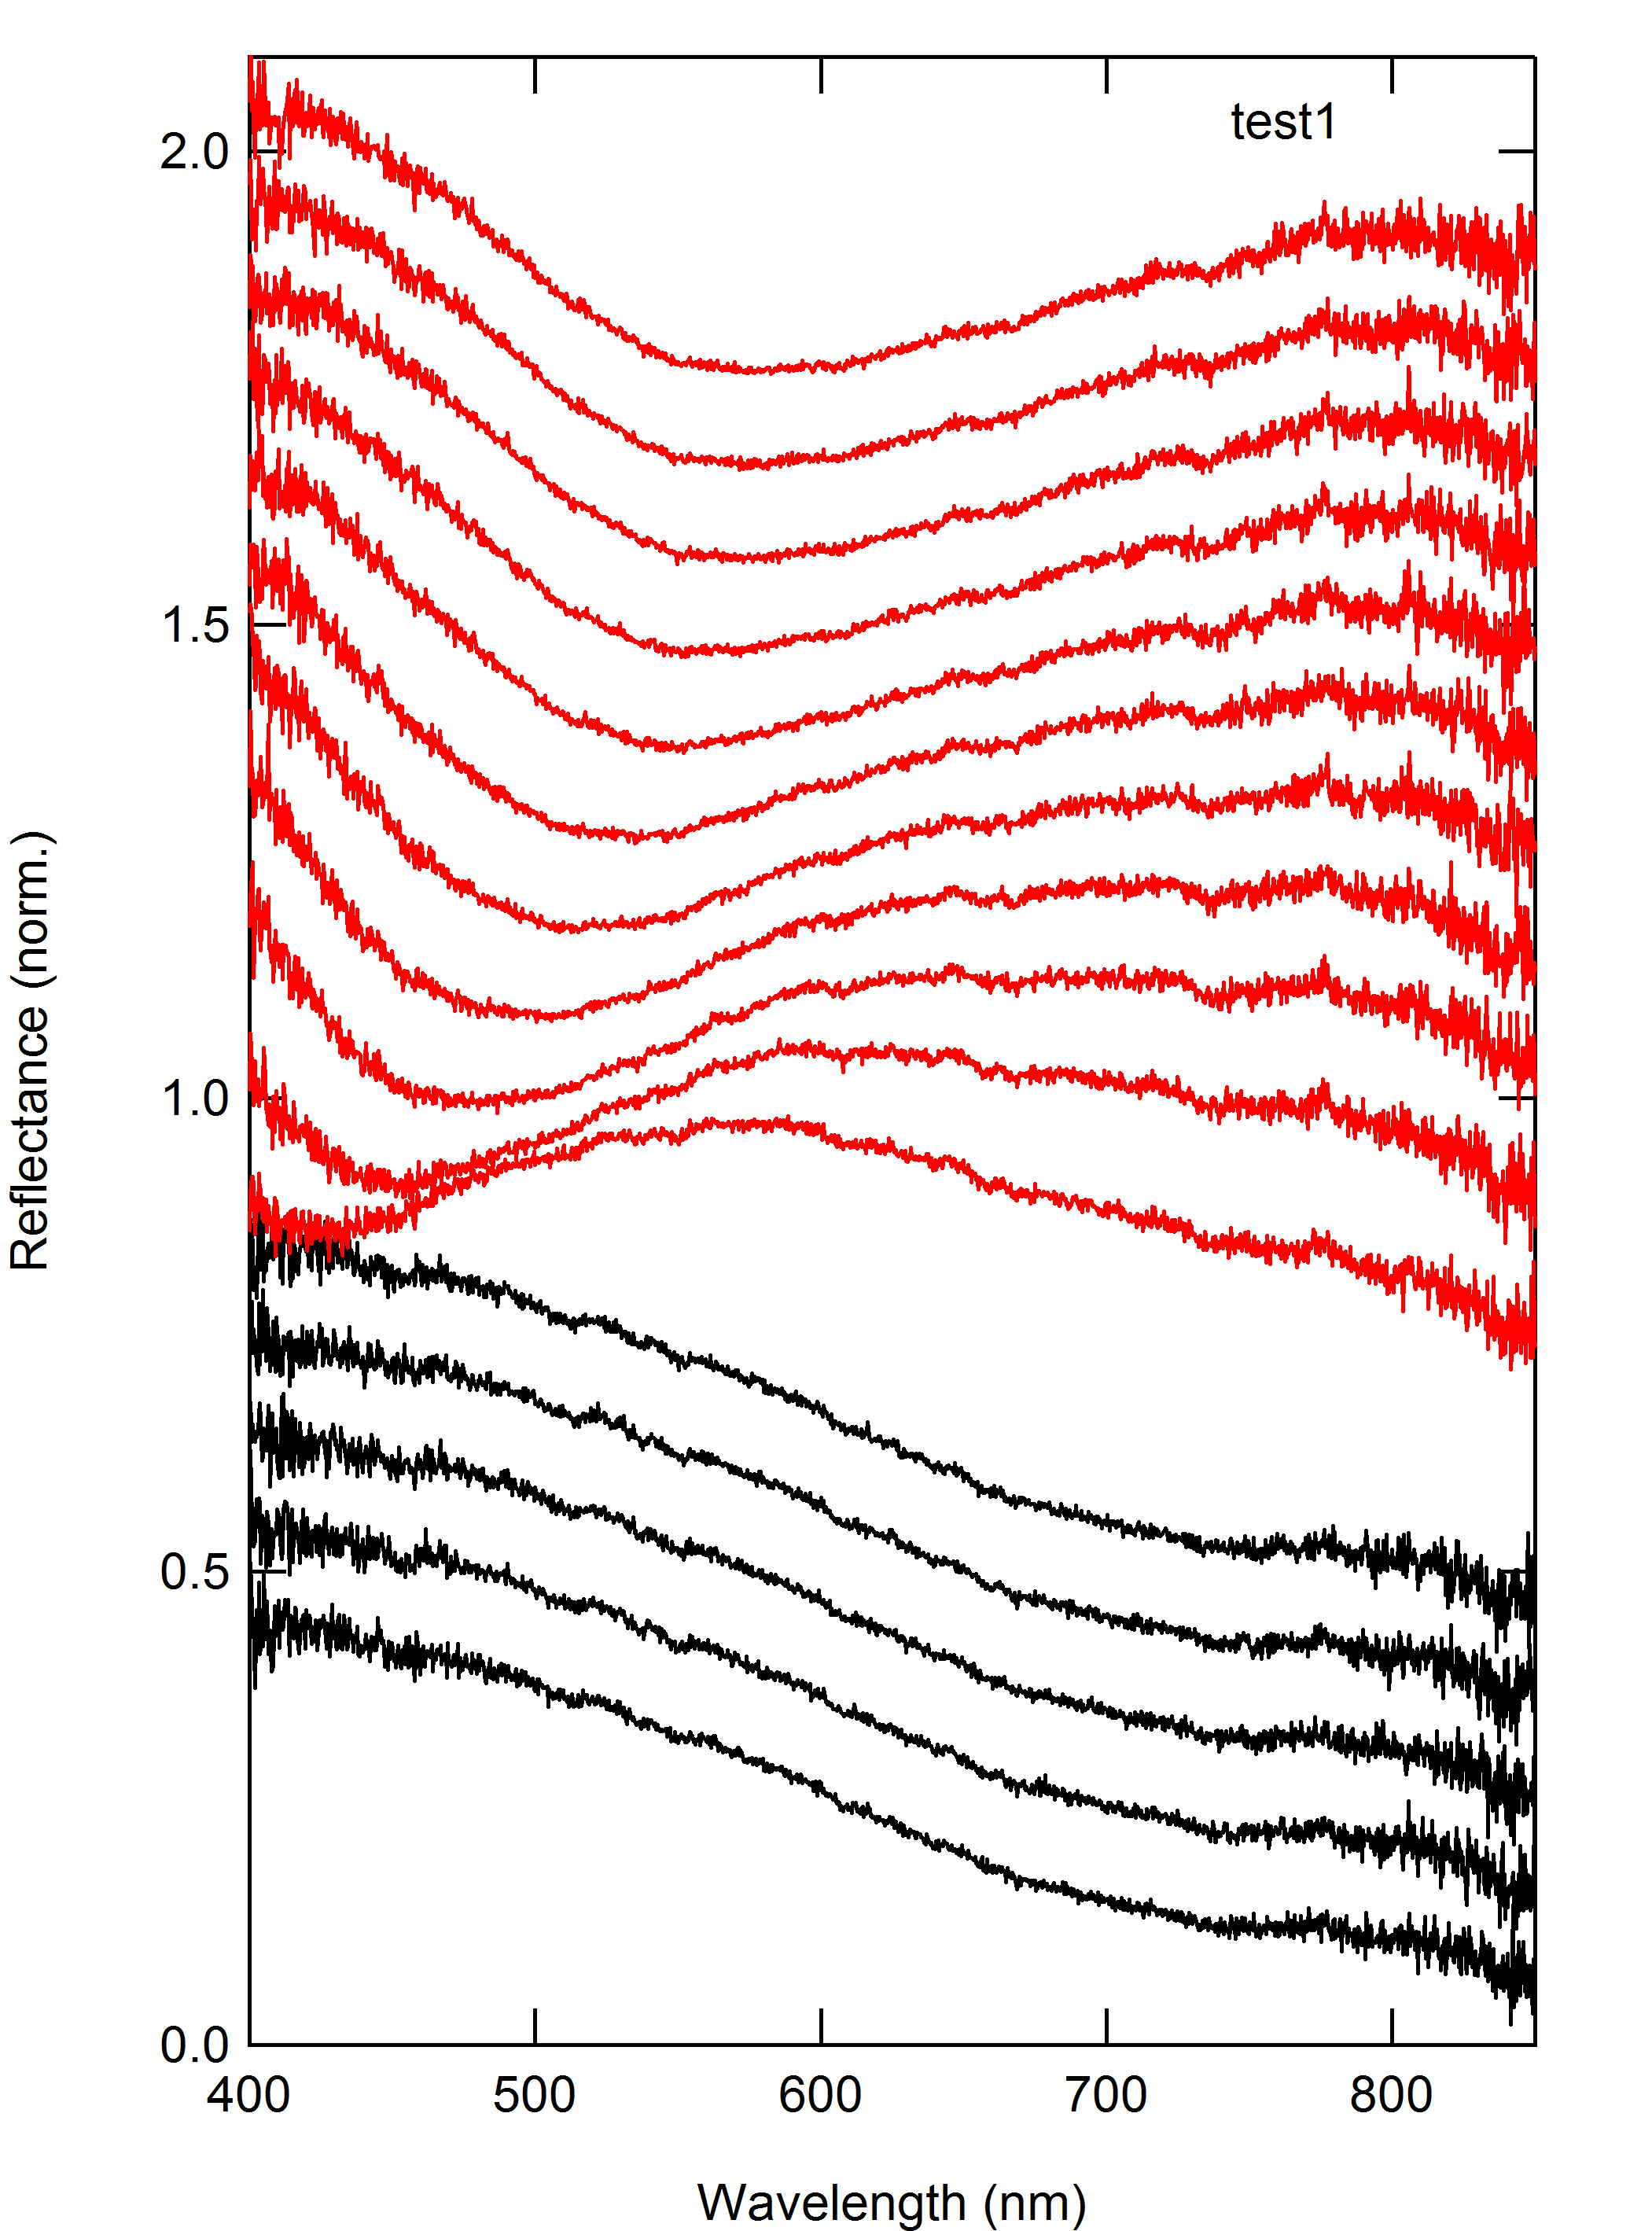
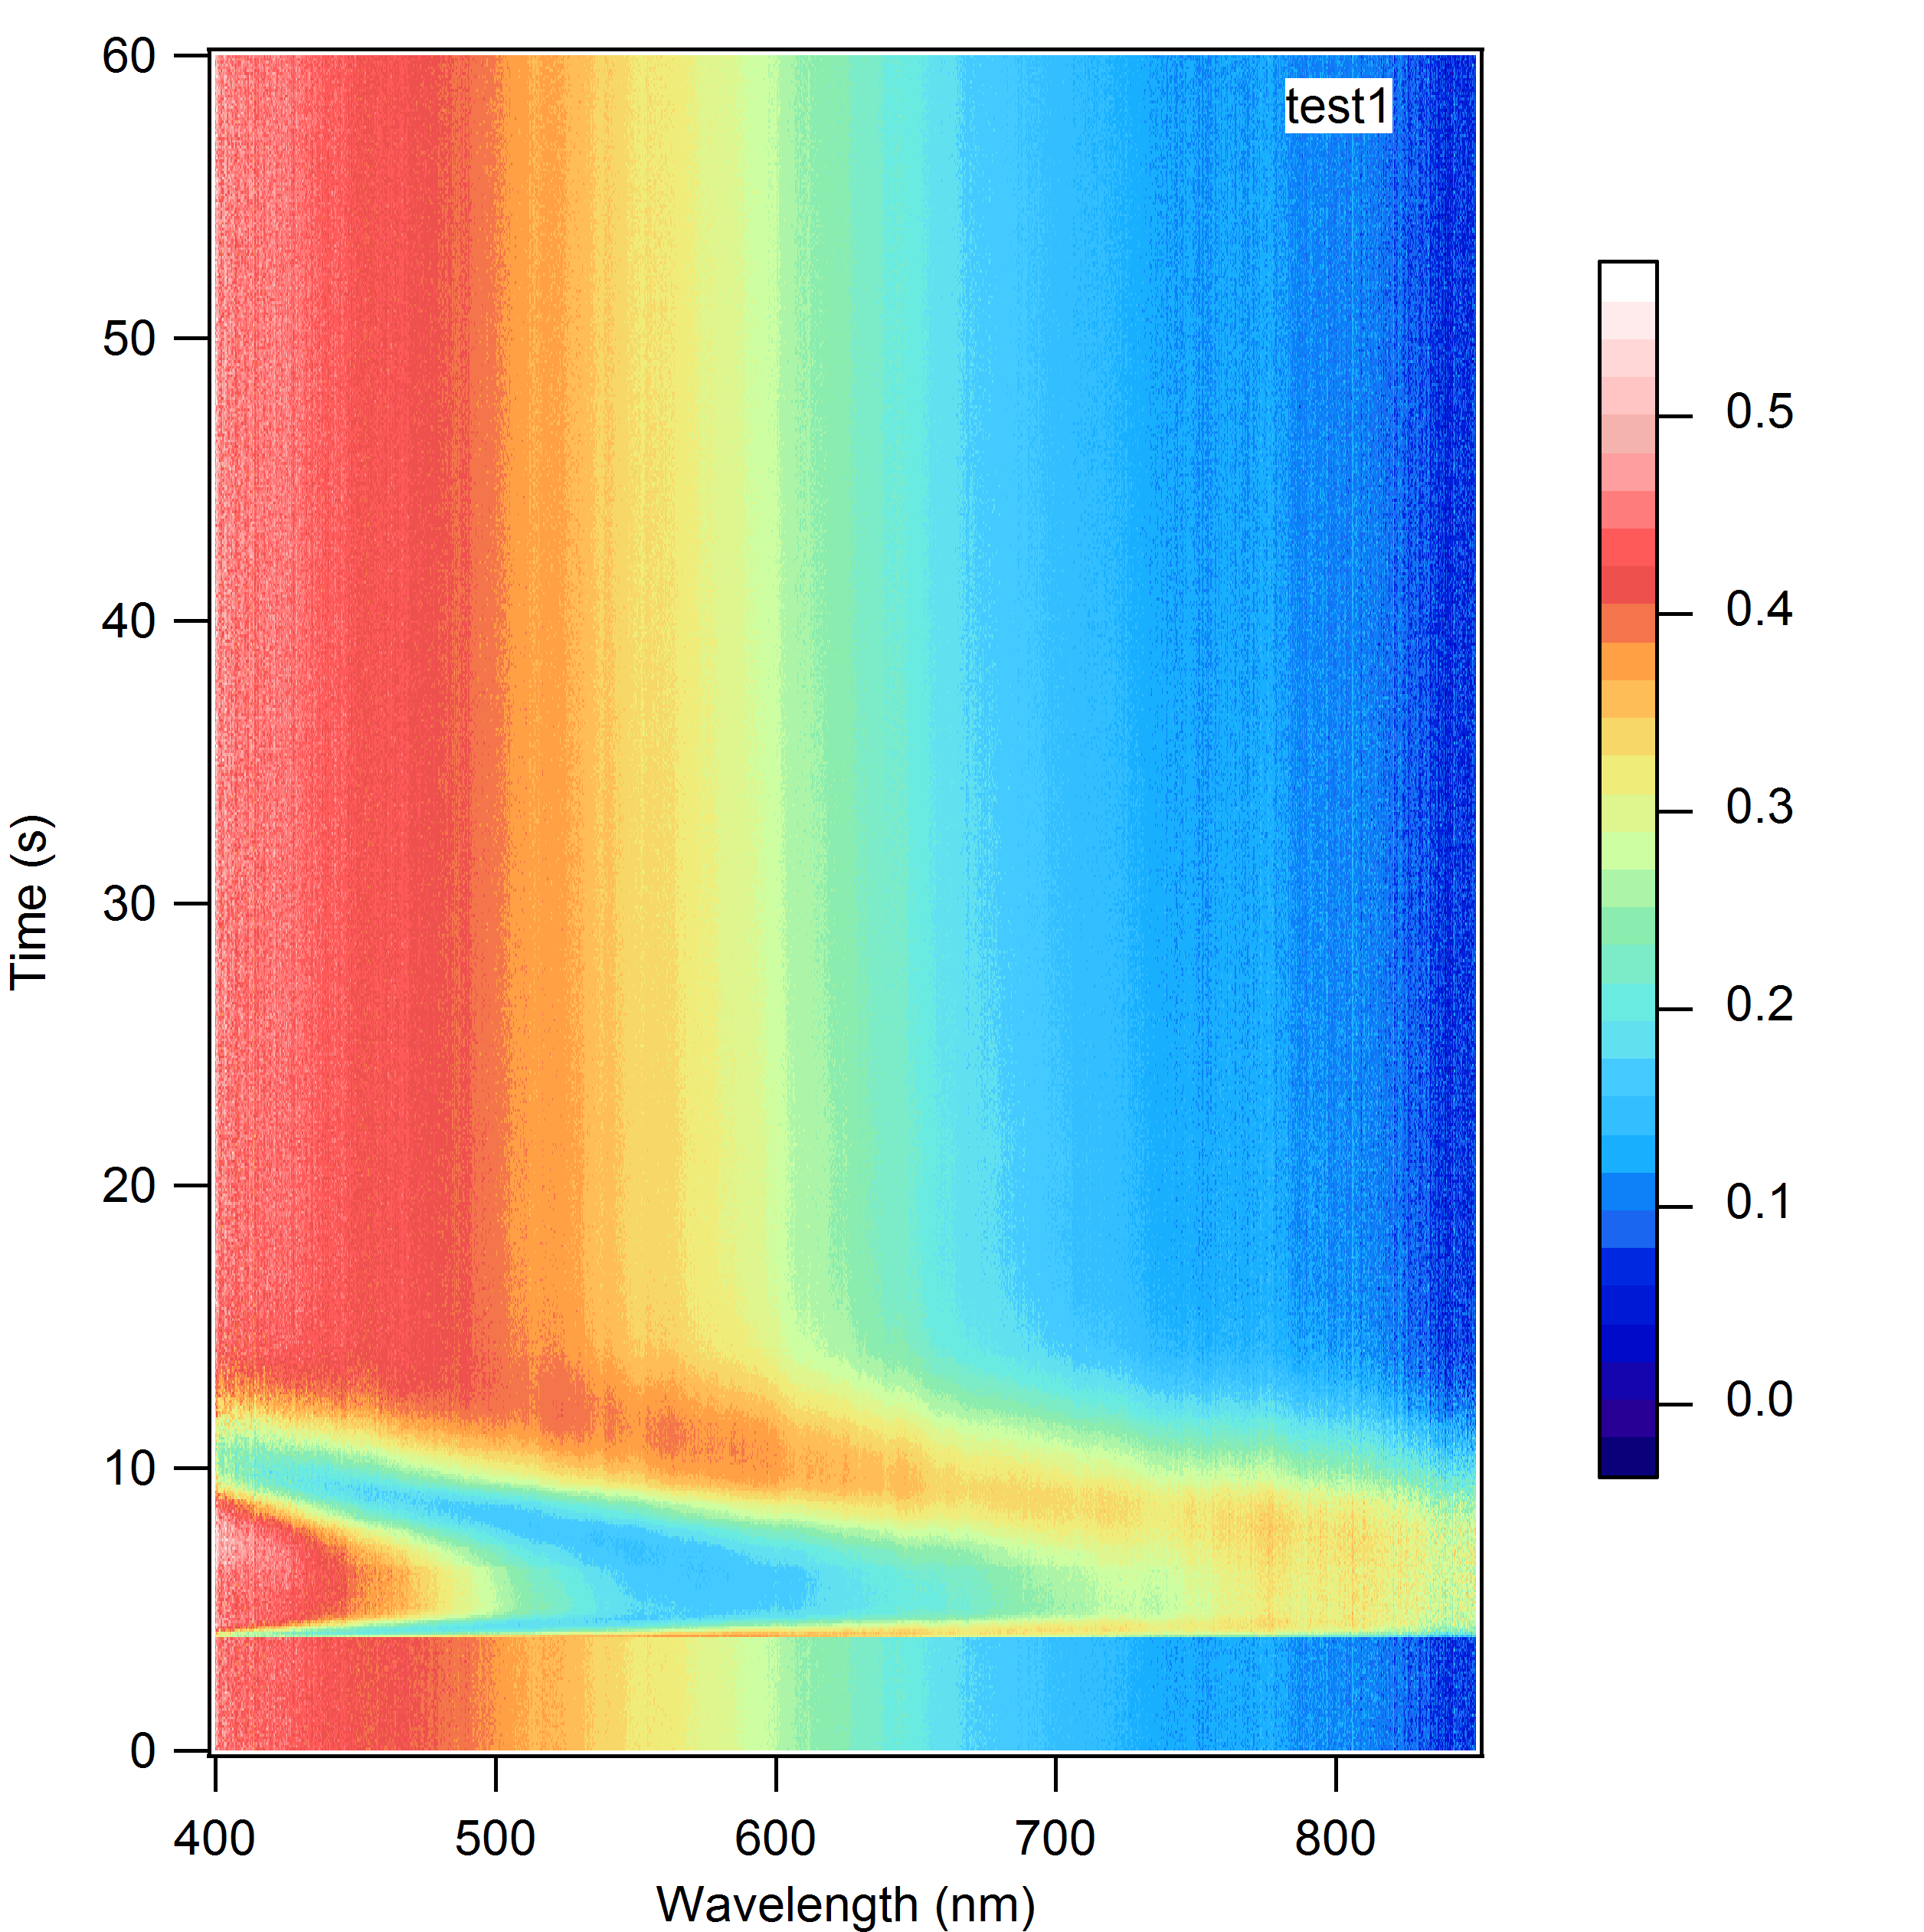
With the tris dialyzed samples we recorded spectral data to show that the films being spun were truly 'thin film' and we demonstrated the ability of the thin films to change colour upon breathing by recording video and spectral data when breathed upon under the microscope.
Single Layer Spectra
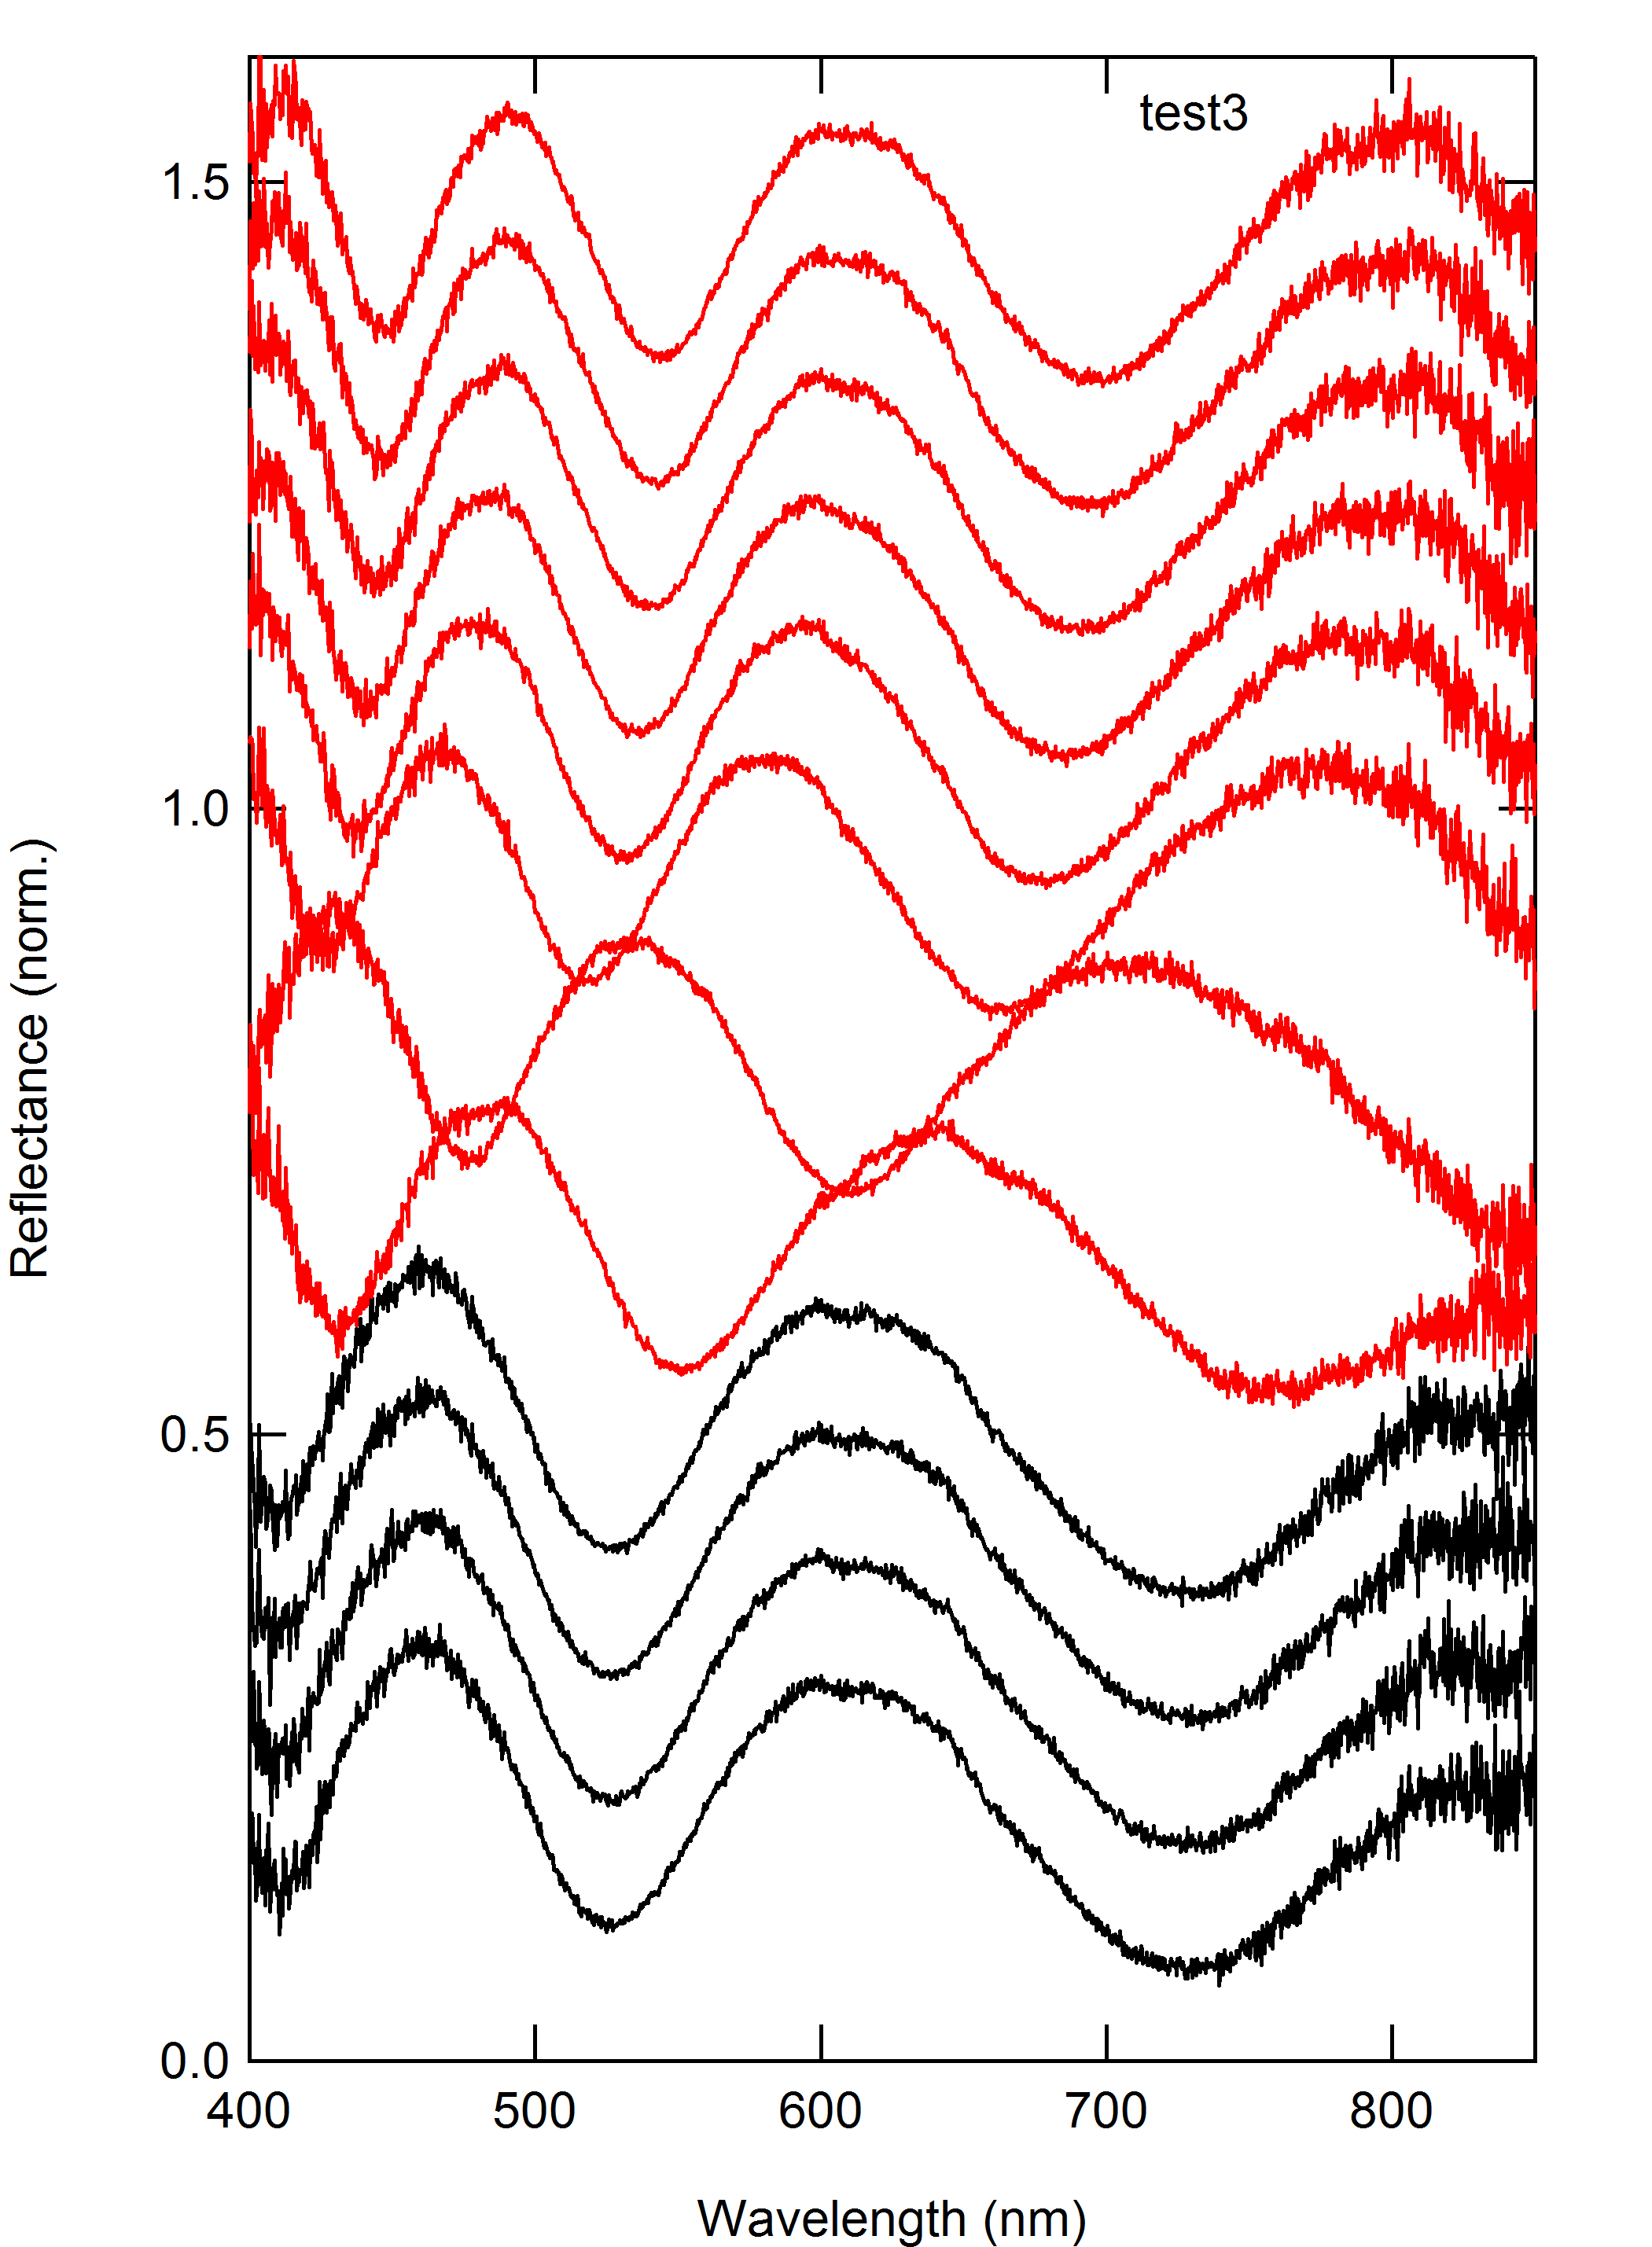
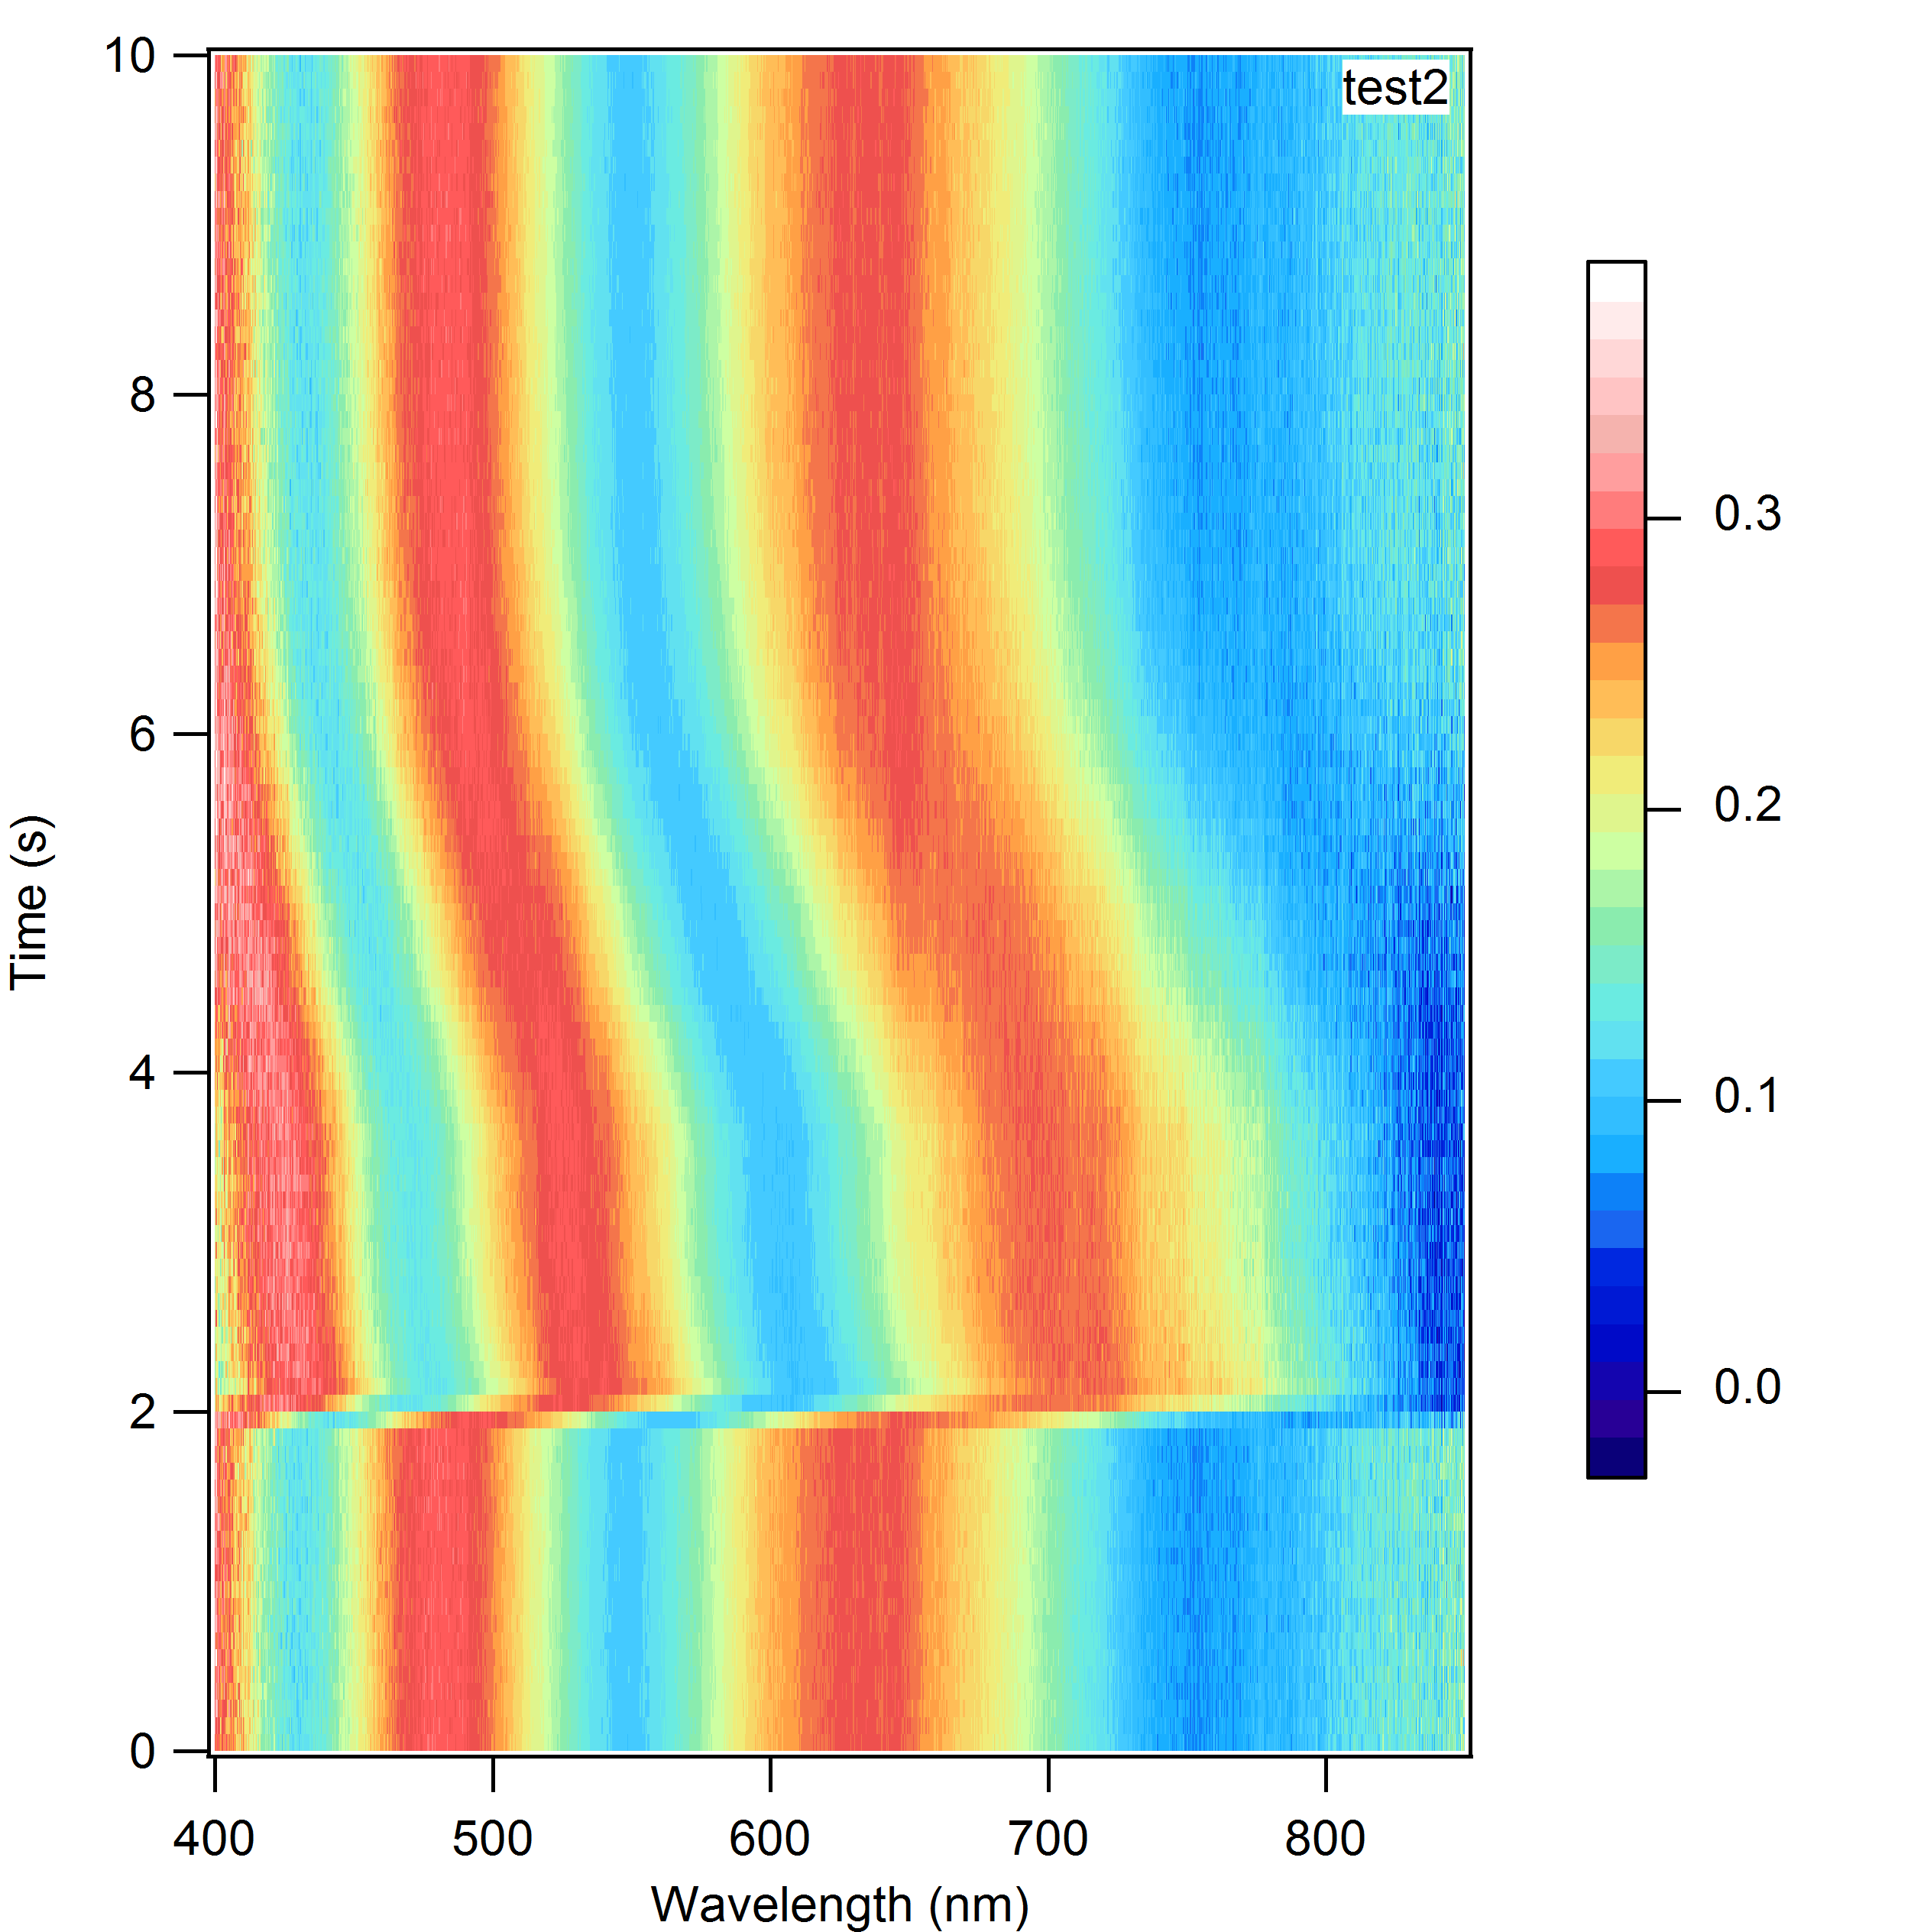
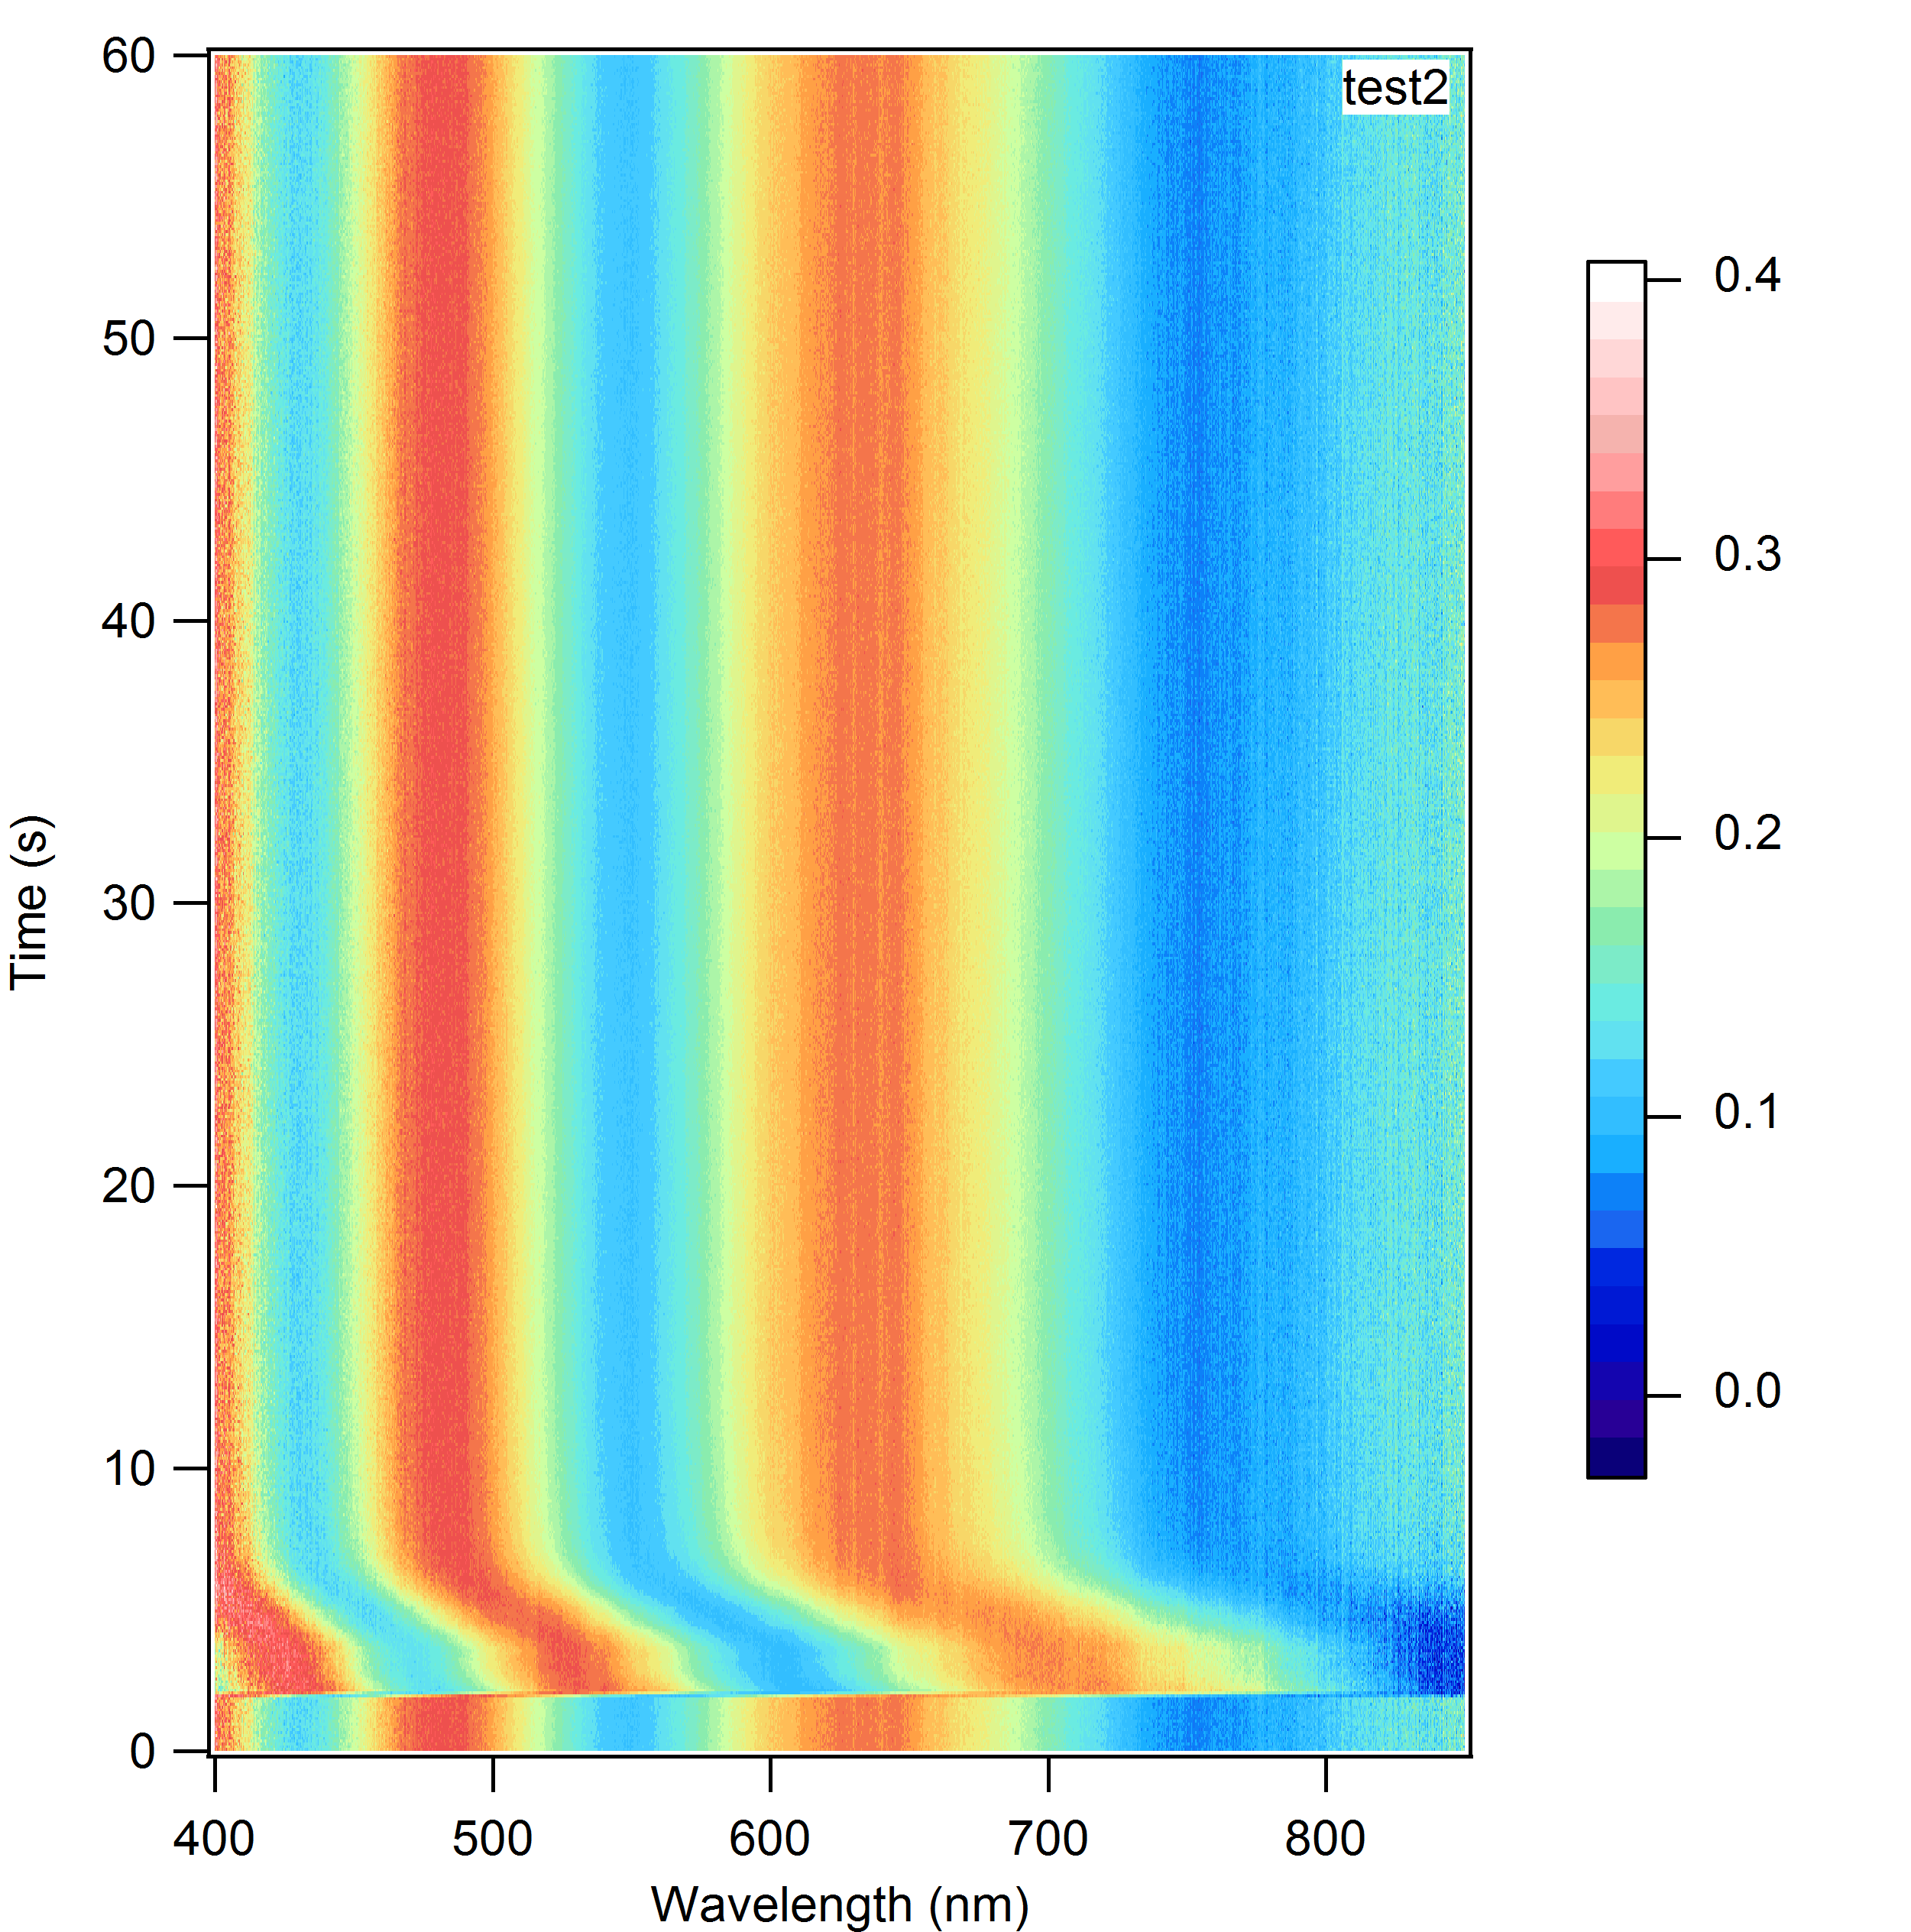
Looking at this we can see that by breathing we have been able to shift the colour of the film from blue to yellow. The presence of one dominant peak is an indication of the thickness of the film as we are only seeing one constructive interference determined by the dominant peak.
To view the changing film on its own click on this Youtube link
To view dynamic spectral data click on this Youtube link
To view full dynamic spectral data with embedded film simultaneously click on this Youtube link
Double Layer Spectra
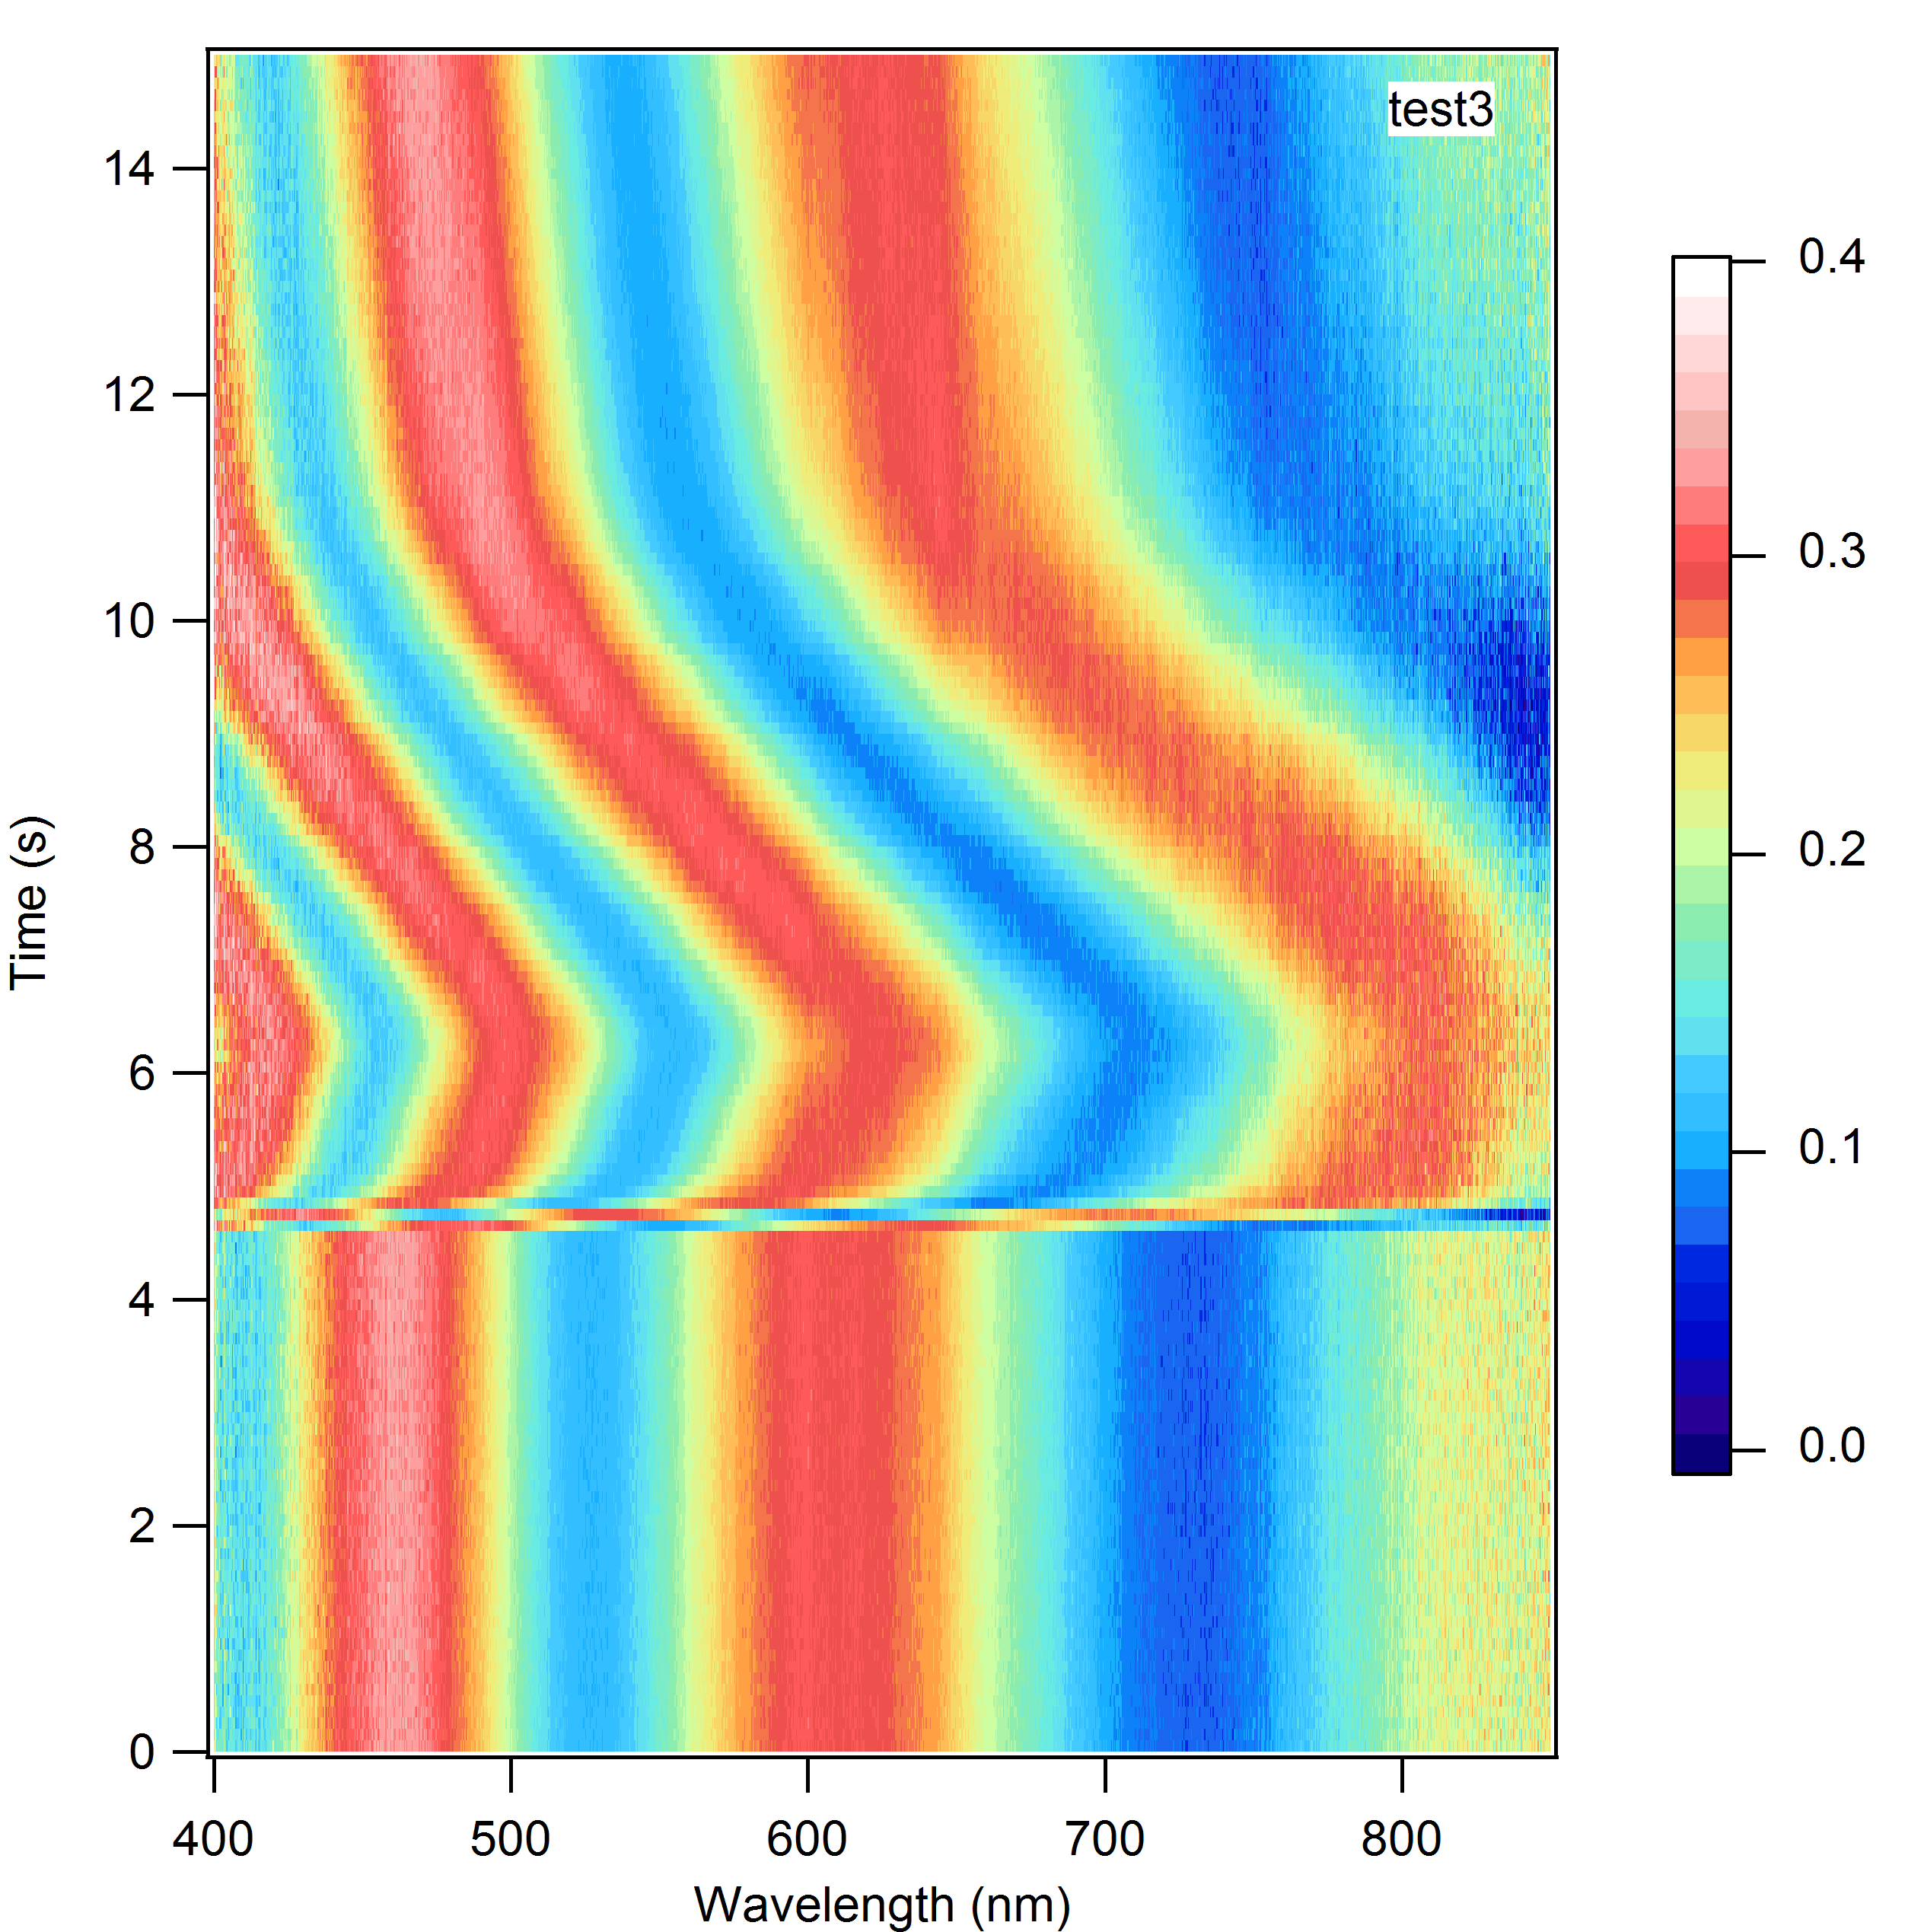
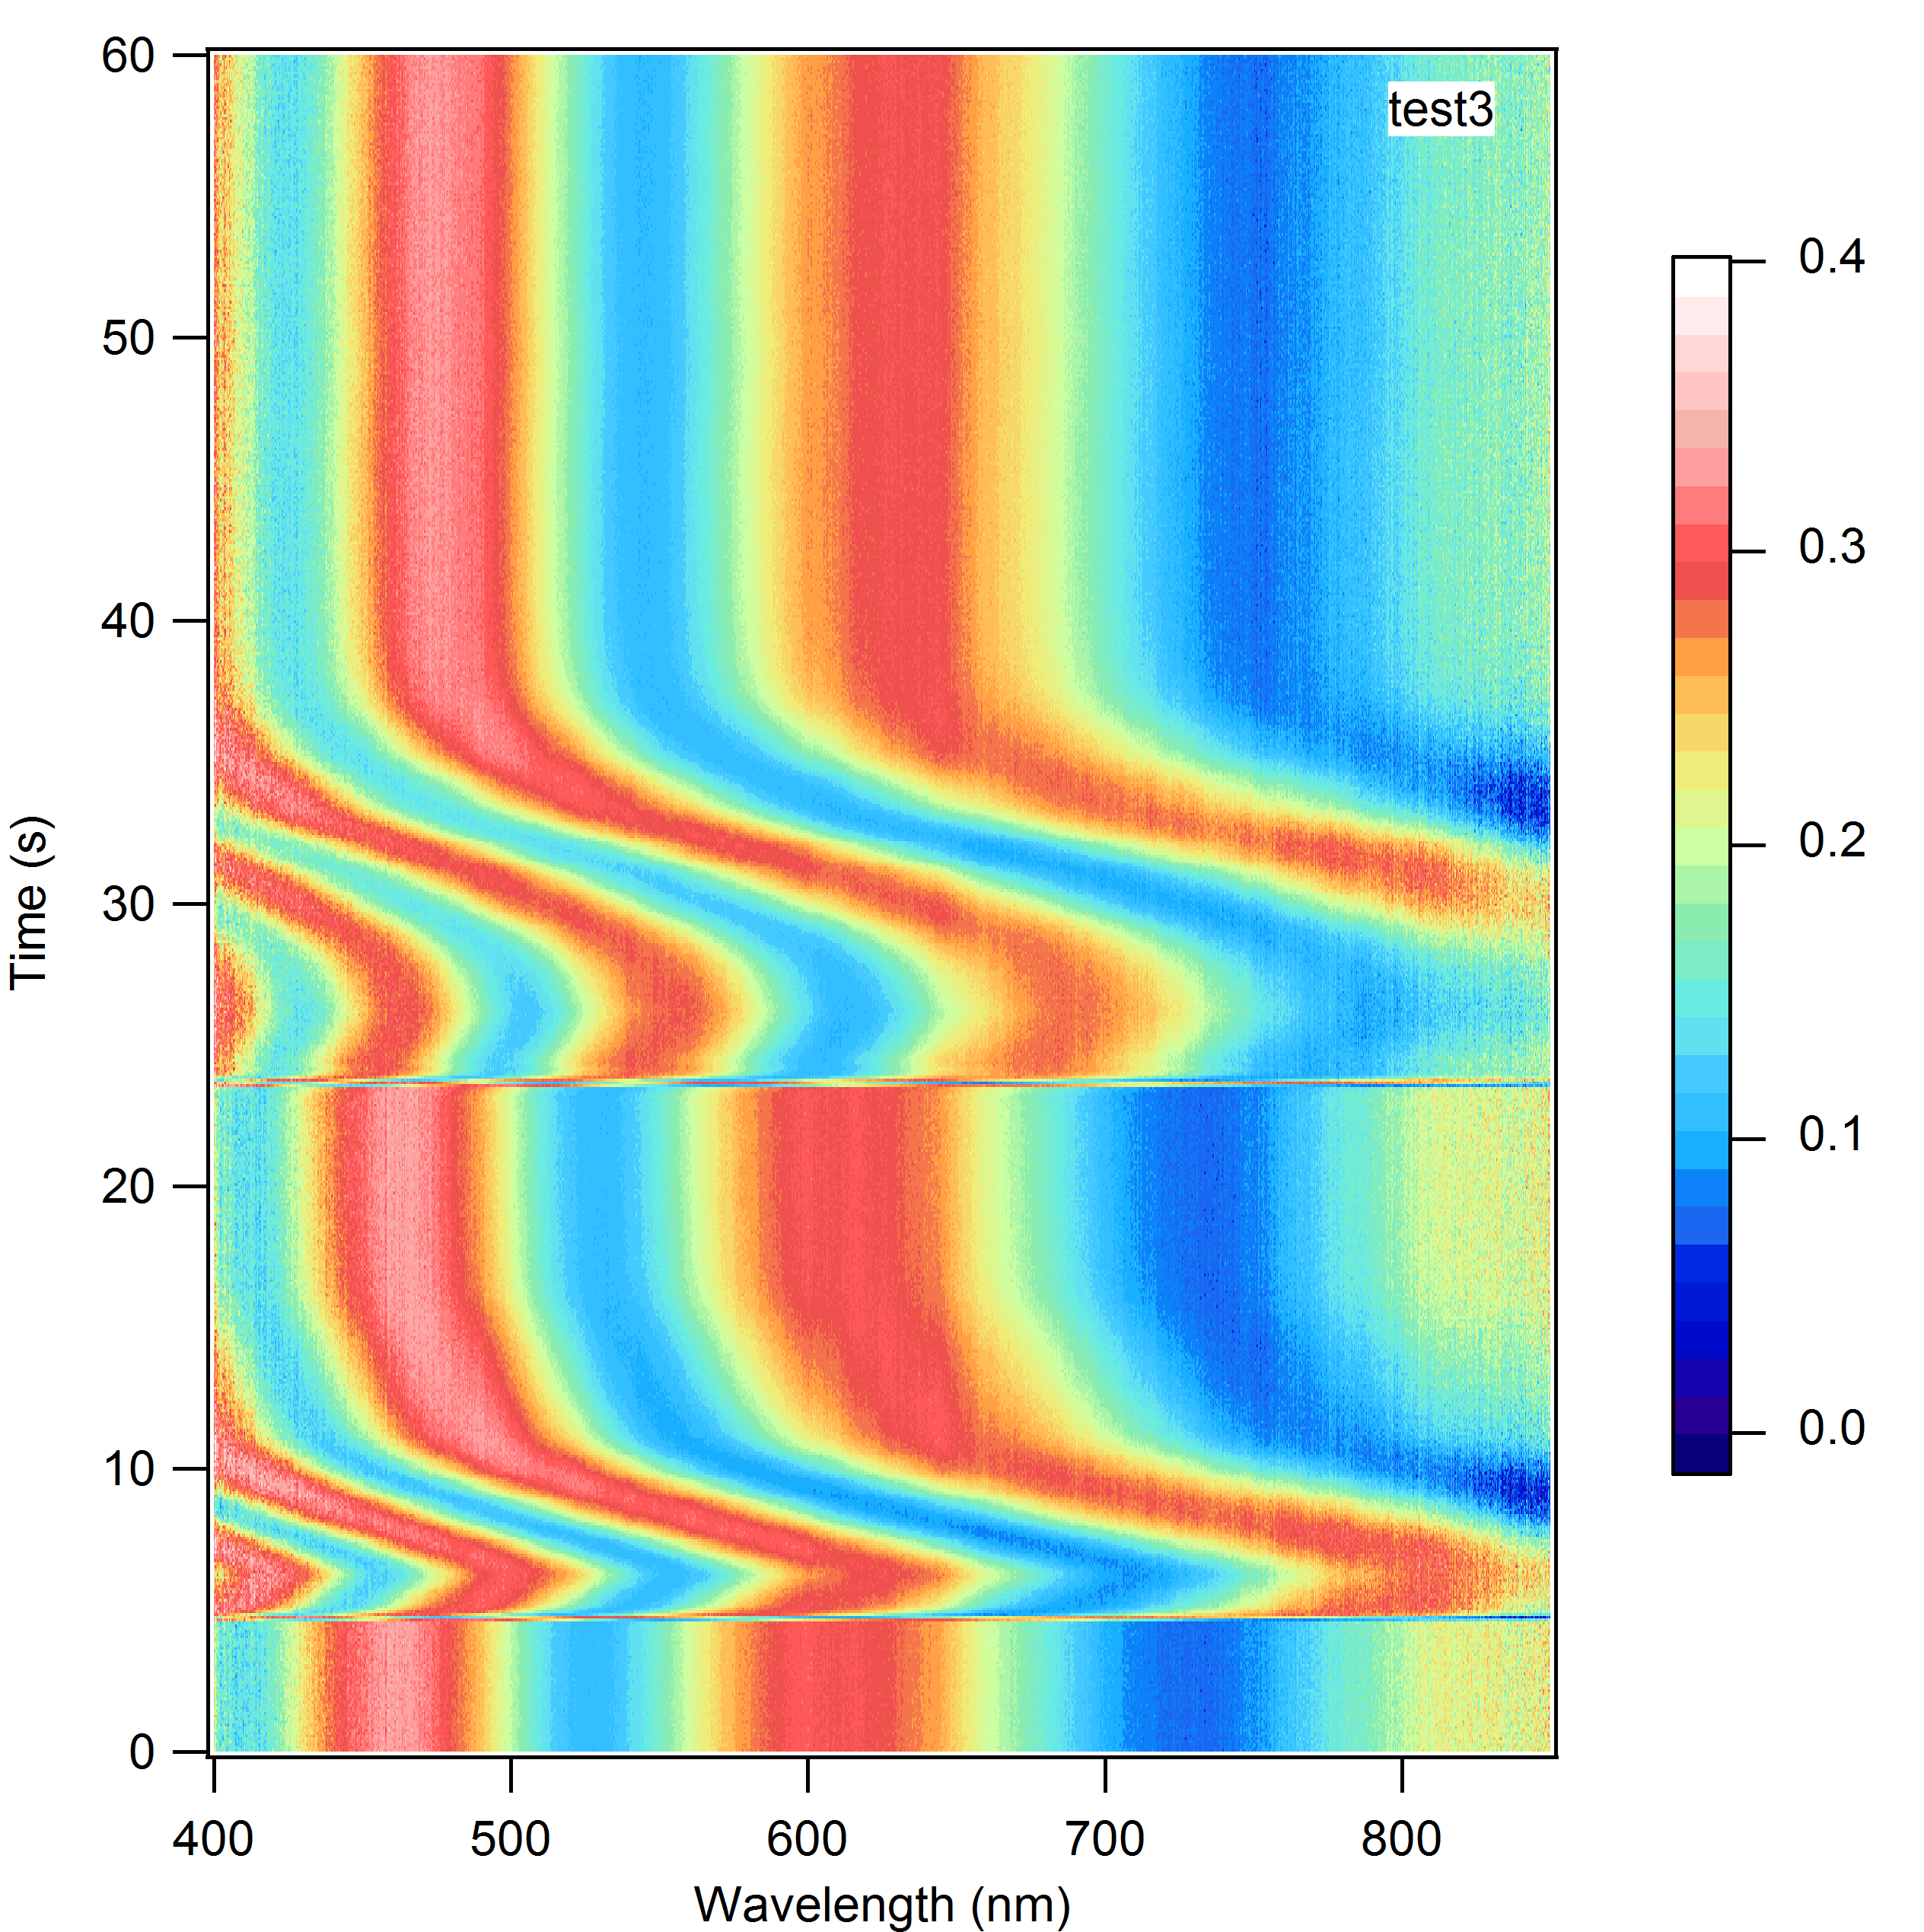
This spectra was captured from a double layer with first layer PDMS, 2nd layer reflectin. You can see from the photos that this film is much thicker than before with multiple maxima and minima where the maxima indicate constructive interference and minima indicating destructive interference. The major difference between the two layer and three layer films is primarily there is a greater shift in wavelength because there is no hydrophobic PDMS layer on top preventing swelling of the reflectin layer. We show in the PDMS control that the hydrophobic PDMS does not swell under breathing. Therefore colouration changes in multilayers are all due to reflectin.
To view the changing film on its own click on this Youtube link
To view dynamic spectral data click on this Youtube link
To view dynamic spectral data with embedded film changing colour click on this Youtube link
Triple Layer Spectra
The three layer spectra incidently should be more distinguishable however as mentioned with the dialyzed proteins they possessed a tendency to dewet which forms a non-uniform layer onto which the PDMS does not very well leading to a very non-uniform third layer which is also very thin.
To view the changing film on its own click on this Youtube link
To view dynamic spectral data click on this Youtube link
To view full dynamic spectral data alongside the film click on this Youtube link
PDMS Control
No response was observed under breathing except a mist of water droplets formed on top which quickly evaporated which incidentally indicates the layer is hydrophobic. This conclusively shows colour changes are due to swelling of the reflectin layers not PDMS.
Please see Youtube link here
Realtime Demo
I have also uploaded to youtube two video footage taken from my phone of the filming process for the spectral data with full view of the computer screen.
First video footage can be found here.
Second video footage can be found here.
Acknowledgements
We are obliged to Dr Matthew Hawkeye for helping us render the spectral data obtained from the microscope into video and graphs.
Back to Experiments
 "
"

