Setup
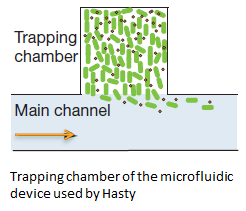
In order to physically constrain the bacteria, Hasty used a trapping chamber as depicted in Figure Xsome below. The chamber had the dimensions of 1X1 micron. This limited the cell growth to forming a monolayer (sentence). Excess cells and AHL were flushed away through the main chanel. [REF]
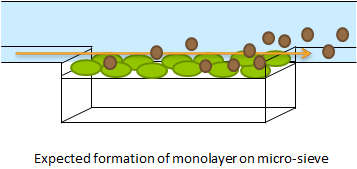
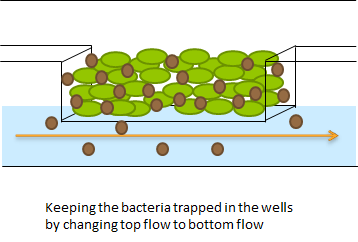
[ref]To create a monolayer, the micro-sieve seemed promising. The cells could be drawn toward the sieve by manually applying an under pressure with a syringe. Since the Top10 e.coli strain used for our transformations does not form biofilms, additional cells would be flushed away once all the pores of the micro-sieve are blocked. However the resulting flow over this monolayer turned out to be in the wrong dimensional plane (how to say this?). The direction of the flow over the micro-sieve can be seen in figure Xsome+1.
The setup as shown above imposes the problem that the diffusion of AHL is much slower than the flow rate over the sieve. Therefore the AHL produced will always be flushed away before a uniform concentration can be established over the whole cell culture, thus preventing any synchronized behaviour to arise. The use of a micro-sieve in the course of our iGEM project was therefore discarded.
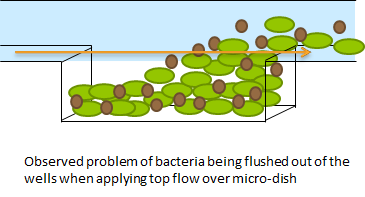
The problem described above does not arise when using the micro-dish. In the 40 micron deep wells the cells can be trapped and AHL will have a better chance to establish a uniform concentration througout the well. This will create a higher chance of synchronized oscillatory behaviour of the cells growing in a well. Special care has to be taken with the velocities of the fluid flowing over the wells. If the flow rate is to high, the cells will be spilled out of the wells. This behaviour was also observed under the microscope.
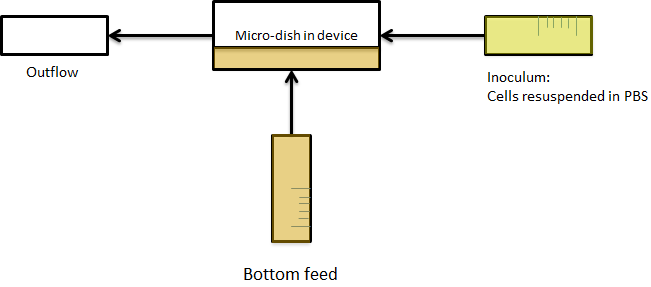
As a result, the bacteria were bottom fed as seen in the scheme in figure Xsomeplussomemore. This allowed the measurements to be taken continuously for various hours.
Fig.Xwhatever: Applying bottom feeding to keep the cells in the wells alive
Another concern for the setup of the device was to be able to gain control over the flow rate. According to Bernoulli's principle, the velocity of a fluid can be influenced by varying the height of the medium bottle. This approach was also used in the paper cited above. Figure X. shows the corresponding setup and the applying equations.

Fig.X: Setup of the device using Bernoulli's principle to control the velocity of the fluid.
However, as described on the modeling page, the dimensions of our fluidic device did not allow the aimed for precise control over the flow rate. This was tested both by calculating some theoretical values applicable for our device and running pilot experiments with water. Furthermore the obtained flow rates were also much faster than the flow rates in which oscillations were to be expected. This was solved by expanding our setup to incorporate the use of a syringe pump which controls the inflow. Figure X+1 shows the new setup.
Fig.X+1: Setup of the device using a pump to control the velocity of the fluid.
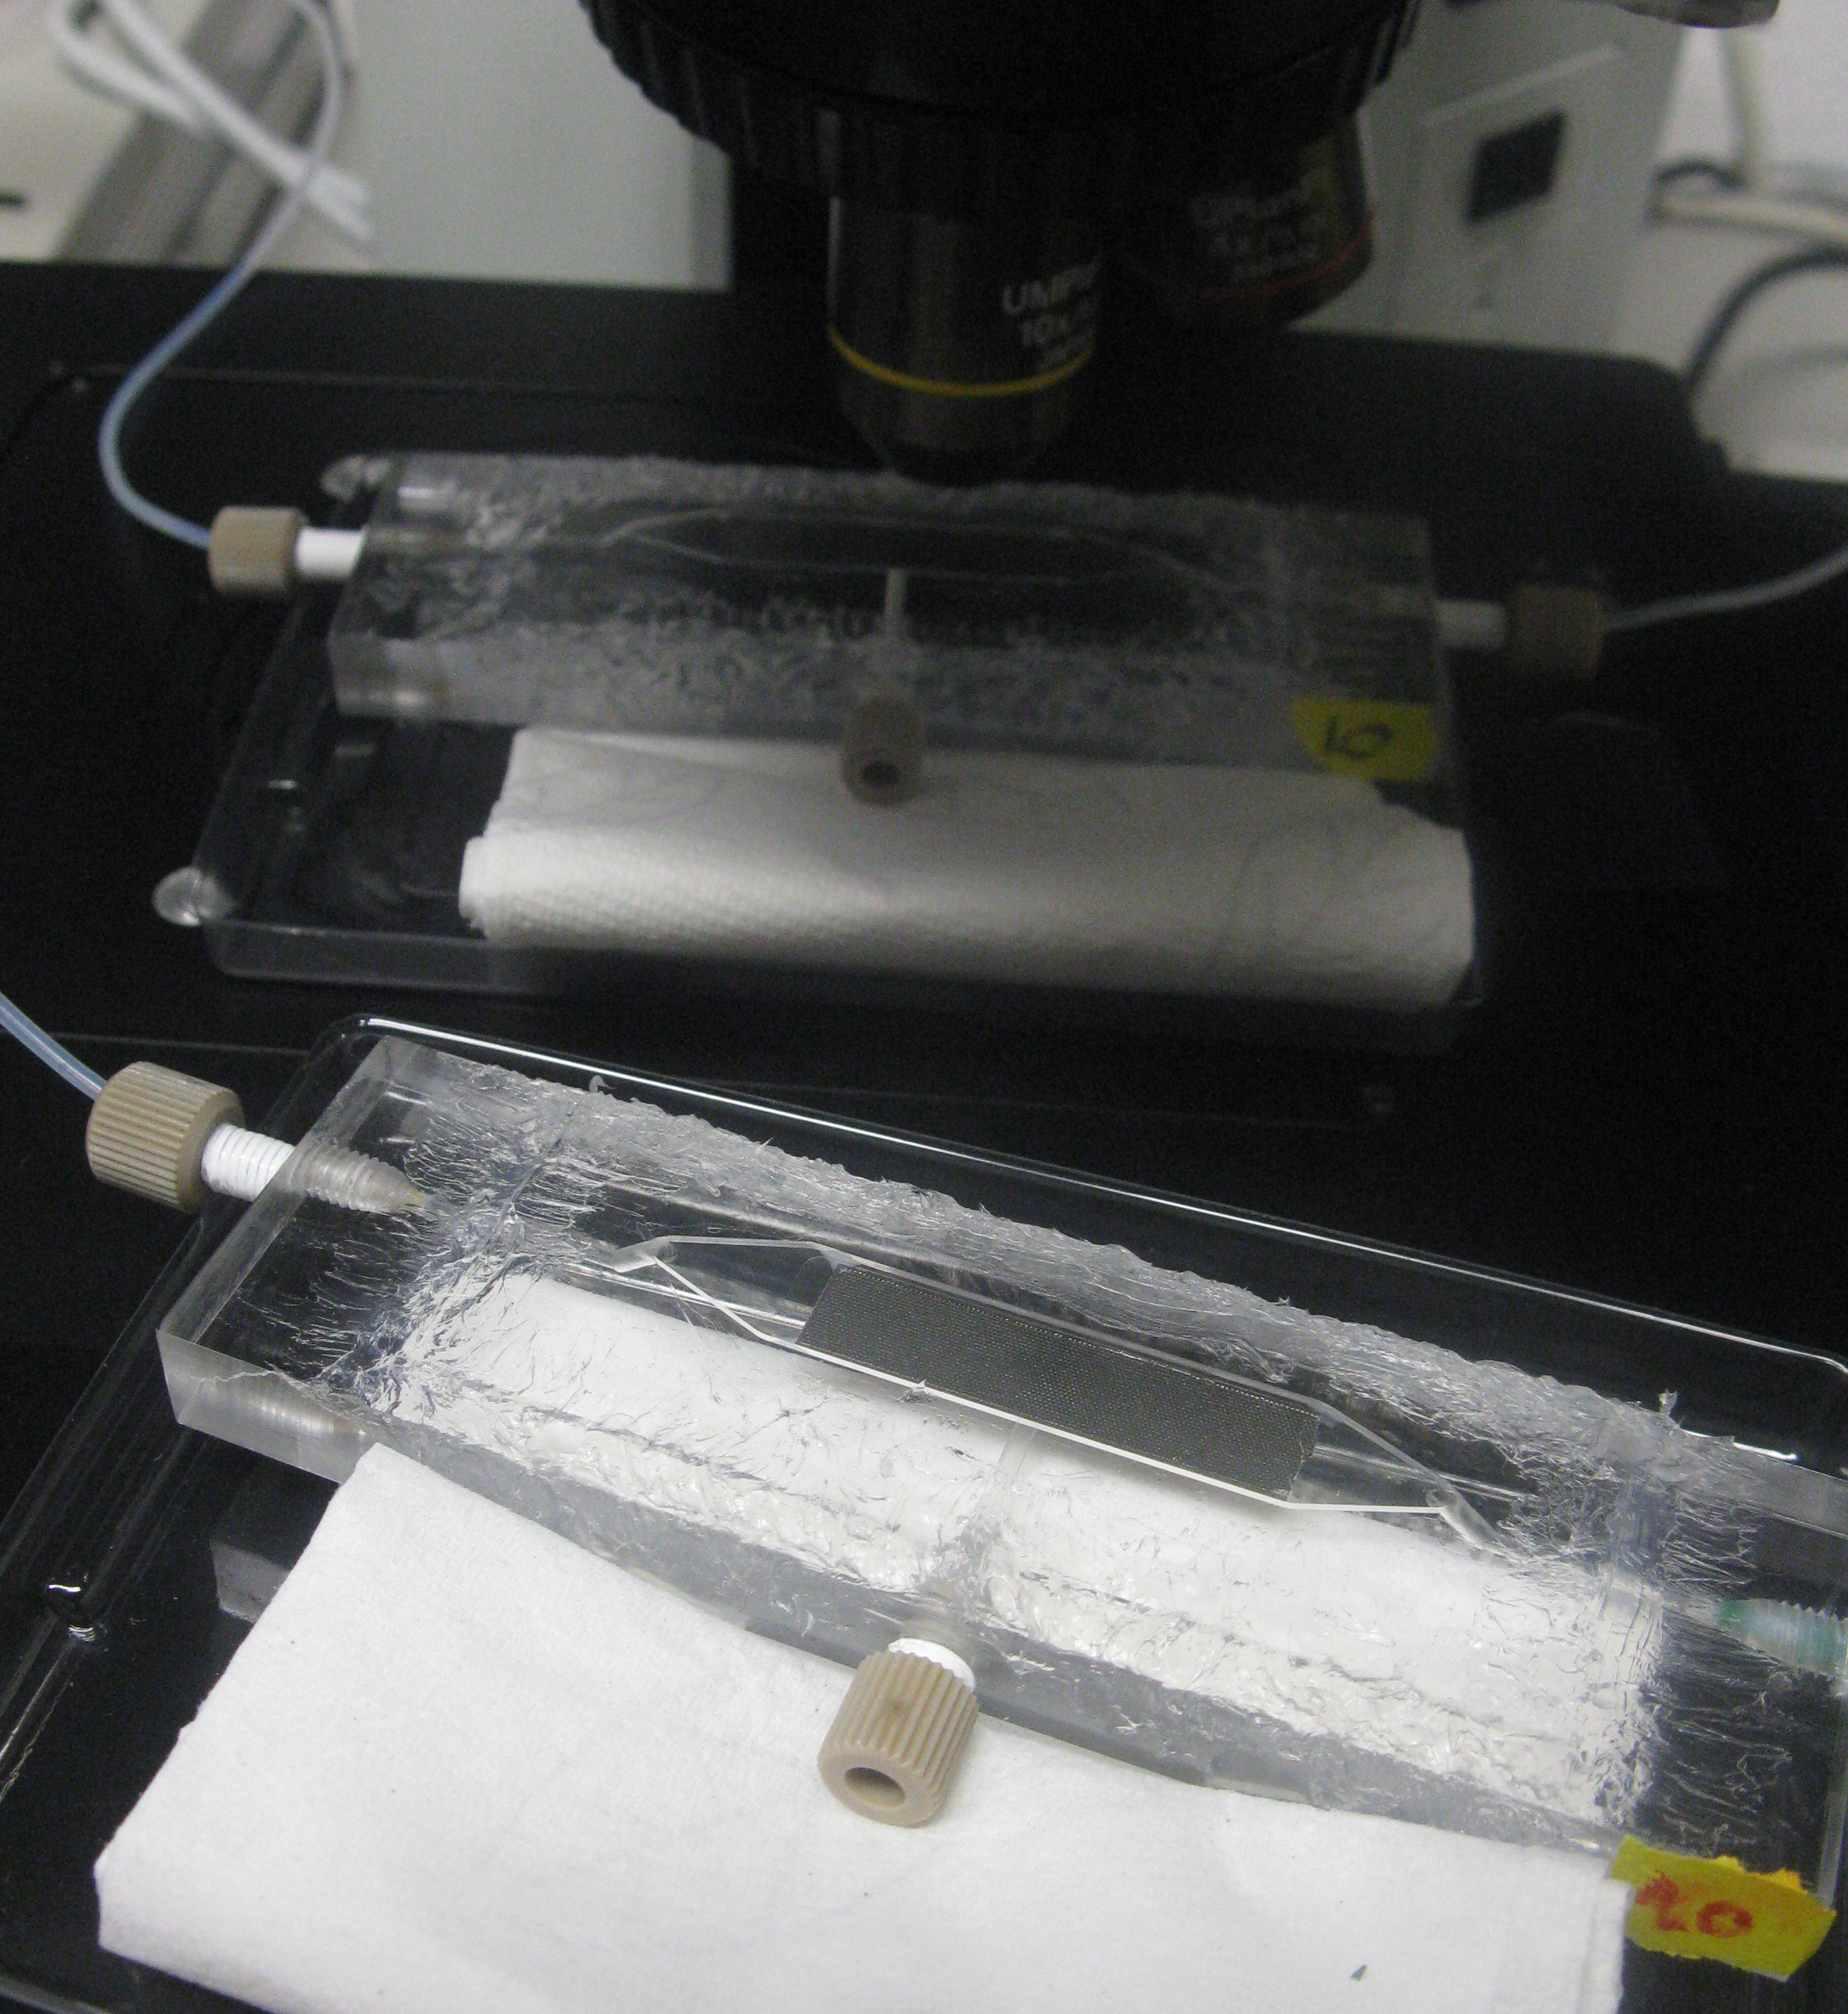
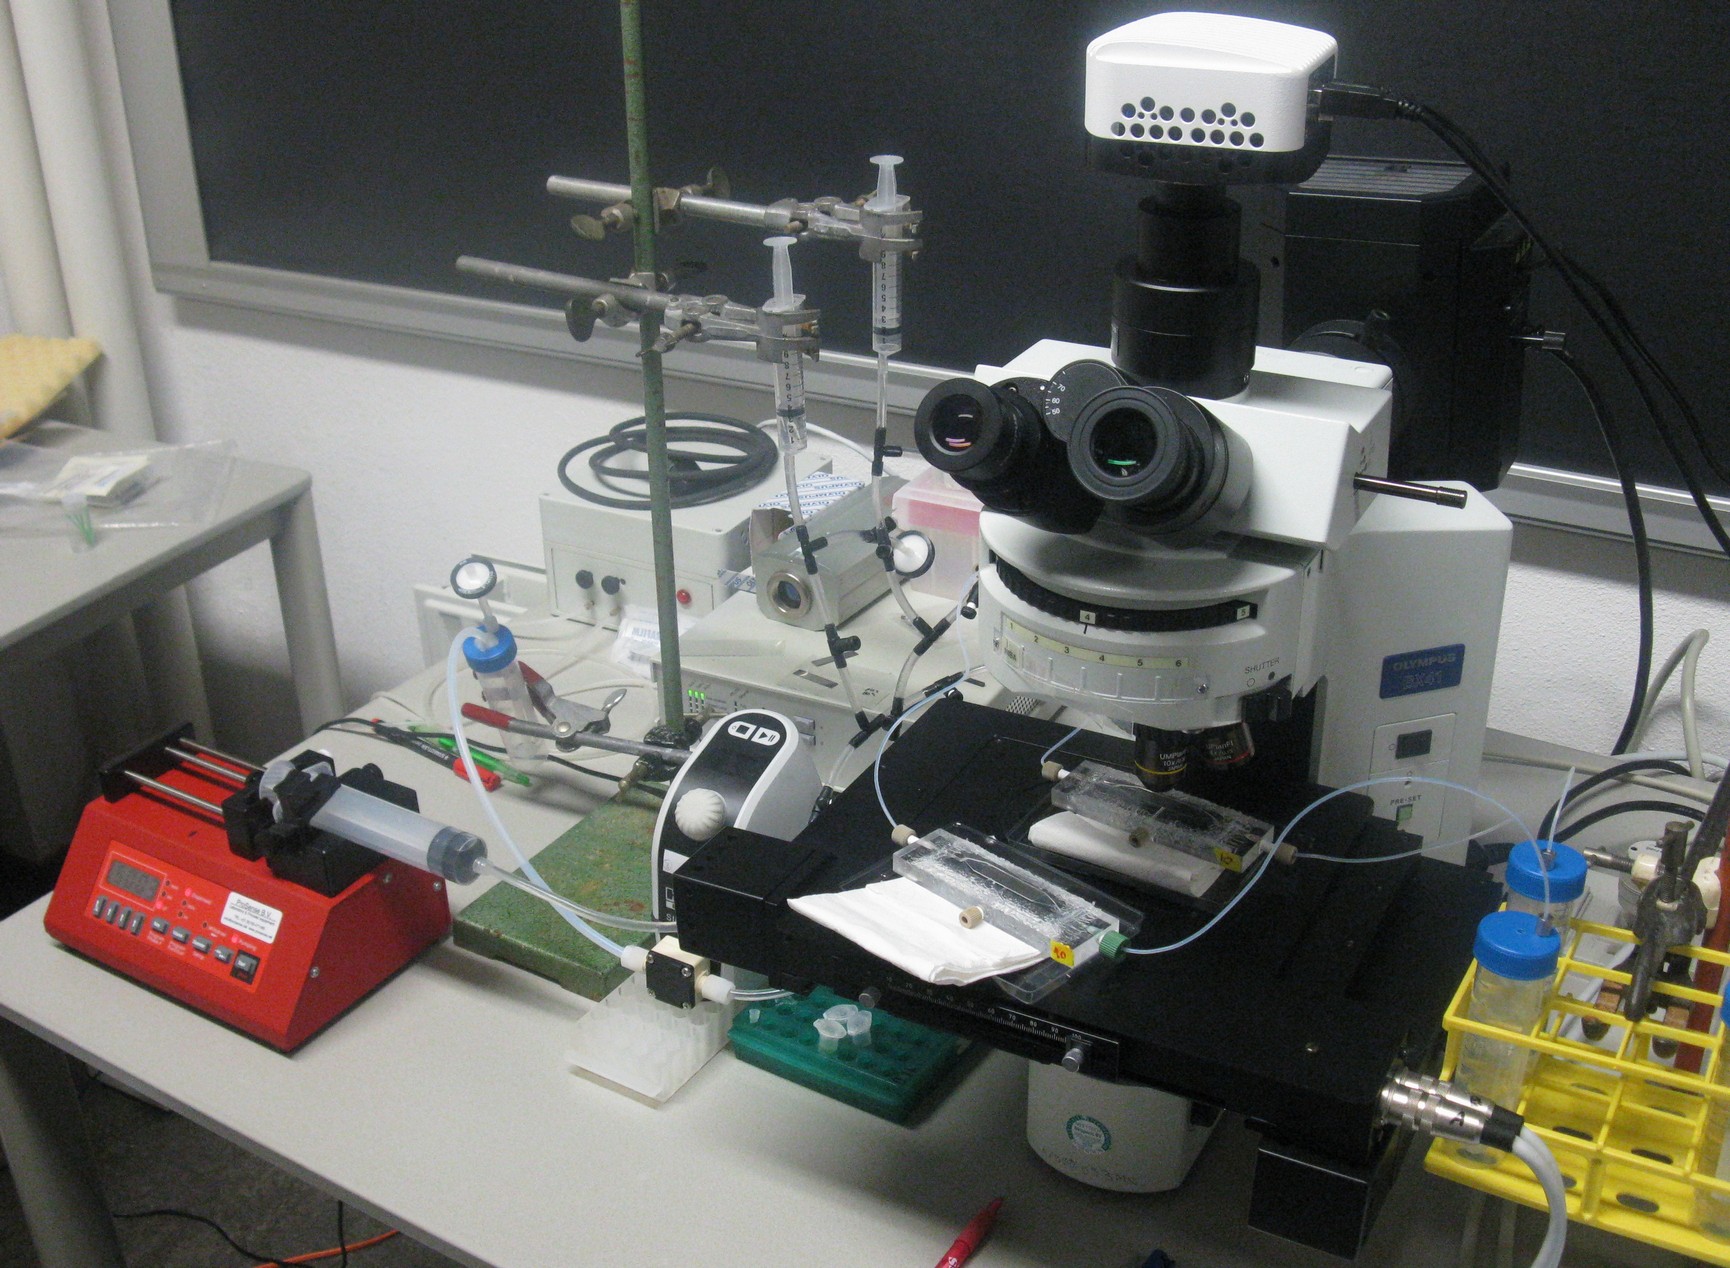
As already mentioned in the design section of the device, the chamber was constructed in such a way that it was possible to place it under a fluorescence microscope for measuring GFP.
Top: Devices under the microscope
Right: Entire setup of the system around the fluorescence microscope
.
 "
"


