Team:Wageningen UR/Project/ModelingProj1
From 2011.igem.org
(→Modeling synchronized oscillations) |
(→Modeling synchronized oscillations) |
||
| Line 71: | Line 71: | ||
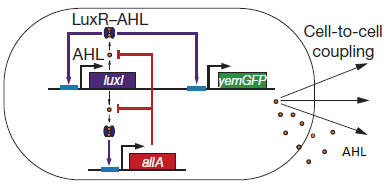
in which tau represents the time step. It can be seen that the function takes the history of the system into account, since the production of the proteins depend on the past concentration of internal AHL as in: [[File:Equations3_hasty_WUR.png]]. | in which tau represents the time step. It can be seen that the function takes the history of the system into account, since the production of the proteins depend on the past concentration of internal AHL as in: [[File:Equations3_hasty_WUR.png]]. | ||
| - | For the first simulations, the same values for the parameters were used as in the cited paper and can be found in the [http://www.nature.com/nature/journal/v463/n7279/suppinfo/nature08753.html supplementary information]. To get graphs representing optimal oscillations, the flow rate and cell density can be varied over a range of values. | + | For the first simulations, the same values for the parameters were used as in the cited paper and can be found in the [http://www.nature.com/nature/journal/v463/n7279/suppinfo/nature08753.html supplementary information]. To get graphs representing optimal oscillations, the flow rate and cell density can be varied over a range of values. The first observation from the model was that the flow rate necessary to obtain oscillations has to be very slow. |
}} | }} | ||
Revision as of 22:34, 11 September 2011
 "
"


