Team:UNIPV-Pavia/Project/Motivation2

From 2011.igem.org

(Difference between revisions)
Line 115: Line 115:
</ul></ol>
</ul></ol>
</p>
</p>
 +
 +
<p align='justify'>
 +
The estimated parameters for the Hill functions of pLux are summarized in the table below. For more details on parameter estimation, see the <a href='https://2011.igem.org/Team:UNIPV-Pavia/Project/Modelling#Ptet_&_Plux'>model section</a>.
 +
</p>
 +
 +
<table class='data' width='100%'>
 +
<tr>
 +
<td class="row"><b>RBS</b></td>
 +
<td class="row"><b>&alpha;<sub>p<sub>Lux</sub></sub> [(AUr/min)/cell]</b></td>
 +
<td class="row"><b>&delta;<sub>p<sub>Lux</sub></sub> [-]</b></td>
 +
<td class="row"><b>&eta;<sub>p<sub>Lux</sub></sub> [-]</b></td>
 +
<td class="row"><b>k<sub>p<sub>Lux</sub></sub> [ng/ml]</b></td>
 +
</tr>
 +
<tr><td class="row">BBa_B0030</td>
 +
<td class="row">438 [10]</td>
 +
<td class="row">0.05 [>100]</td>
 +
<td class="row">2 [47]</td>
 +
<td class="row">1.88 [27]</td>
 +
</tr>
 +
<tr><td class="row">BBa_B0031</td>
 +
<td class="row">9.8 [7]</td>
 +
<td class="row">0.11 [57]</td>
 +
<td class="row">1.2 [29]</td>
 +
<td class="row">1.5 [26]</td>
 +
</tr>
 +
<tr><td class="row">BBa_B0032</td>
 +
<td class="row">206 [3]</td>
 +
<td class="row">0 [>>100]</td>
 +
<td class="row">1.36 [10]</td>
 +
<td class="row">1.87 [9]</td>
 +
</tr>
 +
<tr><td class="row">BBa_B0034</td>
 +
<td class="row">1105 [6]</td>
 +
<td class="row">0.02 [>100]</td>
 +
<td class="row">1.33 [19]</td>
 +
<td class="row">2.34 [18]</td>
 +
</tr>
 +
</table>
 +
<div align="center">Data are provided as average [CV%].</div><br>
 +
 +
<p>The operative parameters are summarized in the table below:</p></div>
 +
 +
<table align='center' class='data' width='100%'>
 +
<tr>
 +
<td class='row'><b>RBS</b></td>
 +
<td class='row'><b>RPU<sub>max</sub></b></td>
 +
<td class='row'><b>RPU<sub>min</sub></b></td>
 +
<td class='row'><b>Switch point [nM]</b></td>
 +
<td class='row'><b>Linear boundaries [MIN; MAX] [nM]</b></td>
 +
</tr>
 +
<tr>
 +
<td class='row'>B0030</td><td class='row'>4.28</td><td class='row'>0.20</td><td class='row'>1.08</td><td class='row'>[0.36; 3.27]</td>
 +
</tr>
 +
<tr>
 +
<td class='row'>B0031</td><td class='row'>4.93</td><td class='row'>0.55</td><td class='row'>0.25</td><td class='row'>[0.03; 2.30]</td>
 +
</tr>
 +
<tr>
 +
<td class='row'>B0032</td><td class='row'>9.49</td><td class='row'>0.02</td><td class='row'>0.47</td><td class='row'>[0.07; 3.07]</td>
 +
</tr>
 +
<tr>
 +
<td class='row'>B0034</td><td class='row'>21.53</td><td class='row'>0.51</td><td class='row'>0.53</td><td class='row'>[0.08; 3.77]</td>
 +
</tr>
 +
</table>
 +
 +
 +
<table width='100%'><tr><td width='50%'>
 +
<div style="text-align:justify"><div class="thumbinner" width='100%'><a href="https://static.igem.org/mediawiki/2011/5/50/E17_RPU_80.jpg" class="image"><img alt="" src="https://static.igem.org/mediawiki/2011/5/50/E17_RPU_80.jpg" class="thumbimage" width="100%"></a></div></div>
 +
</td>
 +
<td width='50%'>
 +
<div style="text-align:justify"><div class="thumbinner" width='100%'><a href="https://static.igem.org/mediawiki/2011/c/c4/E18_RPU_80.jpg" class="image"><img alt="" src="https://static.igem.org/mediawiki/2011/c/c4/E18_RPU_80.jpg" class="thumbimage" width="100%"></a></div></div>
 +
</td></tr>
 +
<tr><td width='50%'>
 +
<div style="text-align:justify"><div class="thumbinner" width='100%'><a href="https://static.igem.org/mediawiki/2011/7/78/E19_RPU_80.jpg" class="image"><img alt="" src="https://static.igem.org/mediawiki/2011/7/78/E19_RPU_80.jpg" class="thumbimage" width="100%"></a></div></div>
 +
</td>
 +
<td width='50%'>
 +
<div style="text-align:justify"><div class="thumbinner" width='100%'><a href="https://static.igem.org/mediawiki/2011/5/55/E20_RPU_80.jpg" class="image"><img alt="" src="https://static.igem.org/mediawiki/2011/5/55/E20_RPU_80.jpg" class="thumbimage" width="100%"></a></div></div>
 +
</td></tr>
 +
</table>
 +
 +
<p>The protocols for the characterization of p<sub>Tet</sub> promoter are reported in the <a href='https://2011.igem.org/Team:UNIPV-Pavia/Measurements#pTet_protocol'>p<sub>Tet</sub> measurement section</a>.</p>
 +
<p>
 +
Here we have characterized its transcriptional strength as a function of aTc induction (ng/ul) for different RBSs. Three different induction curves were obtained and are reported in figure:</p></div>
 +
 +
<center><a href="https://static.igem.org/mediawiki/2011/a/af/E32_RPU_80.jpg" class="image">
 +
<img alt="" src="https://static.igem.org/mediawiki/2011/a/af/E32_RPU_80.jpg" class="thumbimage" width="50%"></a>
 +
</center>
 +
 +
 +
<table width='100%'>
 +
<tr><td width='50%'>
 +
<div style="text-align:justify"><div class="thumbinner" width='100%'><a href="https://static.igem.org/mediawiki/2011/9/99/E34_RPU_80.jpg" class="image"><img alt="" src="https://static.igem.org/mediawiki/2011/9/99/E34_RPU_80.jpg" class="thumbimage" width="100%"></a></div></div>
 +
</td>
 +
<td width='50%'>
 +
<div style="text-align:justify"><div class="thumbinner" width='100%'><a href="https://static.igem.org/mediawiki/2011/e/e4/E35_RPU_80.jpg" class="image"><img alt="" src="https://static.igem.org/mediawiki/2011/e/e4/E35_RPU_80.jpg" class="thumbimage" width="100%"></a></div></div>
 +
</td></tr>
 +
</table>
 +
 +
 +
<p align='justify'>
 +
The estimated parameters of the Hill curves described in the figures are summarized in the table below:
 +
</p>
 +
<br>
 +
<table class='data' width='100%' title='parameter value'>
 +
<tr>
 +
<td class="row"><b>RBS</b></td>
 +
<td class="row"><b>&alpha;<sub>p<sub>Tet</sub></sub> [(AUr/min)/cell]</b></td>
 +
<td class="row"><b>&delta;<sub>p<sub>Tet</sub></sub> [-]</b></td>
 +
<td class="row"><b>&eta;<sub>p<sub>Tet</sub></sub> [-]</b></td>
 +
<td class="row"><b>k<sub>p<sub>Tet</sub></sub> [nM]</b></td>
 +
</tr>
 +
<tr><td class="row">BBa_B0030</td>
 +
<td class="row">230.67 [3.7]</td>
 +
<td class="row">0.028 [91.61]</td>
 +
<td class="row">4.61 [23.73]</td>
 +
<td class="row">8.75 [4.16]</td>
 +
</tr>
 +
<tr><td class="row">BBa_B0031</td>
 +
<td class="row">ND</td>
 +
<td class="row">ND</td>
 +
<td class="row">ND</td>
 +
<td class="row">ND</td>
 +
</tr>
 +
<tr><td class="row">BBa_B0032</td>
 +
<td class="row">55.77 [12]</td>
 +
<td class="row">1.53E-11 [>>100]</td>
 +
<td class="row">4.98 [57.62]</td>
 +
<td class="row">7.26 [14.98]</td>
 +
</tr>
 +
<tr><td class="row">BBa_B0034</td>
 +
<td class="row">120 [5.95]</td>
 +
<td class="row">0.085 [40.6]</td>
 +
<td class="row">24.85 [47.6]</td>
 +
<td class="row">9 [5.43]</td>
 +
</tr>
 +
</table>
 +
Data are provided as average [CV%]
 +
<br><br>
 +
 +
 +
<p align='justify'>
 +
The operative parameters are summarized in the table below:
 +
</p>
 +
 +
<table align='center' class='data' width='100%'>
 +
<tr>
 +
<td class='row'><b>RBS</b></td>
 +
<td class='row'><b>RPU<sub>max</sub></b></td>
 +
<td class='row'><b>RPU<sub>min</sub></b></td>
 +
<td class='row'><b>Switch point [ng/ml]</b></td>
 +
<td class='row'><b>Linear boundaries [MIN; MAX] [ng/ml]</b></td>
 +
</tr>
 +
<tr>
 +
<td class='row'>B0030</td><td class='row'>1.53</td><td class='row'>~0</td><td class='row'>7.95</td><td class='row'>[4.66;11.99]</td>
 +
</tr>
 +
<tr>
 +
<td class='row'>B0031</td><td class='row'>ND</td><td class='row'>ND</td><td class='row'>ND</td><td class='row'>ND</td>
 +
</tr>
 +
<tr>
 +
<td class='row'>B0032</td><td class='row'>3.16</td><td class='row'>~0</td><td class='row'>6.7</td><td class='row'>[4.45;10.05]</td>
 +
</tr>
 +
<tr>
 +
<td class='row'>B0034</td><td class='row'>2.73</td><td class='row'>0.23</td><td class='row'>8.96</td><td class='row'>[8.27;9.71]</td>
 +
</tr>
 +
</table>

Revision as of 19:38, 21 September 2011

UNIPV TEAM 2011

Results


Contents

NB: unless differently specified, all tests were performed in E. coli MGZ1 in M9 supplemented medium at 37°C. For the cloning of the parts, E. coli TOP10 was used.

Parts assembly

All the parts have been cloned with success. The part name, plasmids and quality controls are reported in the Freezer section.

Characterization of basic modules

Characterization of promoters pTet and pLux

Inducible and constitutive promoters were assembled upstream of different coding sequences containing an RBS from the Community collection.

The assembled RBSs are:


BioBrick code Declared efficiency
BBa_B0030 0,6
BBa_B0031 0,07
BBa_B0032 0,3
BBa_B0034 1

For an inducible device, the RBS variation has the purpose to stretch the induction curve, thus modulating its PoPs-OUT range.

The complex RBS-promoter acts as a whole regulatory element and determines the amount of translated protein. RBSs have been reported to have an un-modular behavior, since the translational efficiency is not independent on the coding sequences, but variates as an effect of different mRNA structure stability [Salis et al., Nat Biotec, 2009]. It is not possible to separate the effects of the sole promoter and of the sole RBS on the total amount/activity of gene product (in this case study, mRFP).

For this reason, every combination 'Promoter+RBS' was studied as a different regulatory element. Regulatory elements were characterized using mRFP reporter protein for different RBSs in terms of Synthesis rate per Cell (Scell) and R.P.U.s (Relative Promoter Units) as explained in measurements section.

Operative parameters of the promoter are derived from the estimated Hill equations obtained by nonlinear least squares fitting (lsqnonlin Matlab routine) of the Hill function expressed in RPUs:

    • RPUmax is equal to the α and represents the maximum promoter activity

    • RPUmin is equal to the α * δ represents the minimum promoter activity

    • Switch point is computed as the abscissa of the inflection point of the Hill curve and it is representative of the position of linear region

    • Linearity boundaries are determined as the intersection between the tangent line to the inflection point and the upper and lower horizontal boundaries of the Hill curve.

The estimated parameters for the Hill functions of pLux are summarized in the table below. For more details on parameter estimation, see the model section.

RBS αpLux [(AUr/min)/cell] δpLux [-] ηpLux [-] kpLux [ng/ml]
BBa_B0030 438 [10] 0.05 [>100] 2 [47] 1.88 [27]
BBa_B0031 9.8 [7] 0.11 [57] 1.2 [29] 1.5 [26]
BBa_B0032 206 [3] 0 [>>100] 1.36 [10] 1.87 [9]
BBa_B0034 1105 [6] 0.02 [>100] 1.33 [19] 2.34 [18]
Data are provided as average [CV%].

The operative parameters are summarized in the table below:

RBS RPUmax RPUmin Switch point [nM] Linear boundaries [MIN; MAX] [nM]
B00304.280.201.08[0.36; 3.27]
B00314.930.550.25[0.03; 2.30]
B00329.490.020.47[0.07; 3.07]
B003421.530.510.53[0.08; 3.77]

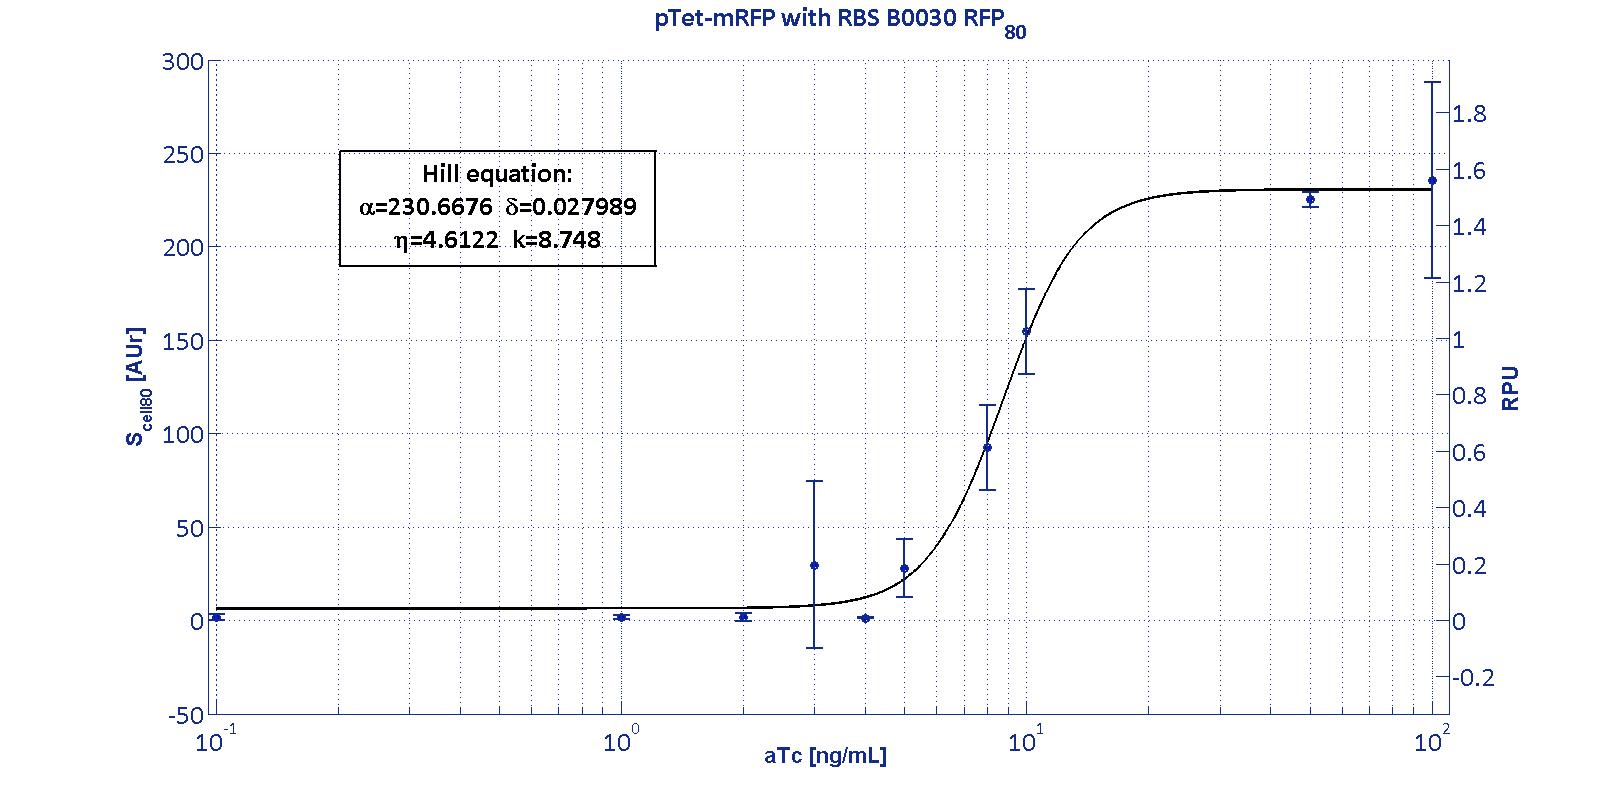
The protocols for the characterization of pTet promoter are reported in the pTet measurement section.

Here we have characterized its transcriptional strength as a function of aTc induction (ng/ul) for different RBSs. Three different induction curves were obtained and are reported in figure:

The estimated parameters of the Hill curves described in the figures are summarized in the table below:


RBS αpTet [(AUr/min)/cell] δpTet [-] ηpTet [-] kpTet [nM]
BBa_B0030 230.67 [3.7] 0.028 [91.61] 4.61 [23.73] 8.75 [4.16]
BBa_B0031 ND ND ND ND
BBa_B0032 55.77 [12] 1.53E-11 [>>100] 4.98 [57.62] 7.26 [14.98]
BBa_B0034 120 [5.95] 0.085 [40.6] 24.85 [47.6] 9 [5.43]
Data are provided as average [CV%]

The operative parameters are summarized in the table below:

RBS RPUmax RPUmin Switch point [ng/ml] Linear boundaries [MIN; MAX] [ng/ml]
B00301.53~07.95[4.66;11.99]
B0031NDNDNDND
B00323.16~06.7[4.45;10.05]
B00342.730.238.96[8.27;9.71]

Retrieved from "http://2011.igem.org/Team:UNIPV-Pavia/Project/Motivation2"