Team:Imperial College London/Project/Auxin/Results
From 2011.igem.org
| Line 2: | Line 2: | ||
{{:Team:Imperial_College_London/Templates/Menu}} | {{:Team:Imperial_College_London/Templates/Menu}} | ||
<html> | <html> | ||
| + | <body> | ||
<h1>Auxin Results</h1> | <h1>Auxin Results</h1> | ||
<h2>Chapter 1: Assembly of genetic constructs</h2> | <h2>Chapter 1: Assembly of genetic constructs</h2> | ||
| - | We wish to build a single expression plasmid that can express IaaH and IaaM. While this task can be summarised in one sentence its execution is not as short. The first problem lies in the size of these two enzymes which both exceed 1kbp making their synthesis a problem. We therefore created a new standard for biobrick assembly to tackle this issue. We broke up these large sequences into four fragments that were ordered at the end of week 3. In preparation for the arrival of these fragments (circa 8-10 days) we started to transform our cells with the pVEg+pSB1C3 backbone constructs in order to make enough genetic material for a gibson assembly reaction. This chapter will describe our struggles and successes throughout this grueling and yet rewarding process. | + | <p>We wish to build a single expression plasmid that can express IaaH and IaaM. While this task can be summarised in one sentence its execution is not as short. The first problem lies in the size of these two enzymes which both exceed 1kbp making their synthesis a problem. We therefore created a new standard for biobrick assembly to tackle this issue. We broke up these large sequences into four fragments that were ordered at the end of week 3. In preparation for the arrival of these fragments (circa 8-10 days) we started to transform our cells with the pVEg+pSB1C3 backbone constructs in order to make enough genetic material for a gibson assembly reaction. This chapter will describe our struggles and successes throughout this grueling and yet rewarding process.</p> |
<h2>29th of July</h2> | <h2>29th of July</h2> | ||
| - | Our first transformations were a success! We have managed to transform our competent cell colonies with pSB1C3 containing BBa_K398500 and J23100 promoter to produce cell line 6. We also transformed the cells with part BBa_K316001 to produce cell line 7 and part BBa_K316005 to produce cell line 8. With these cell lines we will be able to make more copies of each part in preparation for the arrival of our synthesized sequences. We are under a tight schedule so efficiency is key.< | + | <p>Our first transformations were a success! We have managed to transform our competent cell colonies with pSB1C3 containing BBa_K398500 and J23100 promoter to produce cell line 6. We also transformed the cells with part BBa_K316001 to produce cell line 7 and part BBa_K316005 to produce cell line 8. With these cell lines we will be able to make more copies of each part in preparation for the arrival of our synthesized sequences. We are under a tight schedule so efficiency is key.</p> |
</html> | </html> | ||
[[File:ICL_Transformation_6.jpg|300px]] | [[File:ICL_Transformation_6.jpg|300px]] | ||
| Line 12: | Line 13: | ||
[[File:ICL_Transformation_8.jpg|300px]] | [[File:ICL_Transformation_8.jpg|300px]] | ||
<html> | <html> | ||
| - | < | + | <p>Also, the cell line with the superfolded GFP integrated in its genome has been plated successfully. We have confirmed that these are the correct cell lines by looking at them under UV light. Their green glow was brighter than we expected.</p> |
| - | However, cell line 1 did not grow in the liquid broth media at the same concentration of kanamycin. We will create an assay to ascertain the optimum kanamycin concentration. This is both a bizarre and unexpected result that must be rectified. | + | <p>However, cell line 1 did not grow in the liquid broth media at the same concentration of kanamycin. We will create an assay to ascertain the optimum kanamycin concentration. This is both a bizarre and unexpected result that must be rectified.</p> |
<h2>30th of July</h2> | <h2>30th of July</h2> | ||
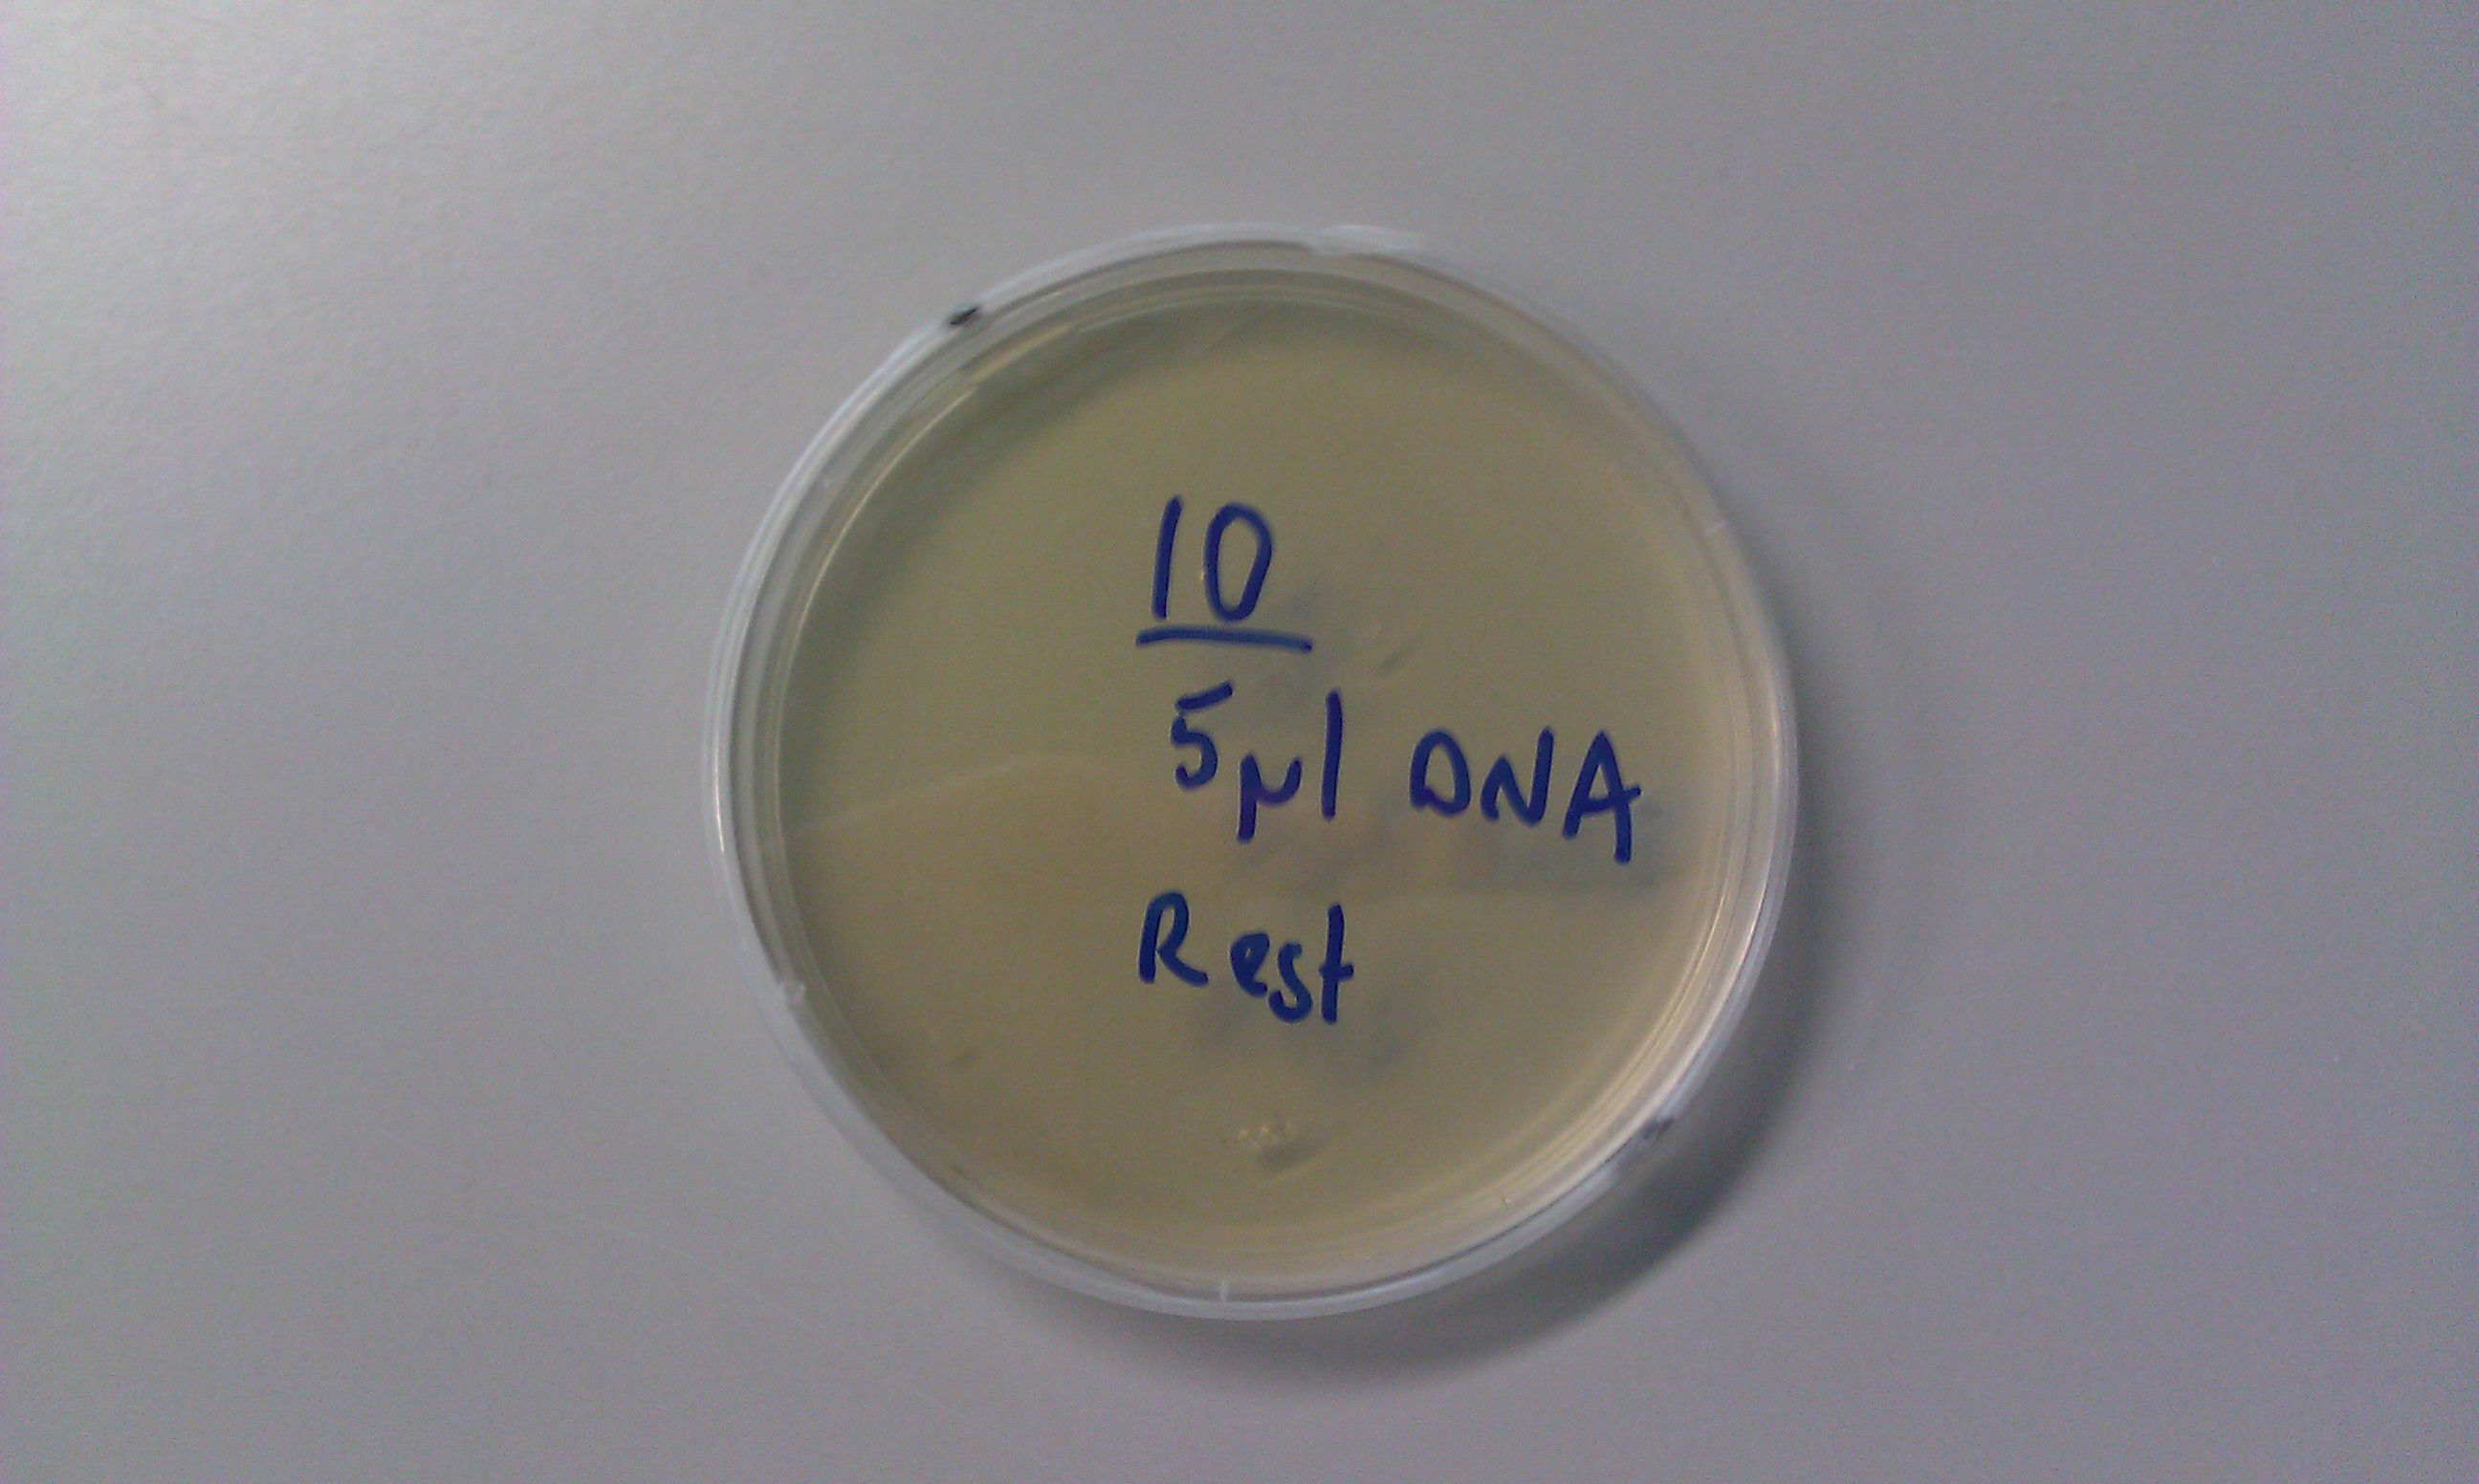
| - | The previous day, we had obtained the mcpS gene in a pRK415 plasmid from Spain. We then performed a transformation on the competent 5α cell line and obtained the results on this day. Out of the four plates one of them contained transformed cells. We named these cells 10.< | + | <p>The previous day, we had obtained the mcpS gene in a pRK415 plasmid from Spain. We then performed a transformation on the competent 5α cell line and obtained the results on this day. Out of the four plates one of them contained transformed cells. We named these cells 10.</p> |
</html> | </html> | ||
[[File:ICL Transformation 10.jpg|400px|center]] | [[File:ICL Transformation 10.jpg|400px|center]] | ||
<html> | <html> | ||
| - | + | <h2>1st of August</h2> | |
| - | A month has already passed since we started our project. The experiments that were conducted on this day were a mini-prep on samples 6,7,8 and 10 that were inoculated into an LB broth culture the night before. We used a mini-prep kit to obtain the plasmid DNA that we wanted from the transformed cells. Then, once we obtained the DNA, we started a restriction digest using PstI and EcoRI for 1.5 hours to confirm that the samples from the mini-prep contained the DNA that we wanted (the pSB1C3 backbone with the appropriate promoters).< | + | <p>A month has already passed since we started our project. The experiments that were conducted on this day were a mini-prep on samples 6,7,8 and 10 that were inoculated into an LB broth culture the night before. We used a mini-prep kit to obtain the plasmid DNA that we wanted from the transformed cells. Then, once we obtained the DNA, we started a restriction digest using PstI and EcoRI for 1.5 hours to confirm that the samples from the mini-prep contained the DNA that we wanted (the pSB1C3 backbone with the appropriate promoters).</p> |
| - | Sadly, once we tried to visualize the results on a gel, the results were less than satisfactory. Mini-prep 6a and 7b seems to have failed and the rest of the bands do not make much sense. The experiment had to be repeated. | + | <p>Sadly, once we tried to visualize the results on a gel, the results were less than satisfactory. Mini-prep 6a and 7b seems to have failed and the rest of the bands do not make much sense. The experiment had to be repeated.</p> |
<h2>2nd of August</h2> | <h2>2nd of August</h2> | ||
| - | Today we attempted the restriction digest again and the results verified that samples 6,7 and 8 were actually pSB1C3 constructs with the required components. Therefore, the mini-prep experiment had worked and did not need to be repeated. It is a great feeling when everything comes together. | + | <p>Today we attempted the restriction digest again and the results verified that samples 6,7 and 8 were actually pSB1C3 constructs with the required components. Therefore, the mini-prep experiment had worked and did not need to be repeated. It is a great feeling when everything comes together.</p> |
</html> | </html> | ||
[[File:ICL_restriction.digest.backbone.vectors.jpg|500px|]] | [[File:ICL_restriction.digest.backbone.vectors.jpg|500px|]] | ||
[[File:ICL_restriction.digest.backbone.vectors.2.jpg|400px|]]<html><br> | [[File:ICL_restriction.digest.backbone.vectors.2.jpg|400px|]]<html><br> | ||
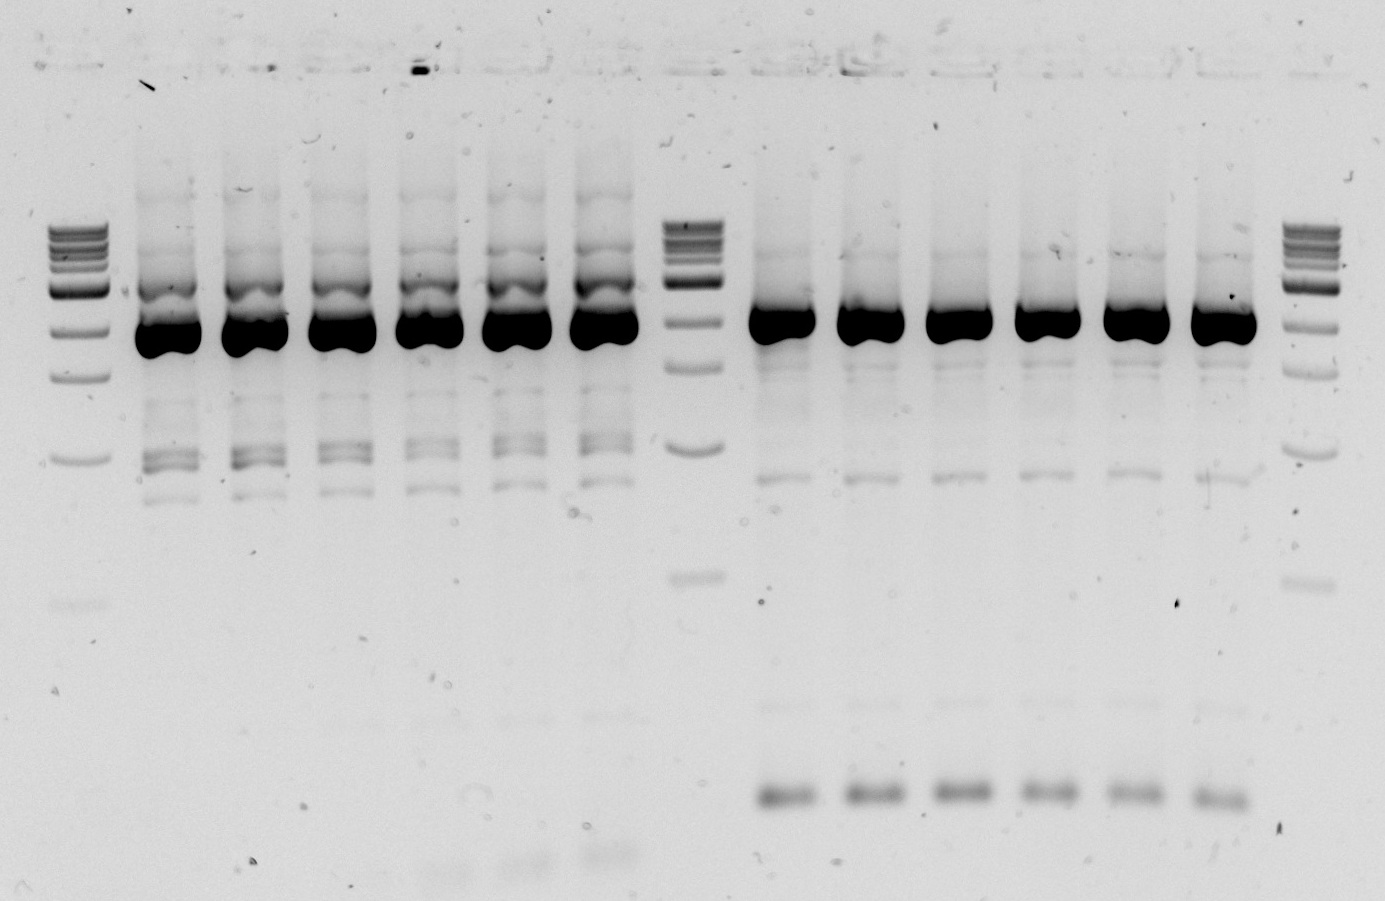
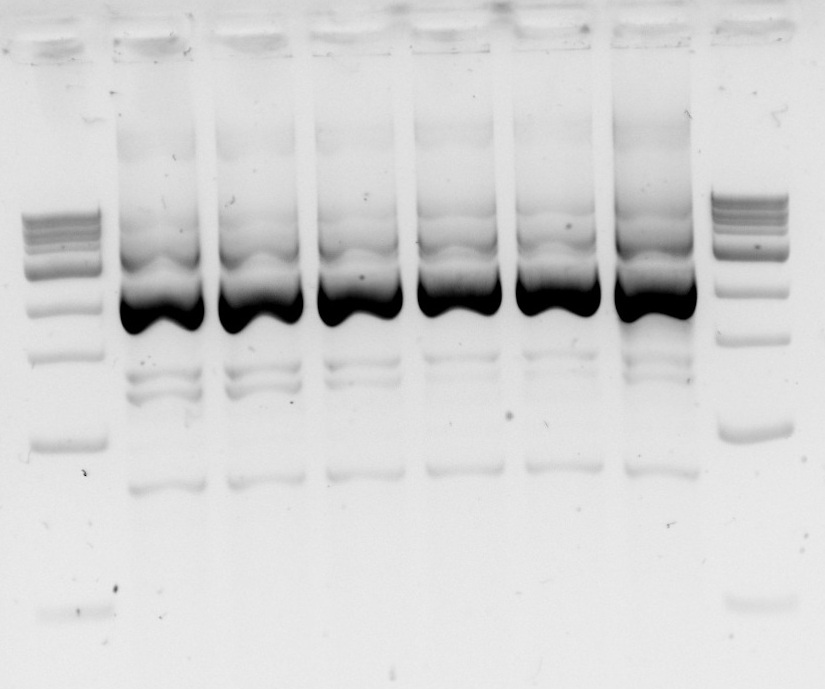
| - | <p>Gel 1&2. Restriction digest of three backbone vectors with EcoRI(E) and PstI(P) to confirm backbone length. Gel1: Lane1-1 kb DNA ladder Lane 2-6a cut with E;Lane 3-6a cut with P; Lane 4-6a cut with E+P;Lane 6-6b cut with E; Lane 7- 6b cut with P; Lane 8- 6b cut with E+P; Lane 11- 7a cut with E; Lane 12- 7a cut with P; Lane 13- 7a cut with E+P; Lane 15- 7b cut with E; Lane 16- 7b cut with P; Lane 17- 7b cut with E+P. Gel 2: Lane 1 - 1kb ladder; lane 2 - 8a cut with E; lane 3- 8a cut with P; lane 4- 8a cut with E+P; lane 6- 8b cut with E; lane 7- 8b cut with P; lane 8 - 8b cut with E+P. </p> | + | <p>Gel 1&2. Restriction digest of three backbone vectors with EcoRI(E) and PstI(P) to confirm backbone length. Gel1: Lane1-1 kb DNA ladder Lane 2-6a cut with E;Lane 3-6a cut with P; Lane 4-6a cut with E+P;Lane 6-6b cut with E; Lane 7- 6b cut with P; Lane 8- 6b cut with E+P; Lane 11- 7a cut with E; Lane 12- 7a cut with P; Lane 13- 7a cut with E+P; Lane 15- 7b cut with E; Lane 16- 7b cut with P; Lane 17- 7b cut with E+P. Gel 2: Lane 1 - 1kb ladder; lane 2 - 8a cut with E; lane 3- 8a cut with P; lane 4- 8a cut with E+P; lane 6- 8b cut with E; lane 7- 8b cut with P; lane 8 - 8b cut with E+P.</p> |
<h2>3rd of August</h2> | <h2>3rd of August</h2> | ||
| - | Today we attempted to PCR samples 6, 7 and 8. The PCR did not end up working so well so. The annealing temperature must have been too low because we obtained bands that we did not want. Also, there must have been too little Sybr safe in the gel because the bands that were there were not bright. The PCR will be repeated once again and we will use a temperature gradient for (hopefully) better results. | + | <p>Today we attempted to PCR samples 6, 7 and 8. The PCR did not end up working so well so. The annealing temperature must have been too low because we obtained bands that we did not want. Also, there must have been too little Sybr safe in the gel because the bands that were there were not bright. The PCR will be repeated once again and we will use a temperature gradient for (hopefully) better results.</p> |
</html> | </html> | ||
<h2>4th of August</h2> | <h2>4th of August</h2> | ||
| - | Today we redid the PCR of samples 6, 7, and 8 but with a temperature gradient to improve primer annealing.... and it was a success! So tomorrow we can run the rest of the Dpn1 digested DNA on a gel and gel purify it, then the vectors are ready to be used for DNA assembly once our genes arrive! | + | <p>Today we redid the PCR of samples 6, 7, and 8 but with a temperature gradient to improve primer annealing.... and it was a success! So tomorrow we can run the rest of the Dpn1 digested DNA on a gel and gel purify it, then the vectors are ready to be used for DNA assembly once our genes arrive!</p> |
[[File:ICL_temp.gradient.PCR.6a.6b.7a.7b.jpg|500px|]] | [[File:ICL_temp.gradient.PCR.6a.6b.7a.7b.jpg|500px|]] | ||
[[File:ICL_PCR.temp.gradient.8a.8b.jpg|400px|]] | [[File:ICL_PCR.temp.gradient.8a.8b.jpg|400px|]] | ||
<p>Gels 3&4: Temperature gradient PCR of desired backbone with promoter and terminator out of plasmids. Gel 3:Lane 1- 1kb DNA ladder; lanes 2 to 7 - PCR of vector 6 from 57.1°C to 62.6°C; lanes 9 to 15 - PCR of vector 7 from 57.1°C to 62.6°C. Gel 4: lanes 2 to 7 - PCR of vector 8 from 57.1°C to 62.6°C</p> | <p>Gels 3&4: Temperature gradient PCR of desired backbone with promoter and terminator out of plasmids. Gel 3:Lane 1- 1kb DNA ladder; lanes 2 to 7 - PCR of vector 6 from 57.1°C to 62.6°C; lanes 9 to 15 - PCR of vector 7 from 57.1°C to 62.6°C. Gel 4: lanes 2 to 7 - PCR of vector 8 from 57.1°C to 62.6°C</p> | ||
| - | <html>< | + | <html> |
| - | The backbone sequences have also returned. All of the samples are in order except a one base pair mutation in sample 8 within the pVEg promoter. For now, we are going to amplify it anyways in the hope that the one base pair mutation is just an error that occured during sequencing. Either way, sample 8 is a back-up of sample 7 so there should be no problems either way.< | + | <p>The backbone sequences have also returned. All of the samples are in order except a one base pair mutation in sample 8 within the pVEg promoter. For now, we are going to amplify it anyways in the hope that the one base pair mutation is just an error that occured during sequencing. Either way, sample 8 is a back-up of sample 7 so there should be no problems either way.</p> |
| - | We also started experimenting with the Salkowski reagent. In particular, we tested the S2/1 method and found that the ideal wavelength for measuring the IAA concentration with our apparatus is at 554nm. This was done by scanning between 500nm and 600nm to obtain the individual absorption spectra of each sample. The wavelength at which the absorbance peaked was chosen. This experiment gave us a great standard curve from which we can roughly estimate the amount of IAA in a solution between 2 and 200 μg/ml.< | + | <p>We also started experimenting with the Salkowski reagent. In particular, we tested the S2/1 method and found that the ideal wavelength for measuring the IAA concentration with our apparatus is at 554nm. This was done by scanning between 500nm and 600nm to obtain the individual absorption spectra of each sample. The wavelength at which the absorbance peaked was chosen. This experiment gave us a great standard curve from which we can roughly estimate the amount of IAA in a solution between 2 and 200 μg/ml.</p> |
<h2>5th of August</h2> | <h2>5th of August</h2> | ||
| - | After successfully testing the S2/1 method we also attempted the PC method which is both more exact and more specific for IAA. However, it only works at a lower range of concentrations of IAA and will therefore be useless if our bacteria end up excreting more than 20 μg/ml of IAA into the solution. Either way, we now have two standard curves which can be used to measure the amount of IAA in a solution. We are ready for the synthetic genes to arrive! | + | <p>After successfully testing the S2/1 method we also attempted the PC method which is both more exact and more specific for IAA. However, it only works at a lower range of concentrations of IAA and will therefore be useless if our bacteria end up excreting more than 20 μg/ml of IAA into the solution. Either way, we now have two standard curves which can be used to measure the amount of IAA in a solution. We are ready for the synthetic genes to arrive!</p> |
<h2>8th of August</h2> | <h2>8th of August</h2> | ||
| - | Today we ran a gel of the PCRd backbone DNA extracted from the previous gel to make sure that the DNA was pure. The gel results were succesful. We also transformed cells with the pure DNA to check that the Dpn1 digestion worked properly.< | + | <p>Today we ran a gel of the PCRd backbone DNA extracted from the previous gel to make sure that the DNA was pure. The gel results were succesful. We also transformed cells with the pure DNA to check that the Dpn1 digestion worked properly.</p> |
</html>[[File:ICL_PCRgelextraction.jpg|400px]]<html> | </html>[[File:ICL_PCRgelextraction.jpg|400px]]<html> | ||
| Line 49: | Line 50: | ||
<h2>9th of August</h2> | <h2>9th of August</h2> | ||
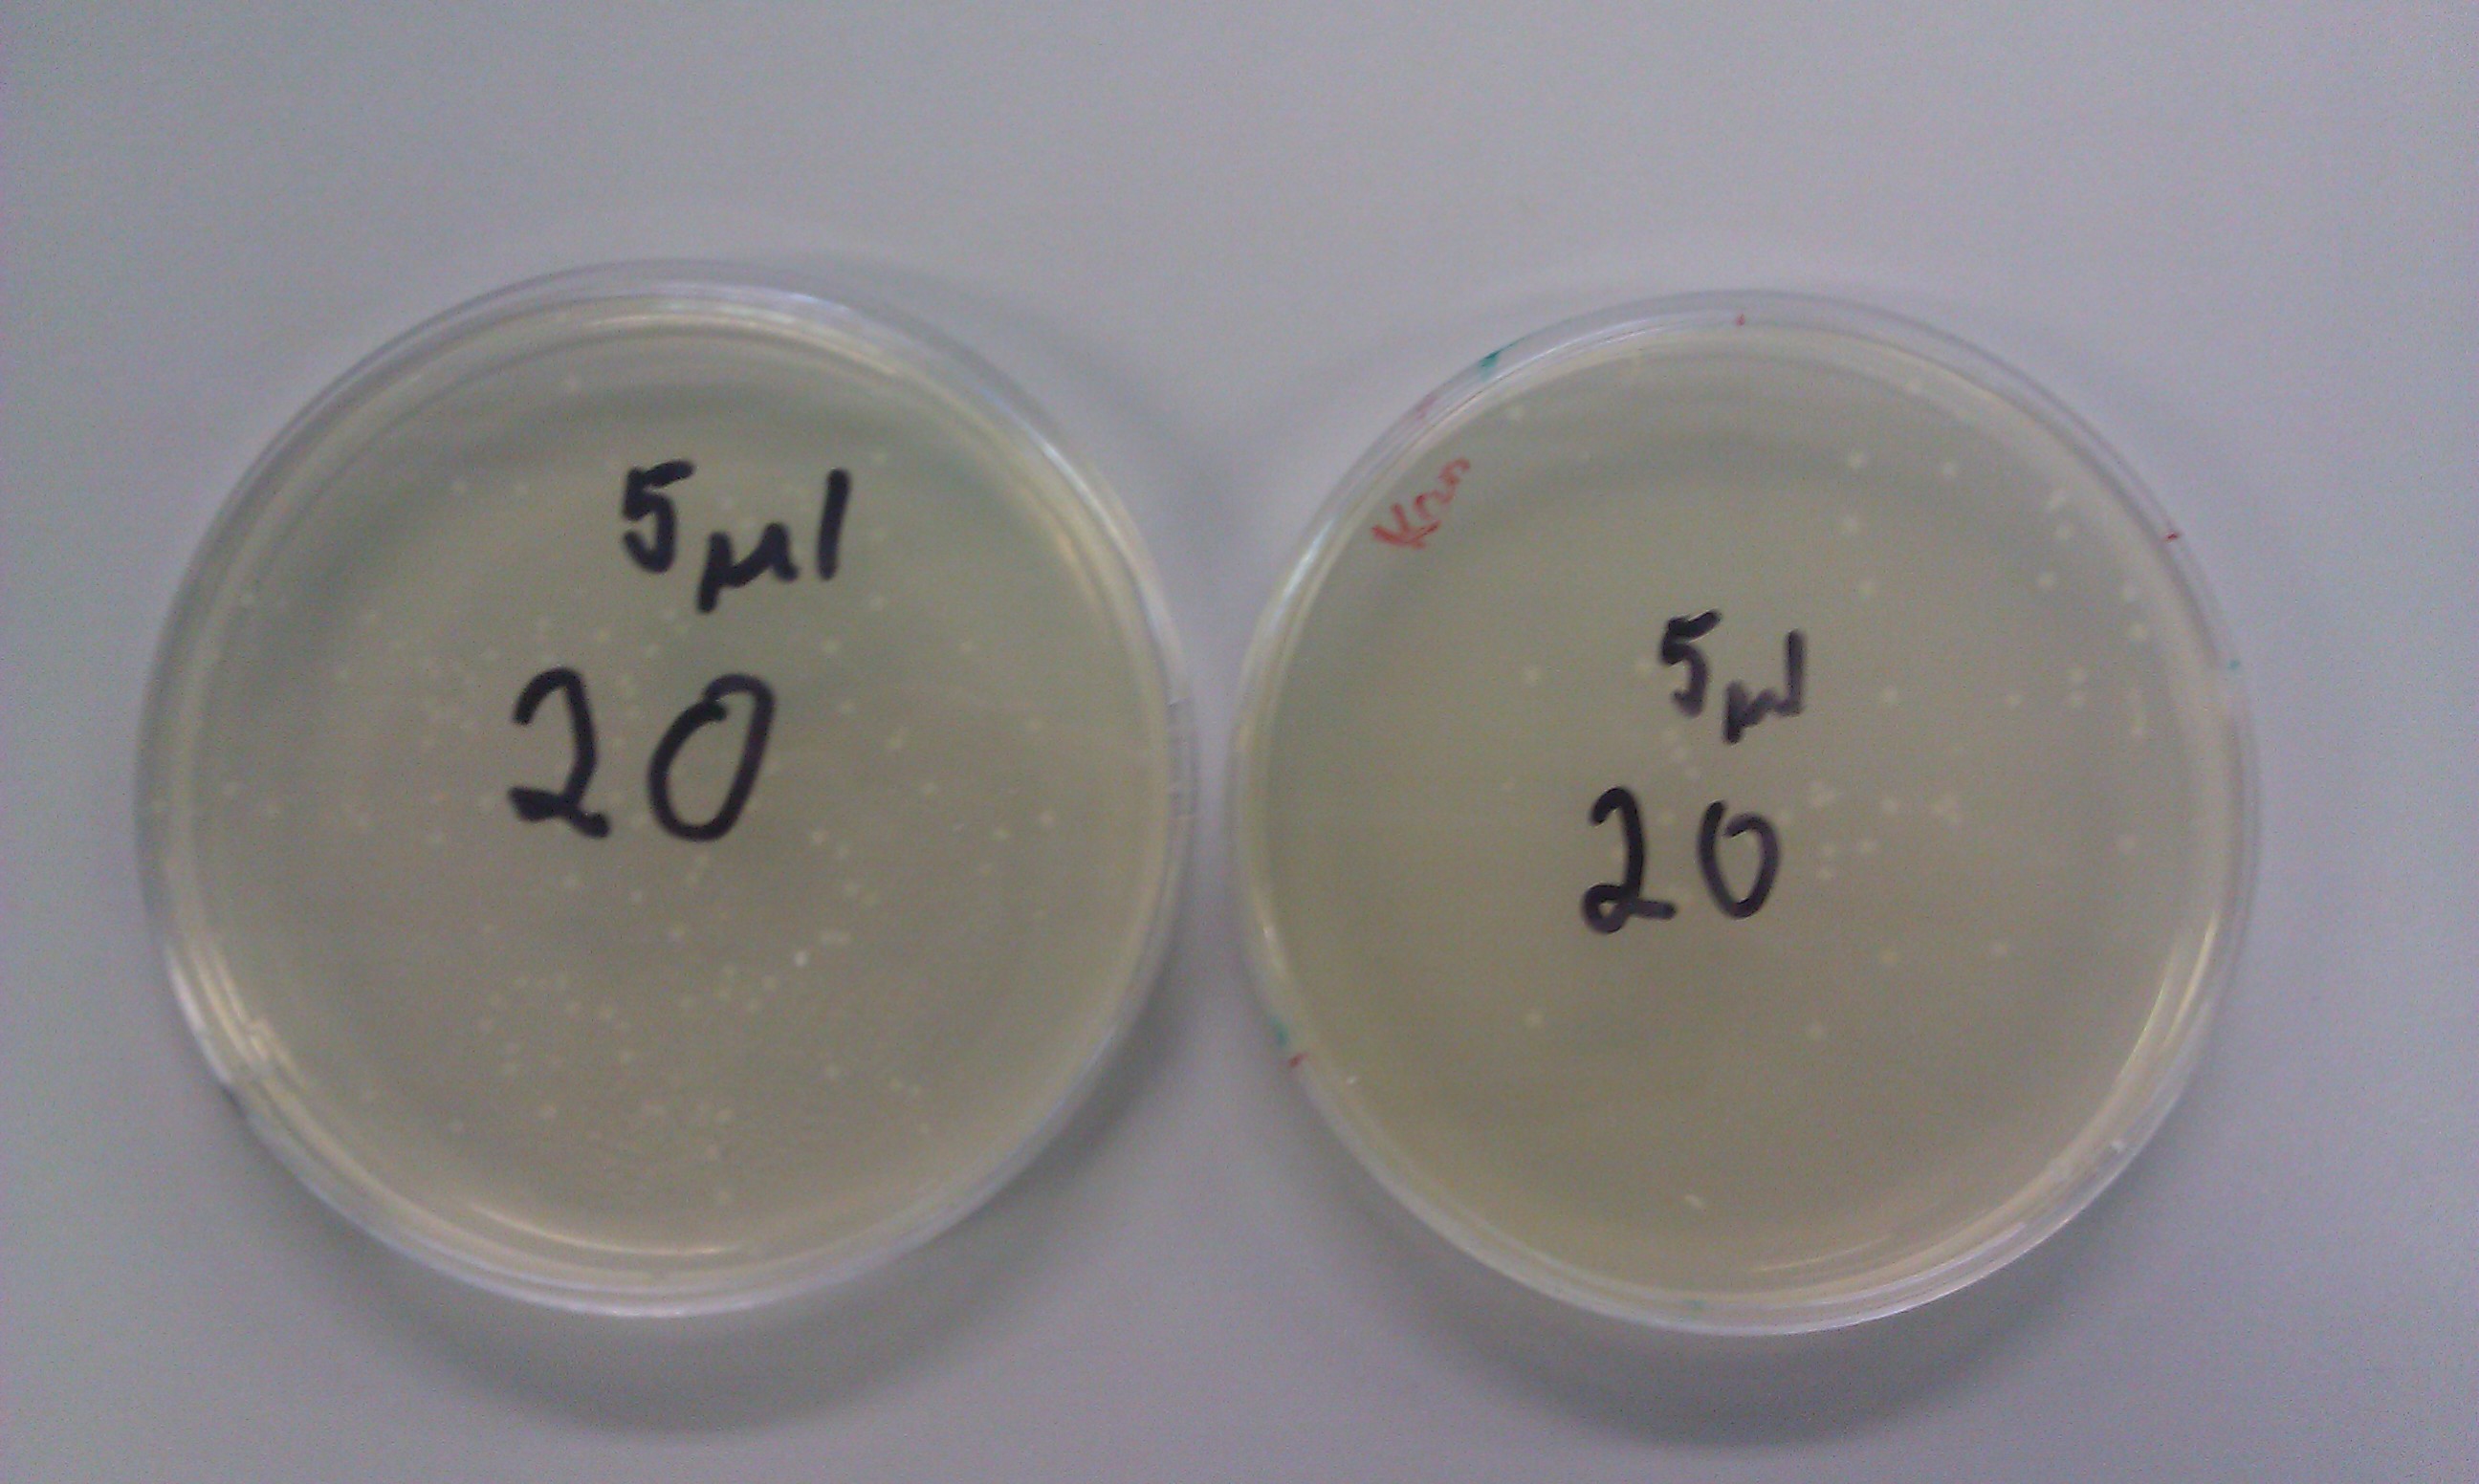
| - | Transformations of auxin fragment 1 (20) and auxin fragment 4 (24) were successful. We obtained plenty of colonies to choose from on both the ampicillin and kanamycin plates. Also, the DpnI digest transformations created bacteria that had no resistance to chloramphenicol.< | + | <p>Transformations of auxin fragment 1 (20) and auxin fragment 4 (24) were successful. We obtained plenty of colonies to choose from on both the ampicillin and kanamycin plates. Also, the DpnI digest transformations created bacteria that had no resistance to chloramphenicol.</p> |
</html>[[File:ICL_Transformation_20.jpg|400px|center]] | </html>[[File:ICL_Transformation_20.jpg|400px|center]] | ||
| Line 60: | Line 61: | ||
</html>[[File:ICL_Transformation_8_DpnI.jpg|400px|center]]<html> | </html>[[File:ICL_Transformation_8_DpnI.jpg|400px|center]]<html> | ||
<h2>Chapter 2: Auxin assays</h2> | <h2>Chapter 2: Auxin assays</h2> | ||
| - | How much auxin will we be producing? More importantly, has the module actually worked?! This chapter will look into the methods that we have decided to use in order to measure the amount of auxin in a solution. We have decided to use qualitative methods such as the Salkowski reagent (changes colour which is always good) as well as quantitative methods such as HPLC and GC-MS for more accurate results. Cross our fingers and hope this works! | + | <p>How much auxin will we be producing? More importantly, has the module actually worked?! This chapter will look into the methods that we have decided to use in order to measure the amount of auxin in a solution. We have decided to use qualitative methods such as the Salkowski reagent (changes colour which is always good) as well as quantitative methods such as HPLC and GC-MS for more accurate results. Cross our fingers and hope this works!</p> |
<h2>5th of August</h2> | <h2>5th of August</h2> | ||
| - | Today we performed the first S2/1 Salkowski assay successfully. The solution did indeed change colour giving an excellent visual result. | + | <p>Today we performed the first S2/1 Salkowski assay successfully. The solution did indeed change colour giving an excellent visual result.</p> |
</html> | </html> | ||
[[File:ICL_S2.1_results_1.PNG|800px|center]]<html> | [[File:ICL_S2.1_results_1.PNG|800px|center]]<html> | ||
<h2>8th of August</h2> | <h2>8th of August</h2> | ||
| - | Today we performed the first PC Salkowski assay successfully. We even took a picture of the gradient:</ | + | <p>Today we performed the first PC Salkowski assay successfully. We even took a picture of the gradient:</p> |
| - | + | ||
[[File:ICL_PC_picture.jpg|400px|center]]<html><br><br> | [[File:ICL_PC_picture.jpg|400px|center]]<html><br><br> | ||
This was one of the 3 repeats that gave us the following standard curve:</html> | This was one of the 3 repeats that gave us the following standard curve:</html> | ||
| Line 77: | Line 77: | ||
<h2>Chapter 3: effect of auxin on plants</h2> | <h2>Chapter 3: effect of auxin on plants</h2> | ||
<h2>Tuesday, 9 August 2011</h2> | <h2>Tuesday, 9 August 2011</h2> | ||
| - | To look at the effect of auxin on plants, we supplied differing indole 3-acetic acid concentrations to Arabidopsis seedlings in liquid culture.< | + | <p>To look at the effect of auxin on plants, we supplied differing indole 3-acetic acid concentrations to Arabidopsis seedlings in liquid culture.</p> |
| - | + | <p>Si modelled the concentration of auxin secreted by our bacteria to be 10mM. Accordingly, we used concentrations starting from 10mM to test the effect of different auxin concentrations on the length of the roots and their branching. We made the auxin concentrations by serial dilution and added 10ml of concentrated auxin solution to 100ml of half-MS media each. Twenty-five seeds were added to each flask. The seeds were incubated at 23°C and wrapped in aluminium foil to allow the plants to germinate in the dark. They will be allowed to grow in the light in 3 days' time. This follows a protocol described by King et al. (1995).</p> | |
| - | Si modelled the concentration of auxin secreted by our bacteria to be 10mM. Accordingly, we used concentrations starting from 10mM to test the effect of different auxin concentrations on the length of the roots and their branching. We made the auxin concentrations by serial dilution and added 10ml of concentrated auxin solution to 100ml of half-MS media each. Twenty-five seeds were added to each flask. The seeds were incubated at 23°C and wrapped in aluminium foil to allow the plants to germinate in the dark. They will be allowed to grow in the light in 3 days' time. This follows a protocol described by King et al. (1995). < | + | |
| - | + | ||
<h2>Wednesday, 10 August 2011</h2> | <h2>Wednesday, 10 August 2011</h2> | ||
| - | Looking at the effect of auxin on the roots also involves observing its effect on phytogels. On these gels, individual seedlings grow horizontally into a gel containing plant nutrients. These gels enable us to supply the plant with auxin at set distances from the seedling itself.< | + | <p>Looking at the effect of auxin on the roots also involves observing its effect on phytogels. On these gels, individual seedlings grow horizontally into a gel containing plant nutrients. These gels enable us to supply the plant with auxin at set distances from the seedling itself.</p> |
| - | + | <p>Si corrected the estimated auxin secretion of our bacteria to 0.0001 to 0.01 mM. Accordingly, we set up the auxin concentration gradient experiment with 0.0001, 0.001 and 0.01 mM of IAA. We injected a small volume of IAA dissolved in 70% ethanol at set distances from seeds, which were subsequently put onto the gel.</p> | |
| - | Si corrected the estimated auxin secretion of our bacteria to 0.0001 to 0.01 mM. Accordingly, we set up the auxin concentration gradient experiment with 0.0001, 0.001 and 0.01 mM of IAA. We injected a small volume of IAA dissolved in 70% ethanol at set distances from seeds, which were subsequently put onto the gel. | + | |
</html> | </html> | ||
Revision as of 13:41, 12 August 2011
Auxin Results
Chapter 1: Assembly of genetic constructs
We wish to build a single expression plasmid that can express IaaH and IaaM. While this task can be summarised in one sentence its execution is not as short. The first problem lies in the size of these two enzymes which both exceed 1kbp making their synthesis a problem. We therefore created a new standard for biobrick assembly to tackle this issue. We broke up these large sequences into four fragments that were ordered at the end of week 3. In preparation for the arrival of these fragments (circa 8-10 days) we started to transform our cells with the pVEg+pSB1C3 backbone constructs in order to make enough genetic material for a gibson assembly reaction. This chapter will describe our struggles and successes throughout this grueling and yet rewarding process.
29th of July
Our first transformations were a success! We have managed to transform our competent cell colonies with pSB1C3 containing BBa_K398500 and J23100 promoter to produce cell line 6. We also transformed the cells with part BBa_K316001 to produce cell line 7 and part BBa_K316005 to produce cell line 8. With these cell lines we will be able to make more copies of each part in preparation for the arrival of our synthesized sequences. We are under a tight schedule so efficiency is key.
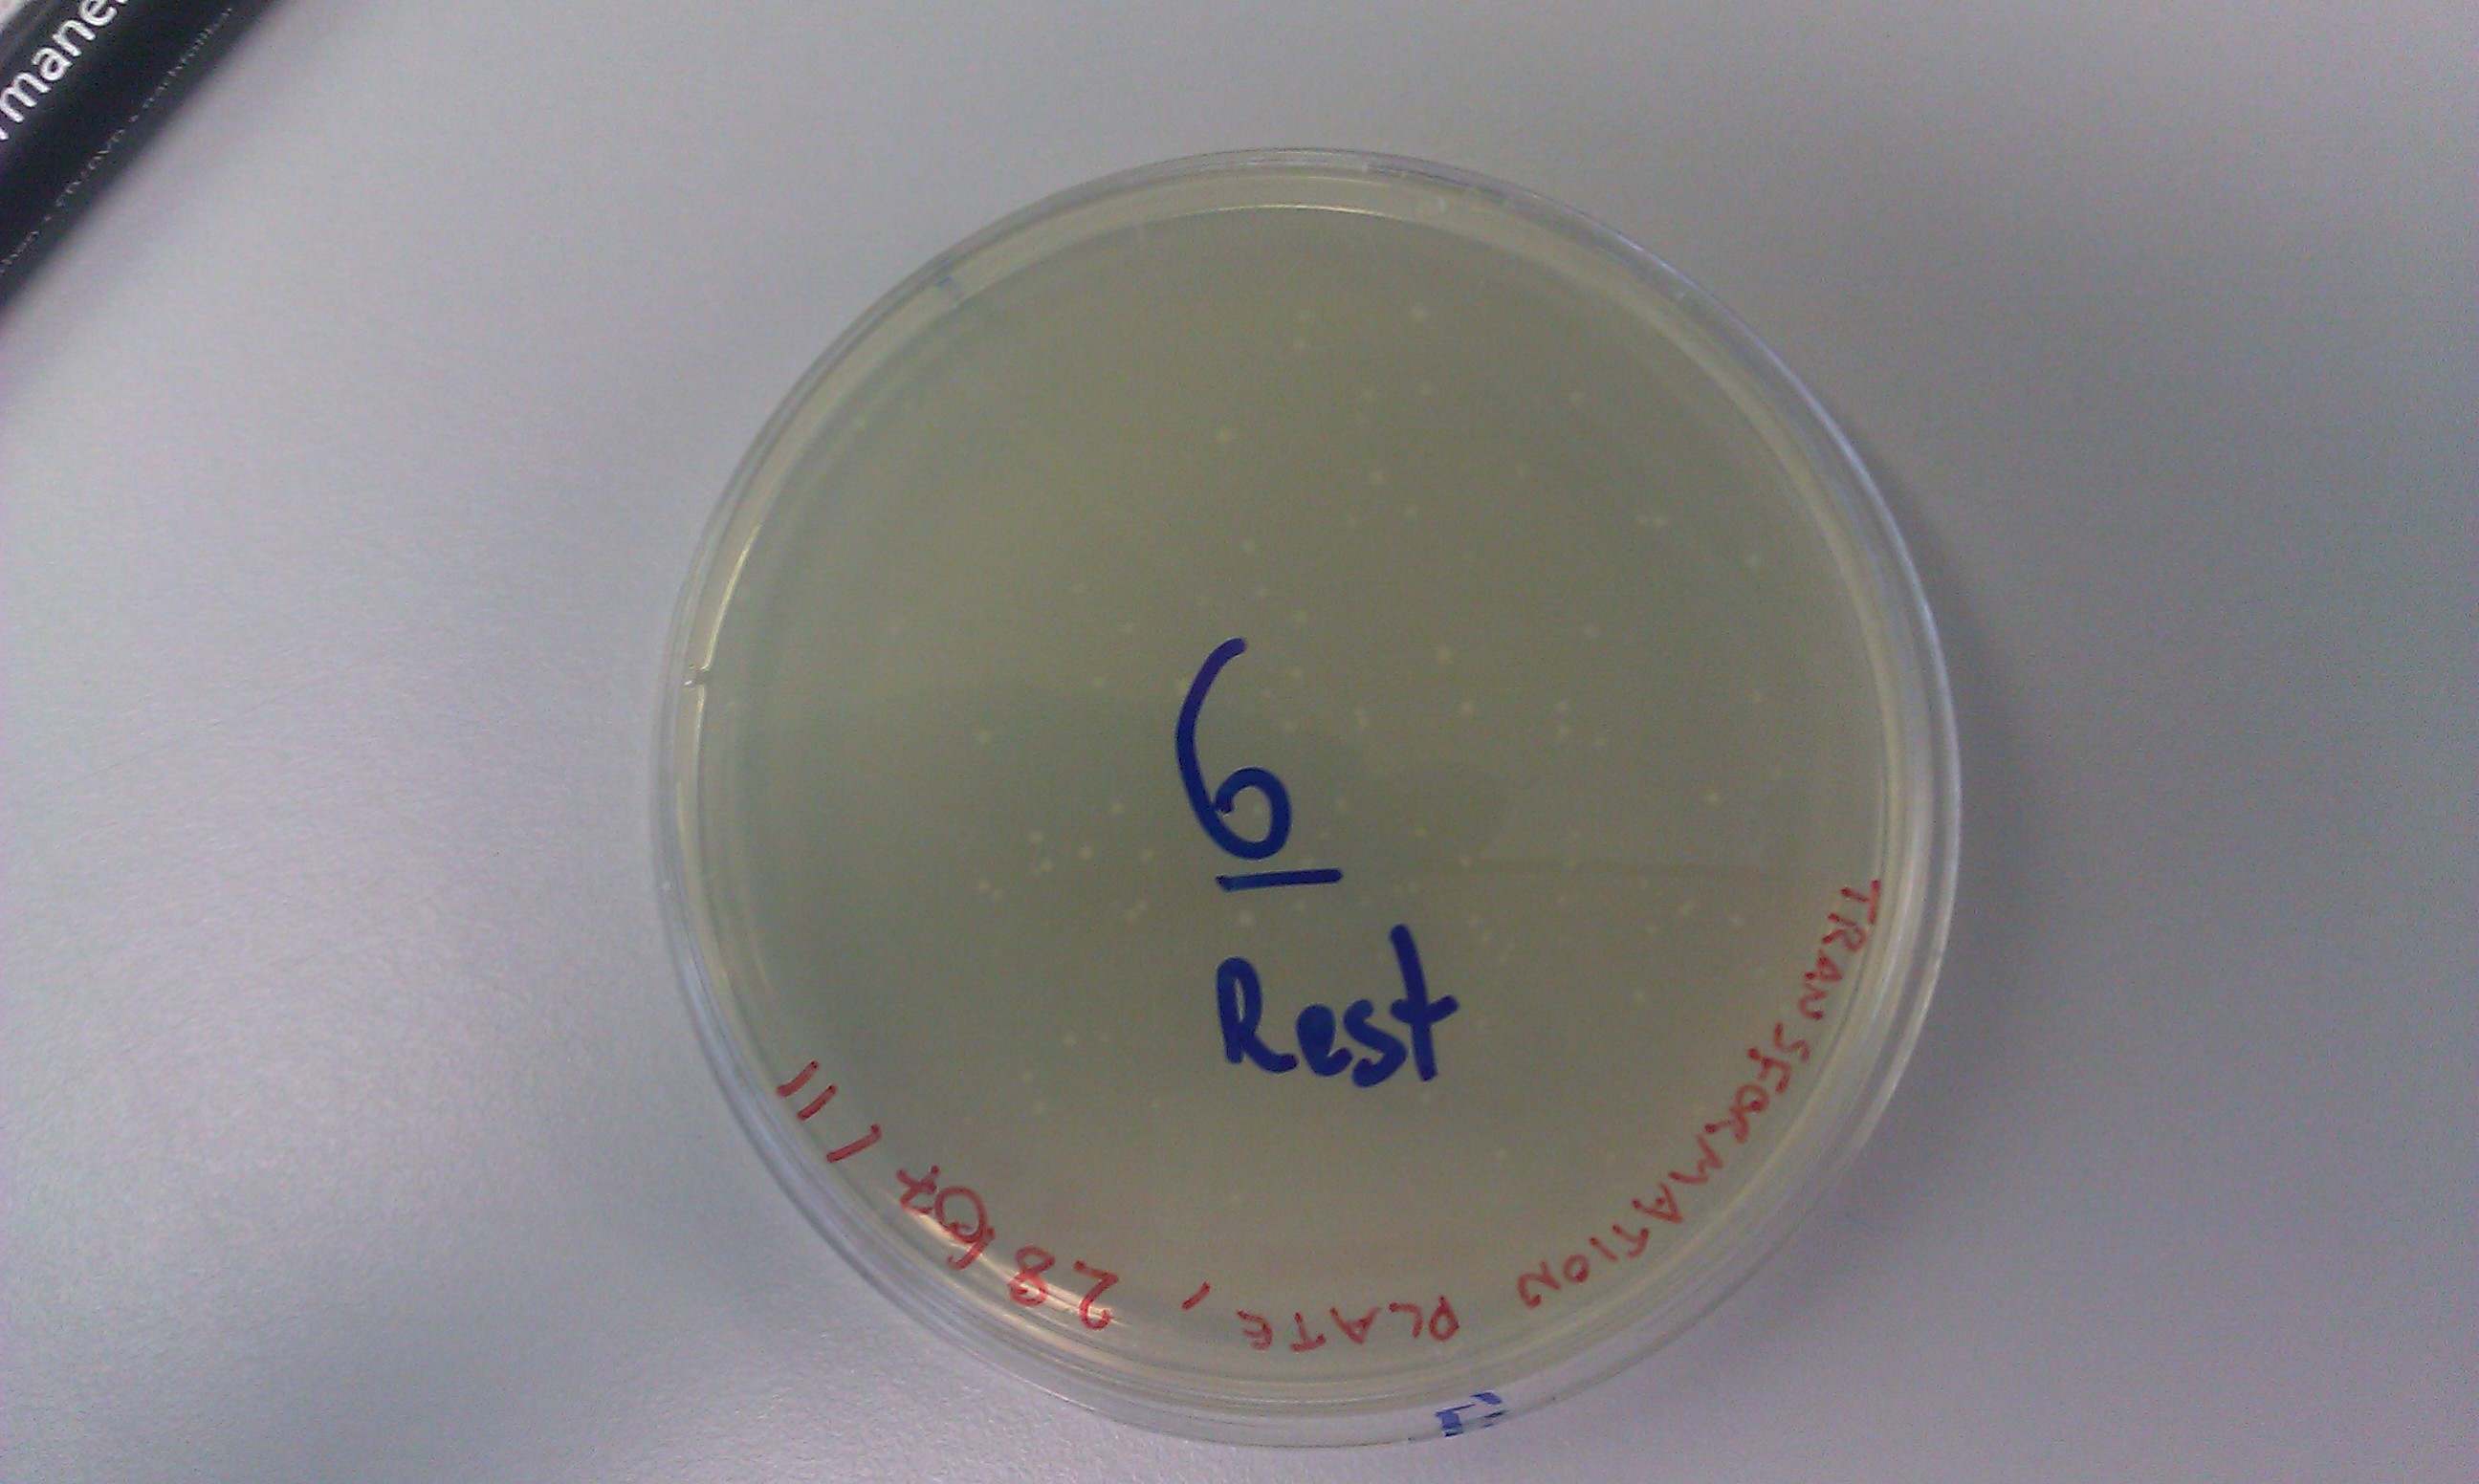
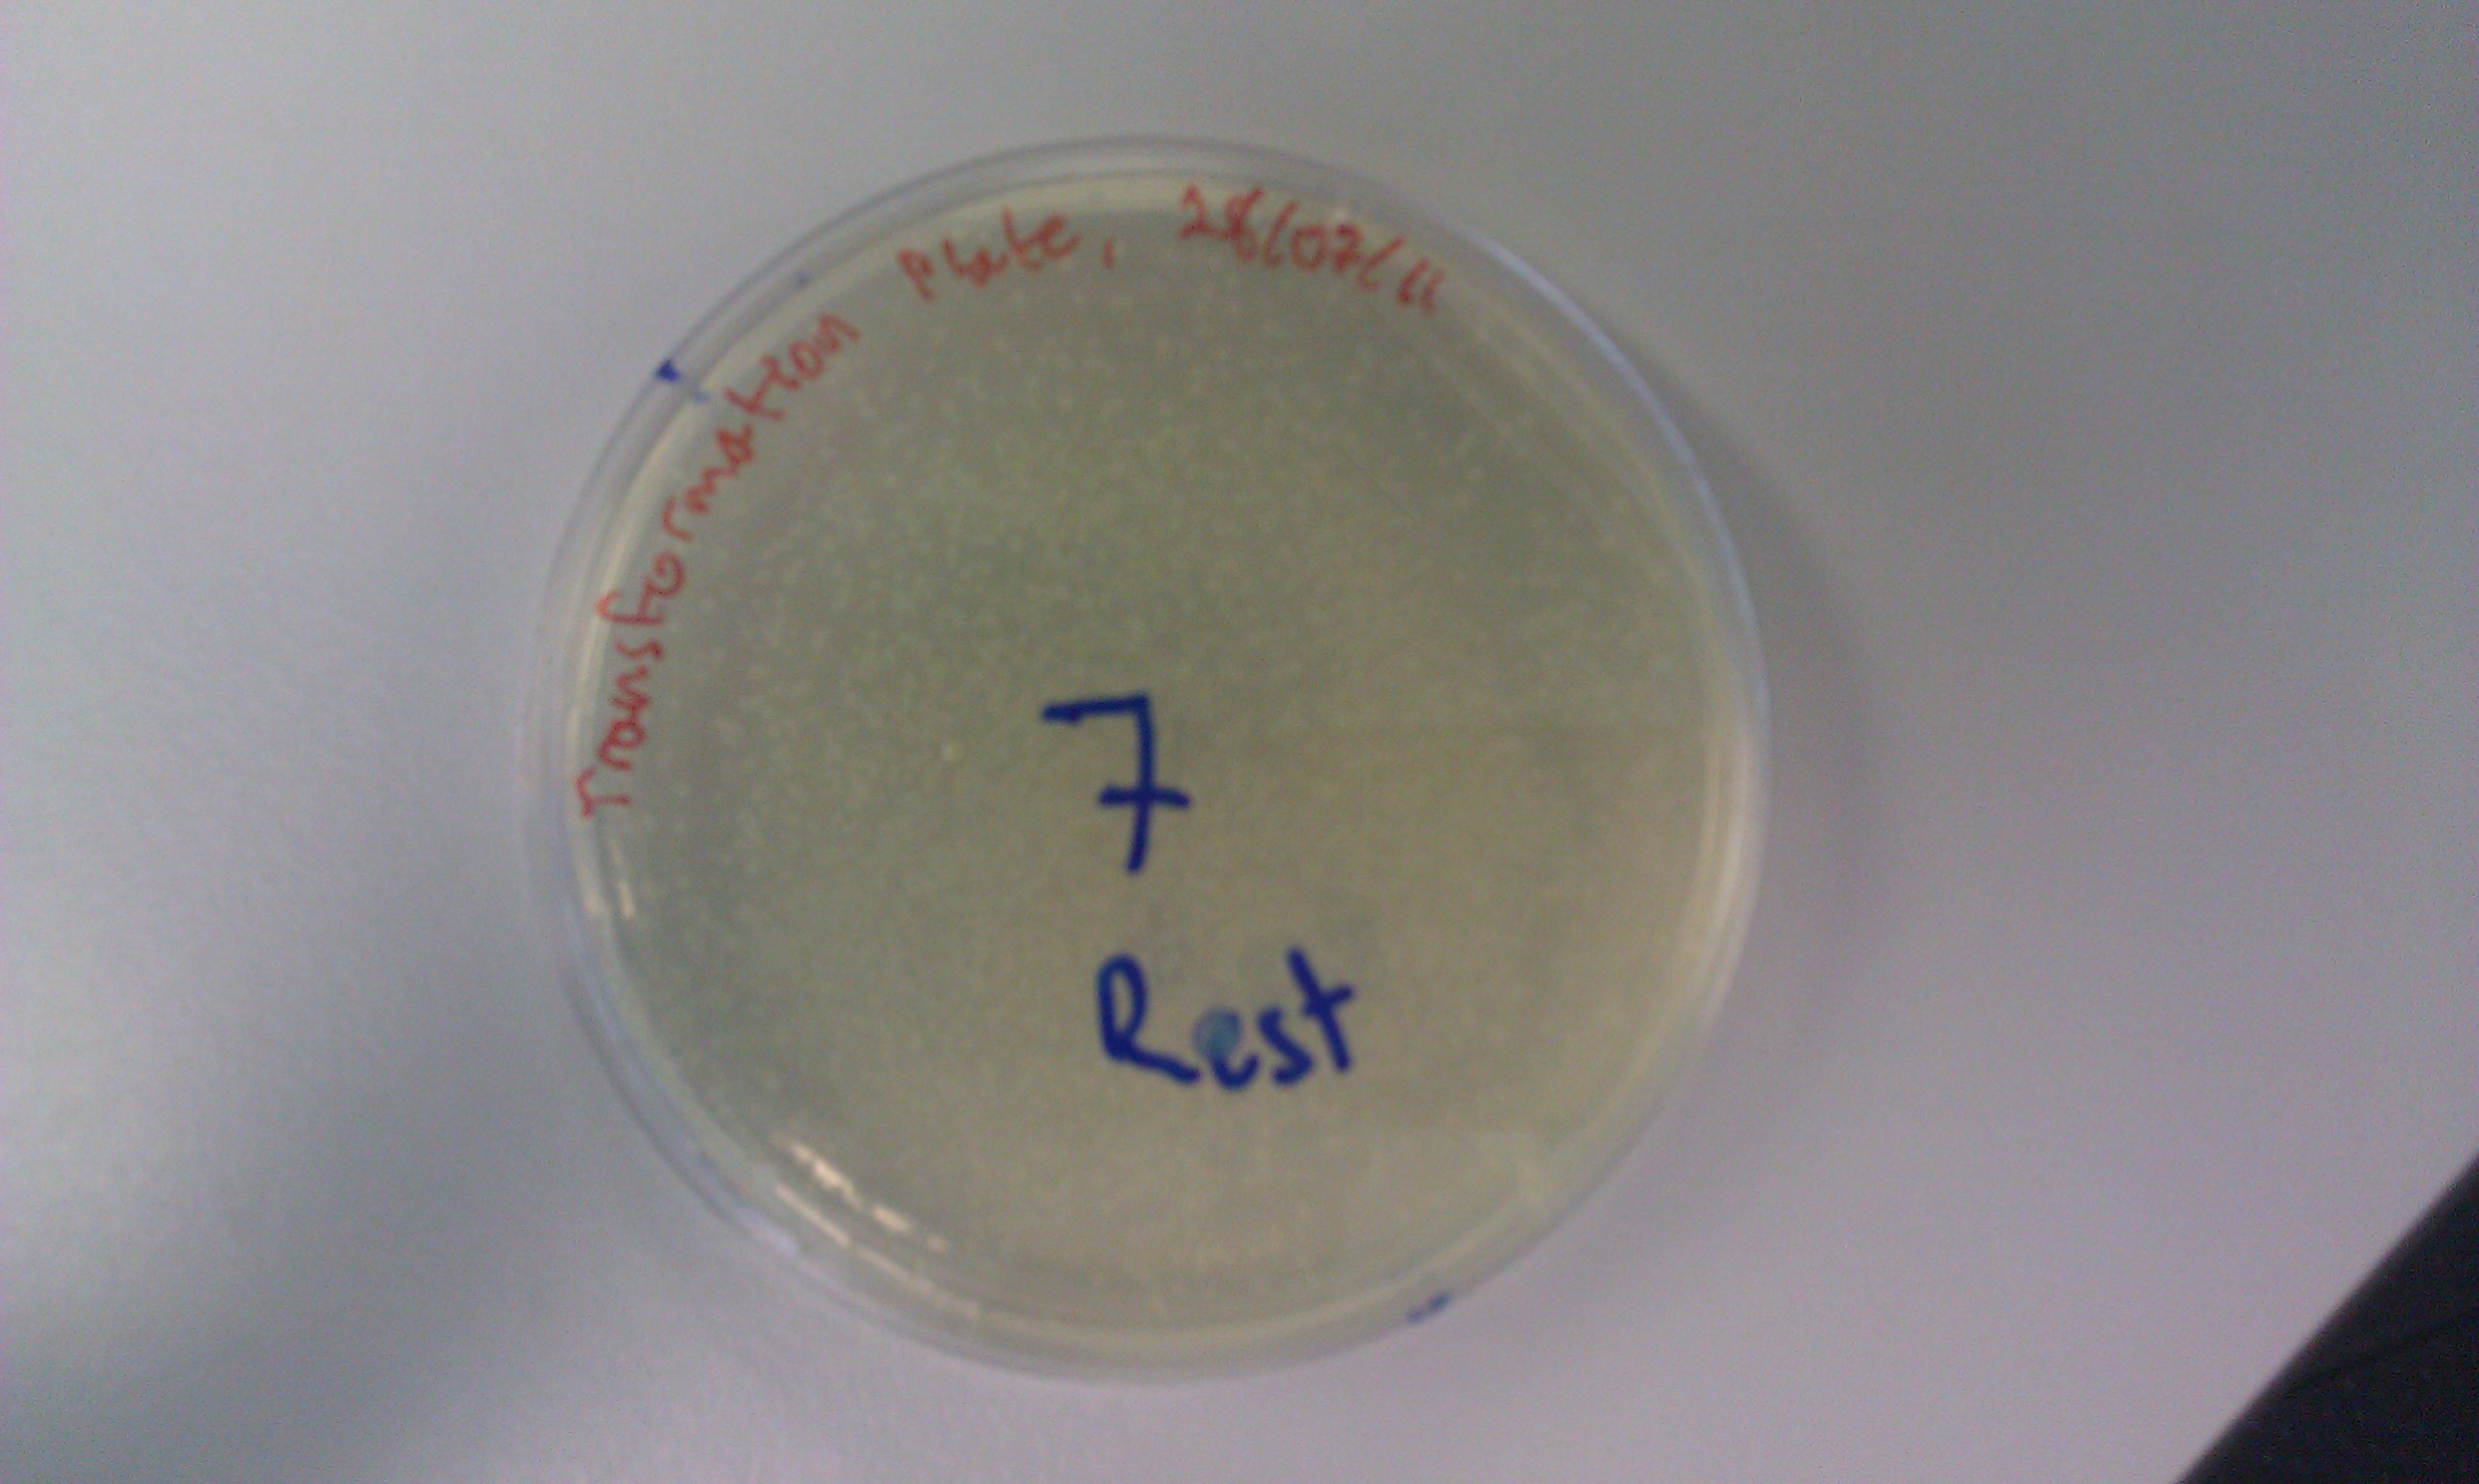
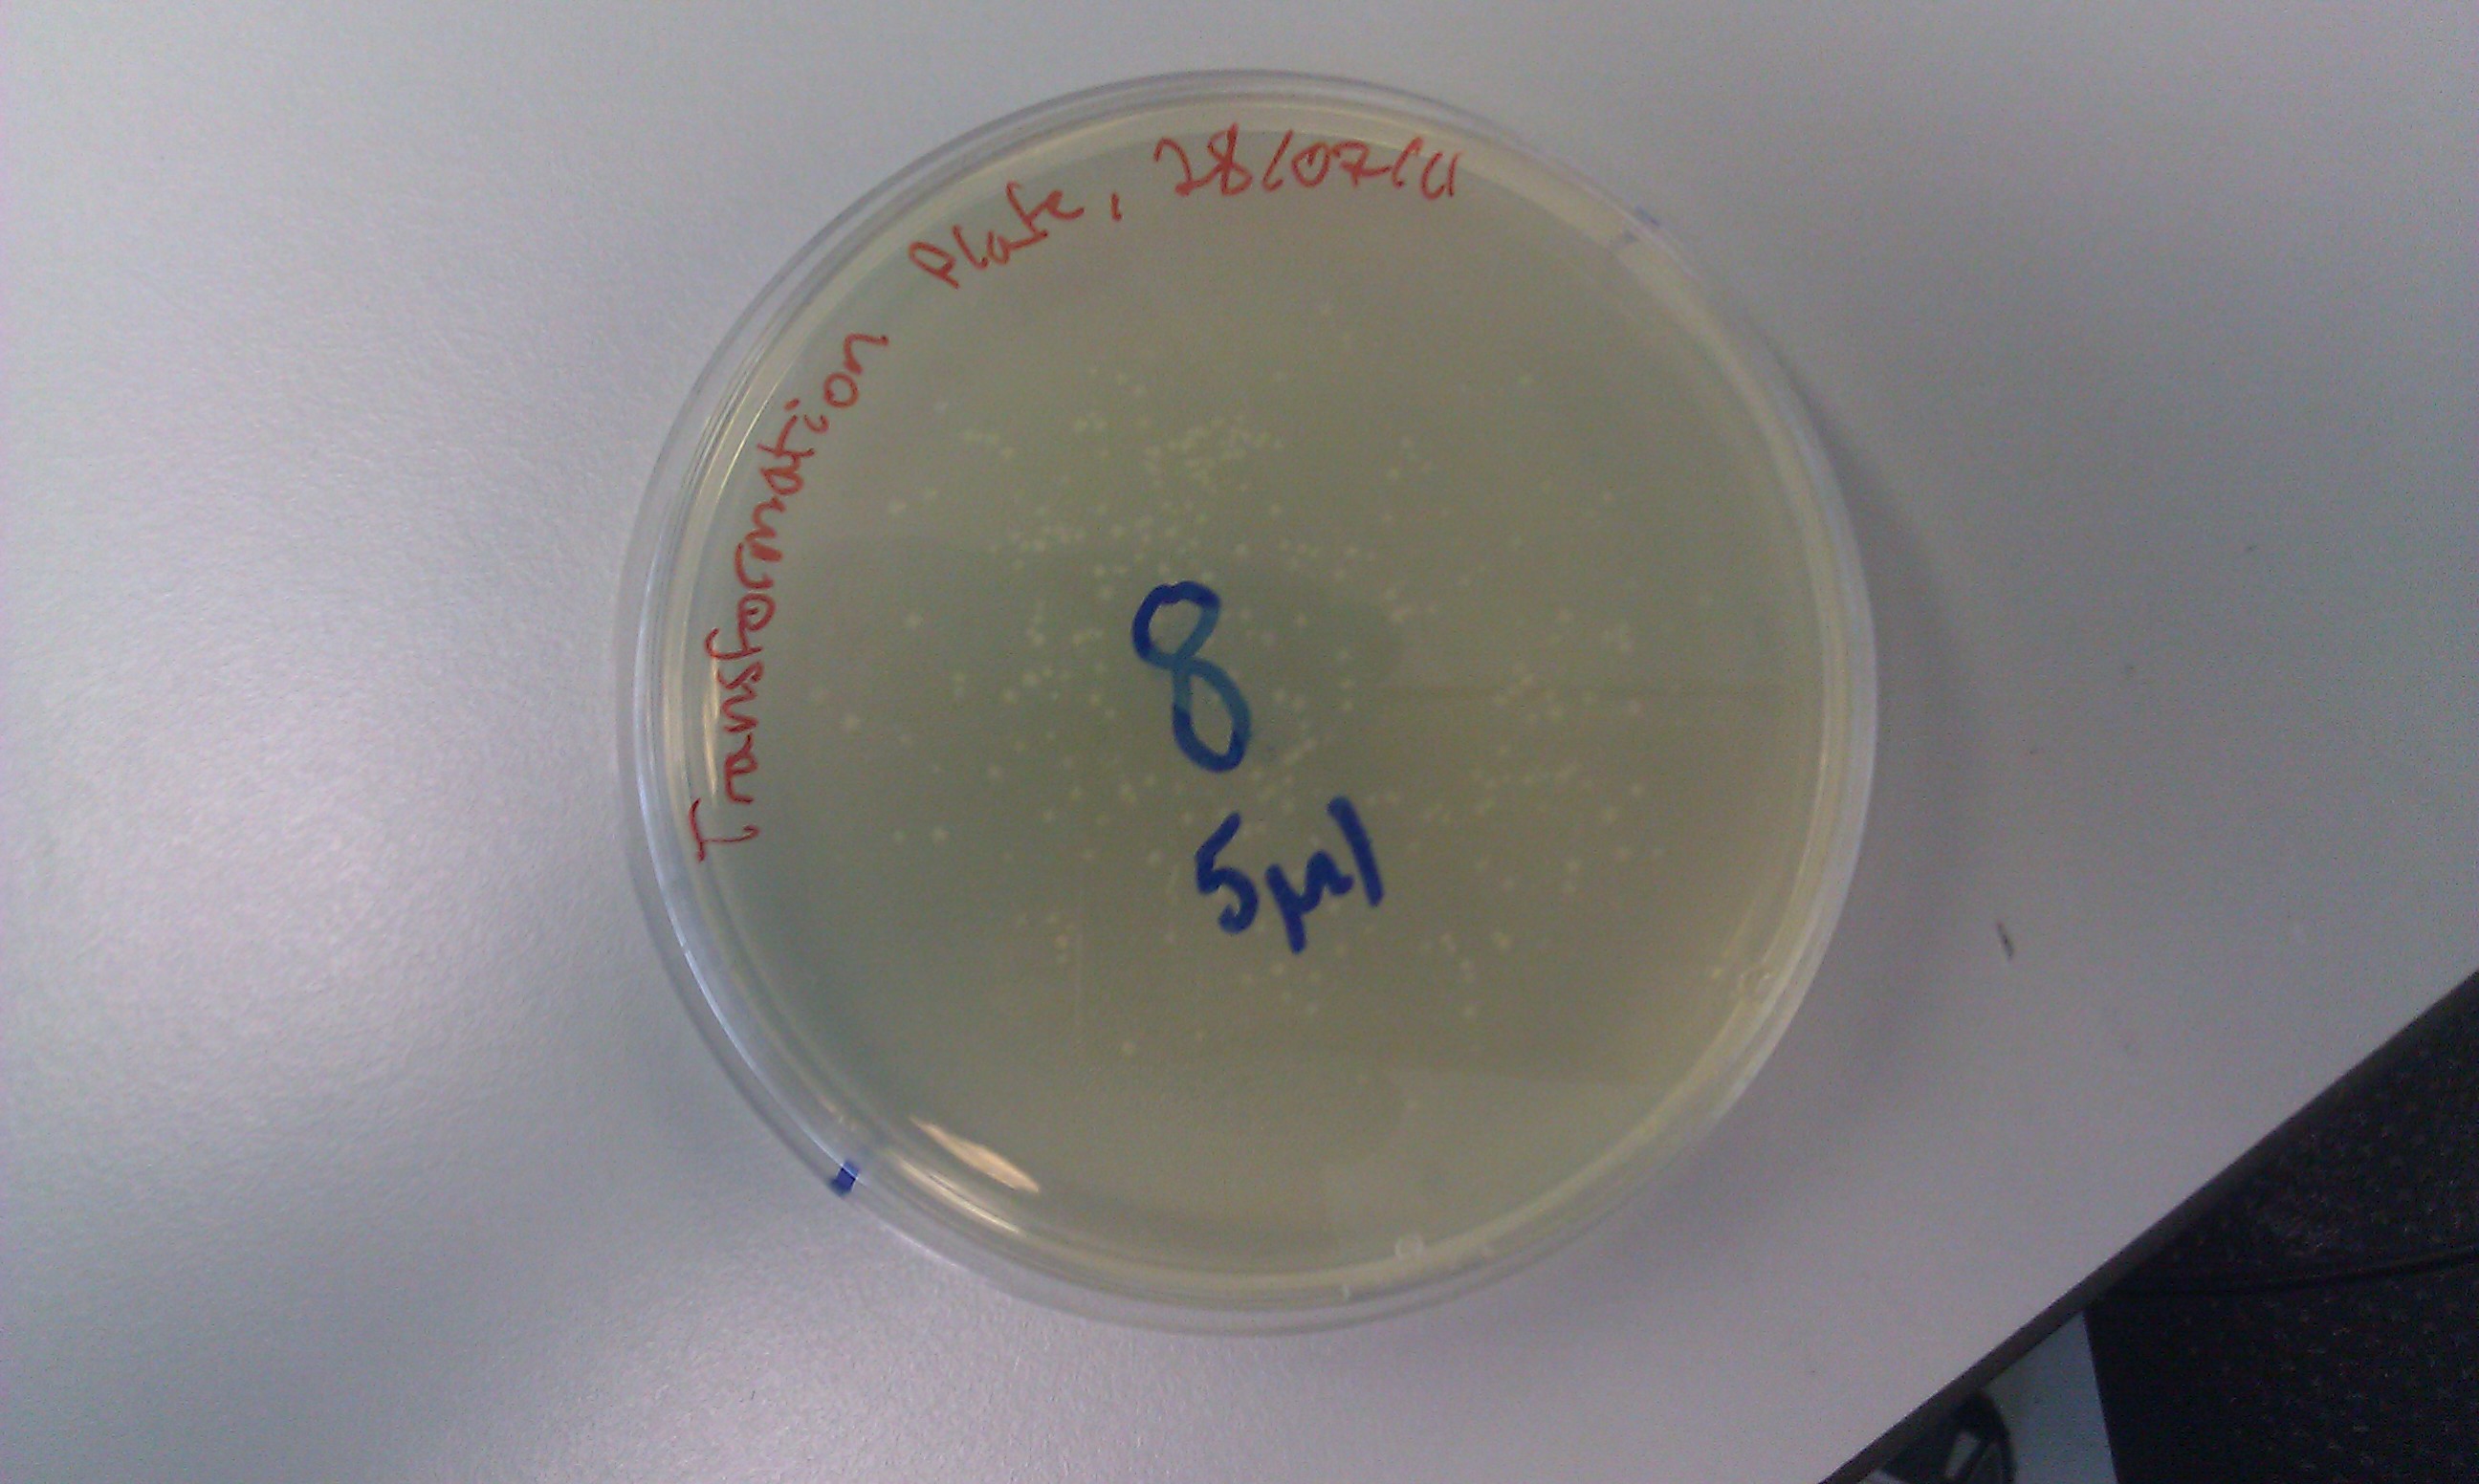
Also, the cell line with the superfolded GFP integrated in its genome has been plated successfully. We have confirmed that these are the correct cell lines by looking at them under UV light. Their green glow was brighter than we expected.
However, cell line 1 did not grow in the liquid broth media at the same concentration of kanamycin. We will create an assay to ascertain the optimum kanamycin concentration. This is both a bizarre and unexpected result that must be rectified.
30th of July
The previous day, we had obtained the mcpS gene in a pRK415 plasmid from Spain. We then performed a transformation on the competent 5α cell line and obtained the results on this day. Out of the four plates one of them contained transformed cells. We named these cells 10.
1st of August
A month has already passed since we started our project. The experiments that were conducted on this day were a mini-prep on samples 6,7,8 and 10 that were inoculated into an LB broth culture the night before. We used a mini-prep kit to obtain the plasmid DNA that we wanted from the transformed cells. Then, once we obtained the DNA, we started a restriction digest using PstI and EcoRI for 1.5 hours to confirm that the samples from the mini-prep contained the DNA that we wanted (the pSB1C3 backbone with the appropriate promoters).
Sadly, once we tried to visualize the results on a gel, the results were less than satisfactory. Mini-prep 6a and 7b seems to have failed and the rest of the bands do not make much sense. The experiment had to be repeated.
2nd of August
Today we attempted the restriction digest again and the results verified that samples 6,7 and 8 were actually pSB1C3 constructs with the required components. Therefore, the mini-prep experiment had worked and did not need to be repeated. It is a great feeling when everything comes together.
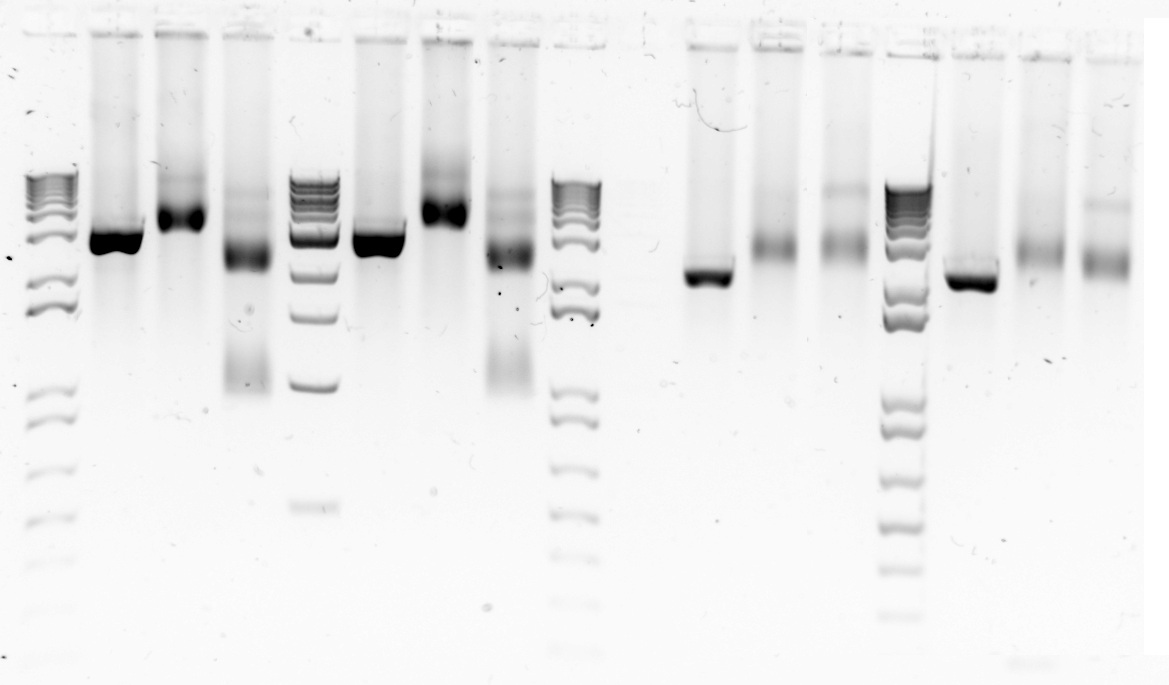
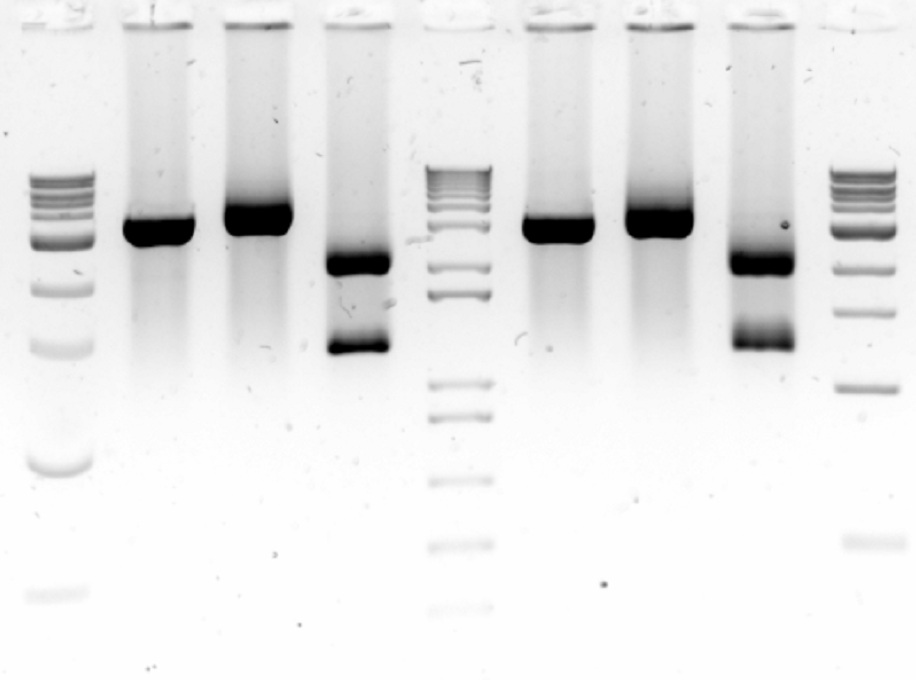
Gel 1&2. Restriction digest of three backbone vectors with EcoRI(E) and PstI(P) to confirm backbone length. Gel1: Lane1-1 kb DNA ladder Lane 2-6a cut with E;Lane 3-6a cut with P; Lane 4-6a cut with E+P;Lane 6-6b cut with E; Lane 7- 6b cut with P; Lane 8- 6b cut with E+P; Lane 11- 7a cut with E; Lane 12- 7a cut with P; Lane 13- 7a cut with E+P; Lane 15- 7b cut with E; Lane 16- 7b cut with P; Lane 17- 7b cut with E+P. Gel 2: Lane 1 - 1kb ladder; lane 2 - 8a cut with E; lane 3- 8a cut with P; lane 4- 8a cut with E+P; lane 6- 8b cut with E; lane 7- 8b cut with P; lane 8 - 8b cut with E+P.
3rd of August
Today we attempted to PCR samples 6, 7 and 8. The PCR did not end up working so well so. The annealing temperature must have been too low because we obtained bands that we did not want. Also, there must have been too little Sybr safe in the gel because the bands that were there were not bright. The PCR will be repeated once again and we will use a temperature gradient for (hopefully) better results.
4th of August
Today we redid the PCR of samples 6, 7, and 8 but with a temperature gradient to improve primer annealing.... and it was a success! So tomorrow we can run the rest of the Dpn1 digested DNA on a gel and gel purify it, then the vectors are ready to be used for DNA assembly once our genes arrive!
Gels 3&4: Temperature gradient PCR of desired backbone with promoter and terminator out of plasmids. Gel 3:Lane 1- 1kb DNA ladder; lanes 2 to 7 - PCR of vector 6 from 57.1°C to 62.6°C; lanes 9 to 15 - PCR of vector 7 from 57.1°C to 62.6°C. Gel 4: lanes 2 to 7 - PCR of vector 8 from 57.1°C to 62.6°C
The backbone sequences have also returned. All of the samples are in order except a one base pair mutation in sample 8 within the pVEg promoter. For now, we are going to amplify it anyways in the hope that the one base pair mutation is just an error that occured during sequencing. Either way, sample 8 is a back-up of sample 7 so there should be no problems either way.
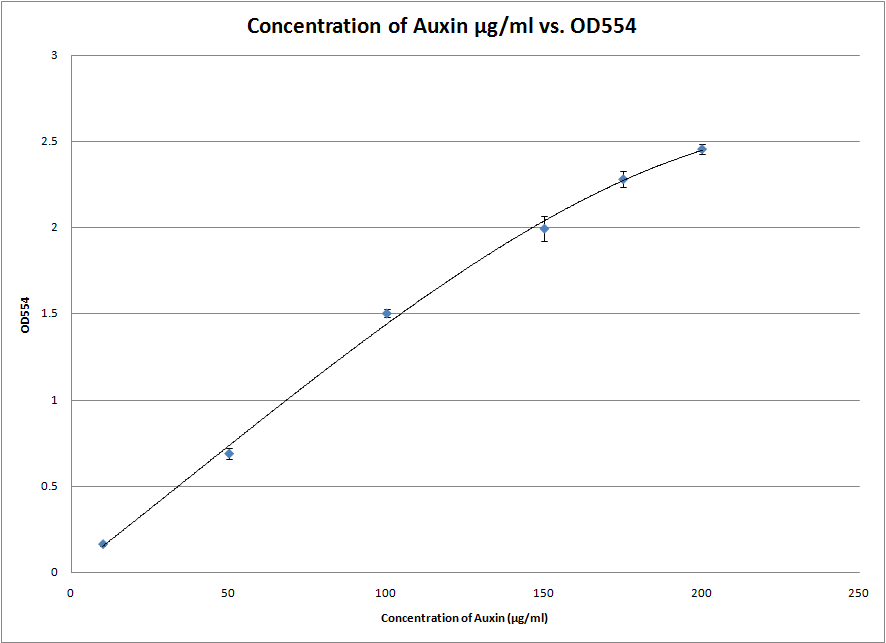
We also started experimenting with the Salkowski reagent. In particular, we tested the S2/1 method and found that the ideal wavelength for measuring the IAA concentration with our apparatus is at 554nm. This was done by scanning between 500nm and 600nm to obtain the individual absorption spectra of each sample. The wavelength at which the absorbance peaked was chosen. This experiment gave us a great standard curve from which we can roughly estimate the amount of IAA in a solution between 2 and 200 μg/ml.
5th of August
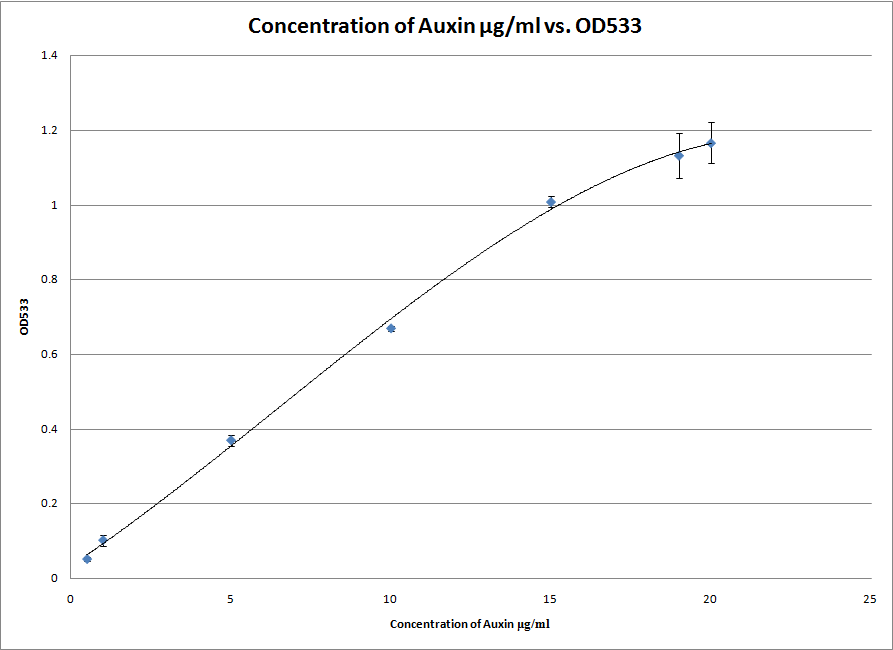
After successfully testing the S2/1 method we also attempted the PC method which is both more exact and more specific for IAA. However, it only works at a lower range of concentrations of IAA and will therefore be useless if our bacteria end up excreting more than 20 μg/ml of IAA into the solution. Either way, we now have two standard curves which can be used to measure the amount of IAA in a solution. We are ready for the synthetic genes to arrive!
8th of August
Today we ran a gel of the PCRd backbone DNA extracted from the previous gel to make sure that the DNA was pure. The gel results were succesful. We also transformed cells with the pure DNA to check that the Dpn1 digestion worked properly.
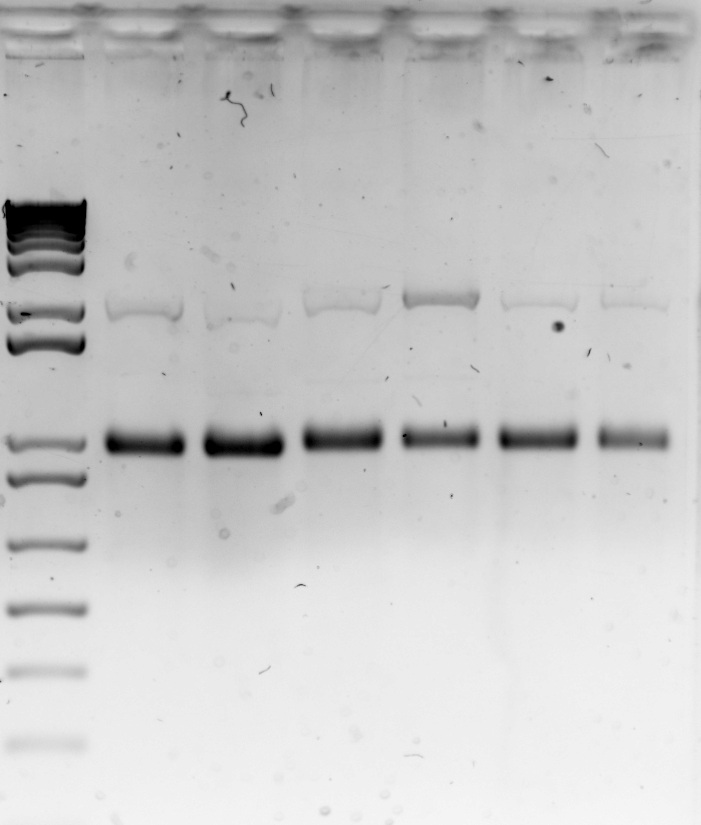
Gel 5: Gel extracted backbone vector DNA run on a gel to confirm purity. Lane 1- 1 kb DNA ladder; Lane 2- vector 6a; Lane 3- vector 6b; Lane 4- vector 7a; Lane 5- vector 7b; Lane 6- vector 8a; Lane 7- vector 8b.
9th of August
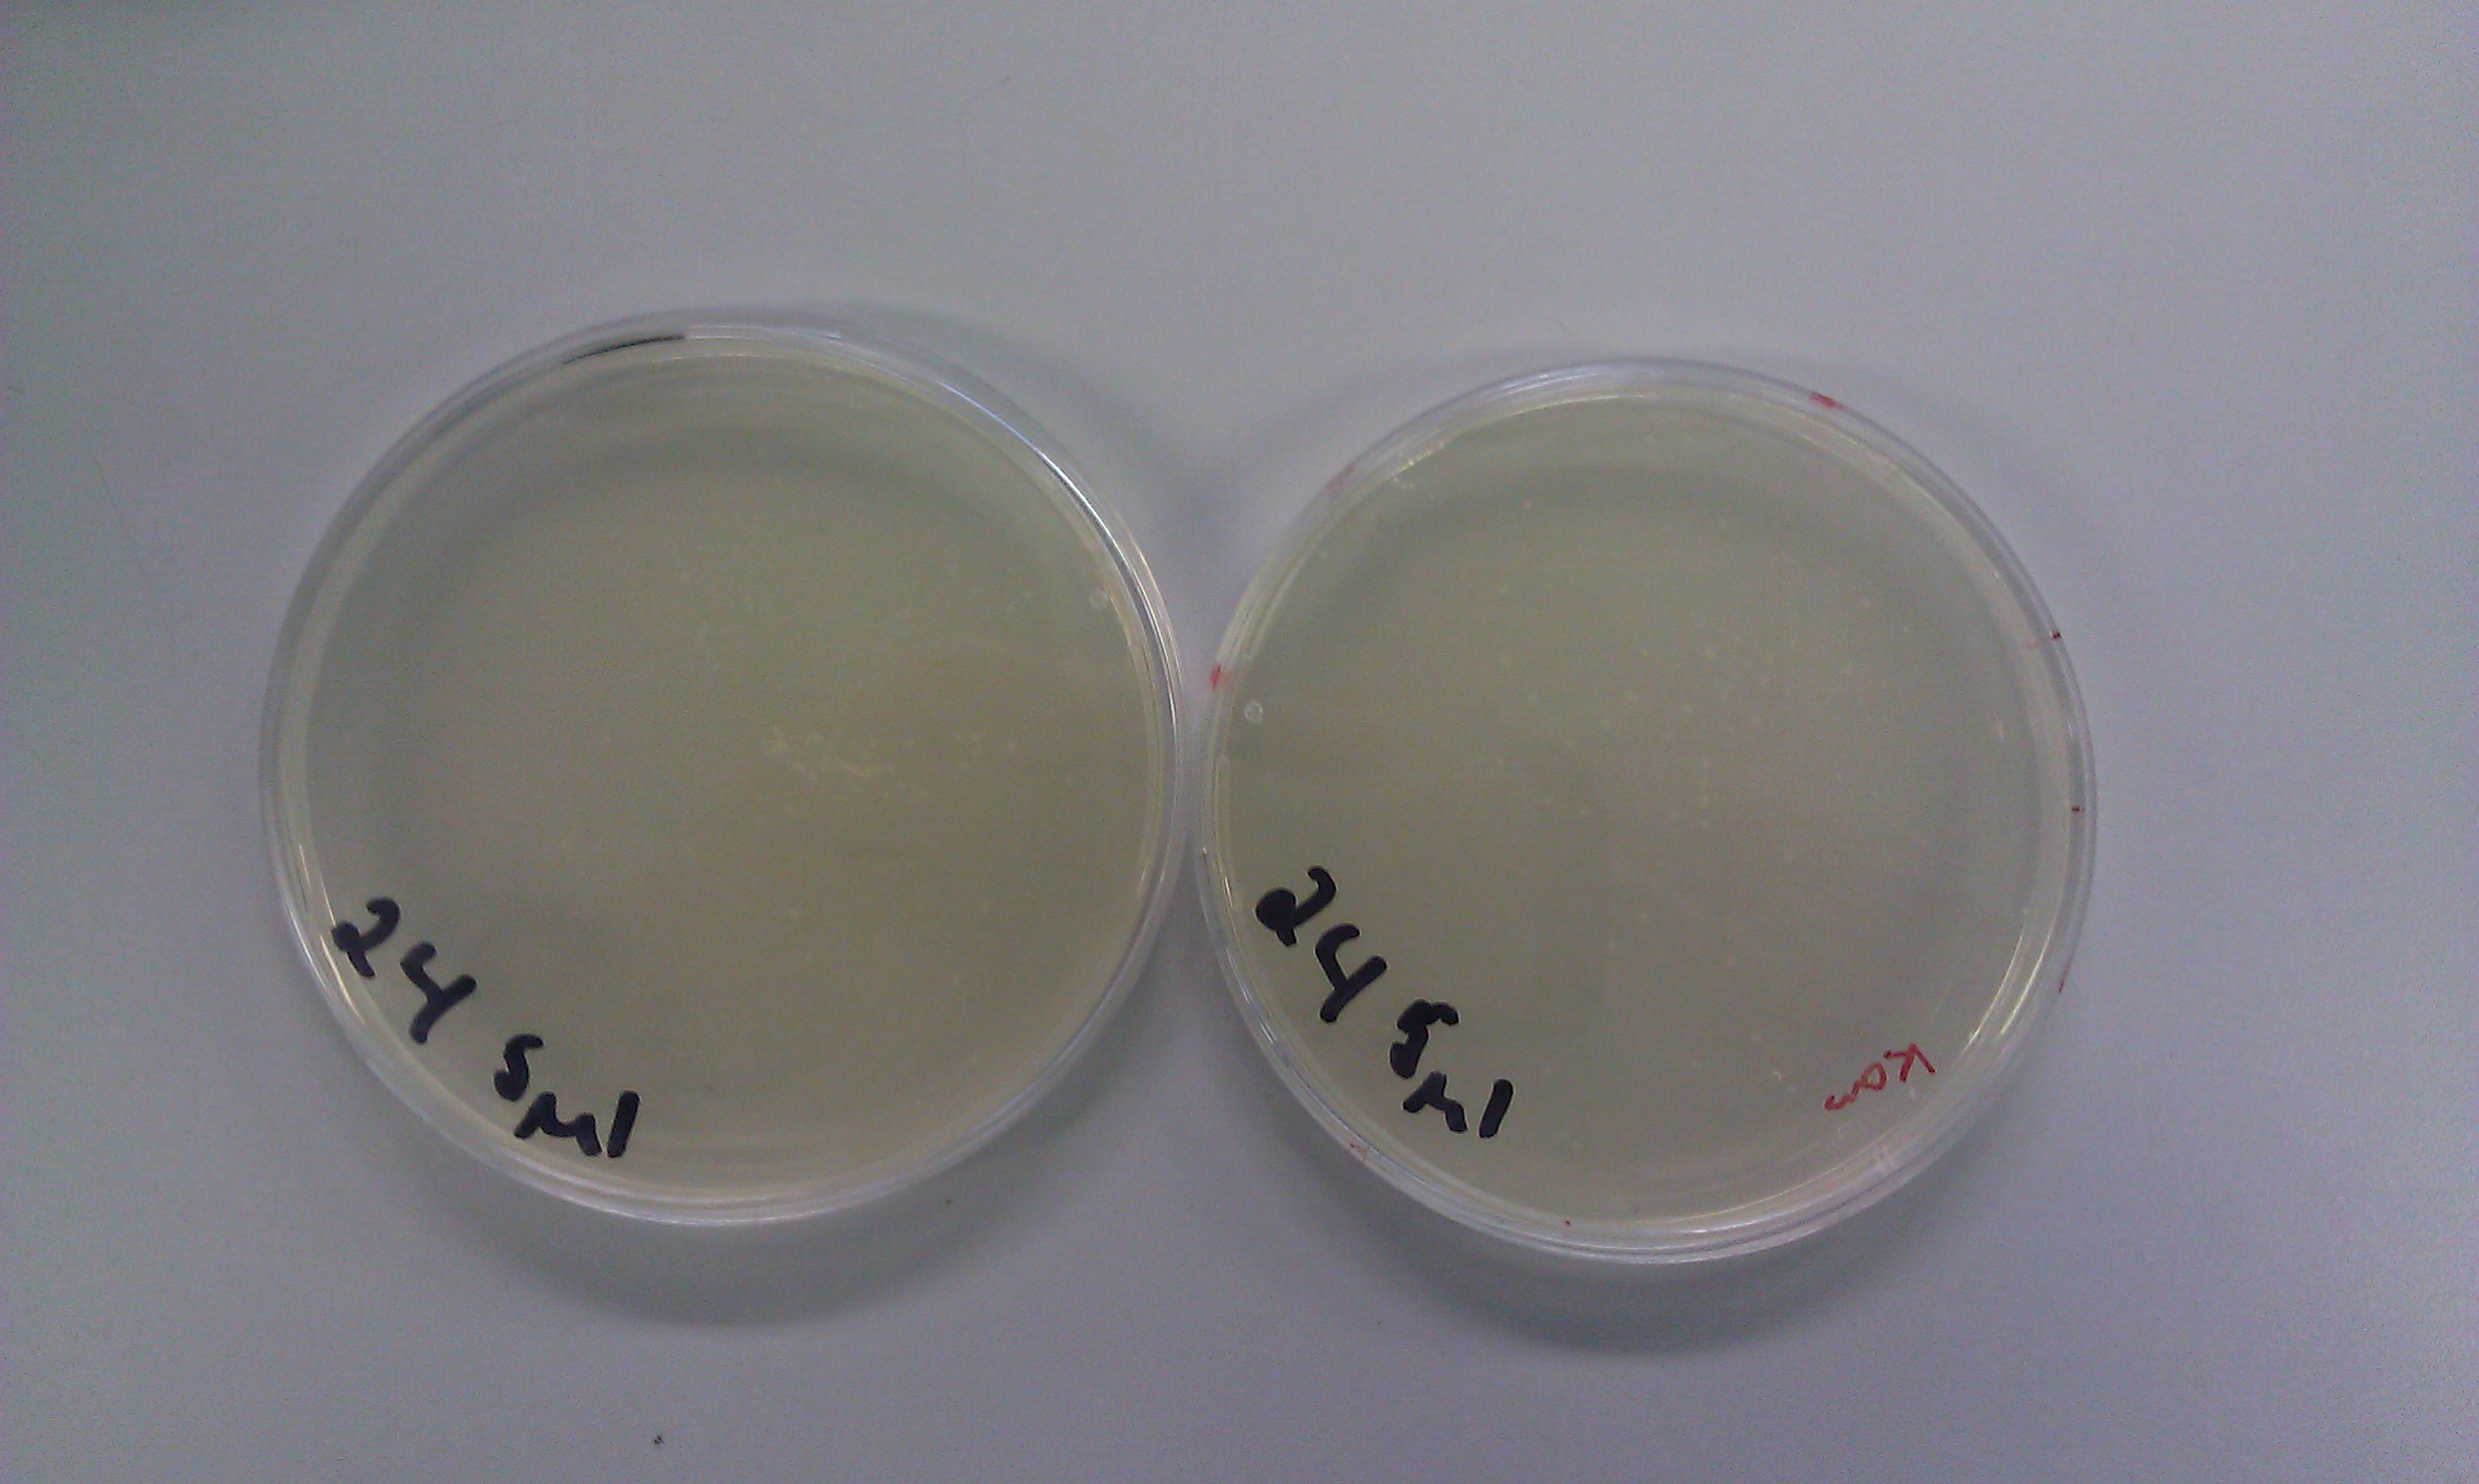
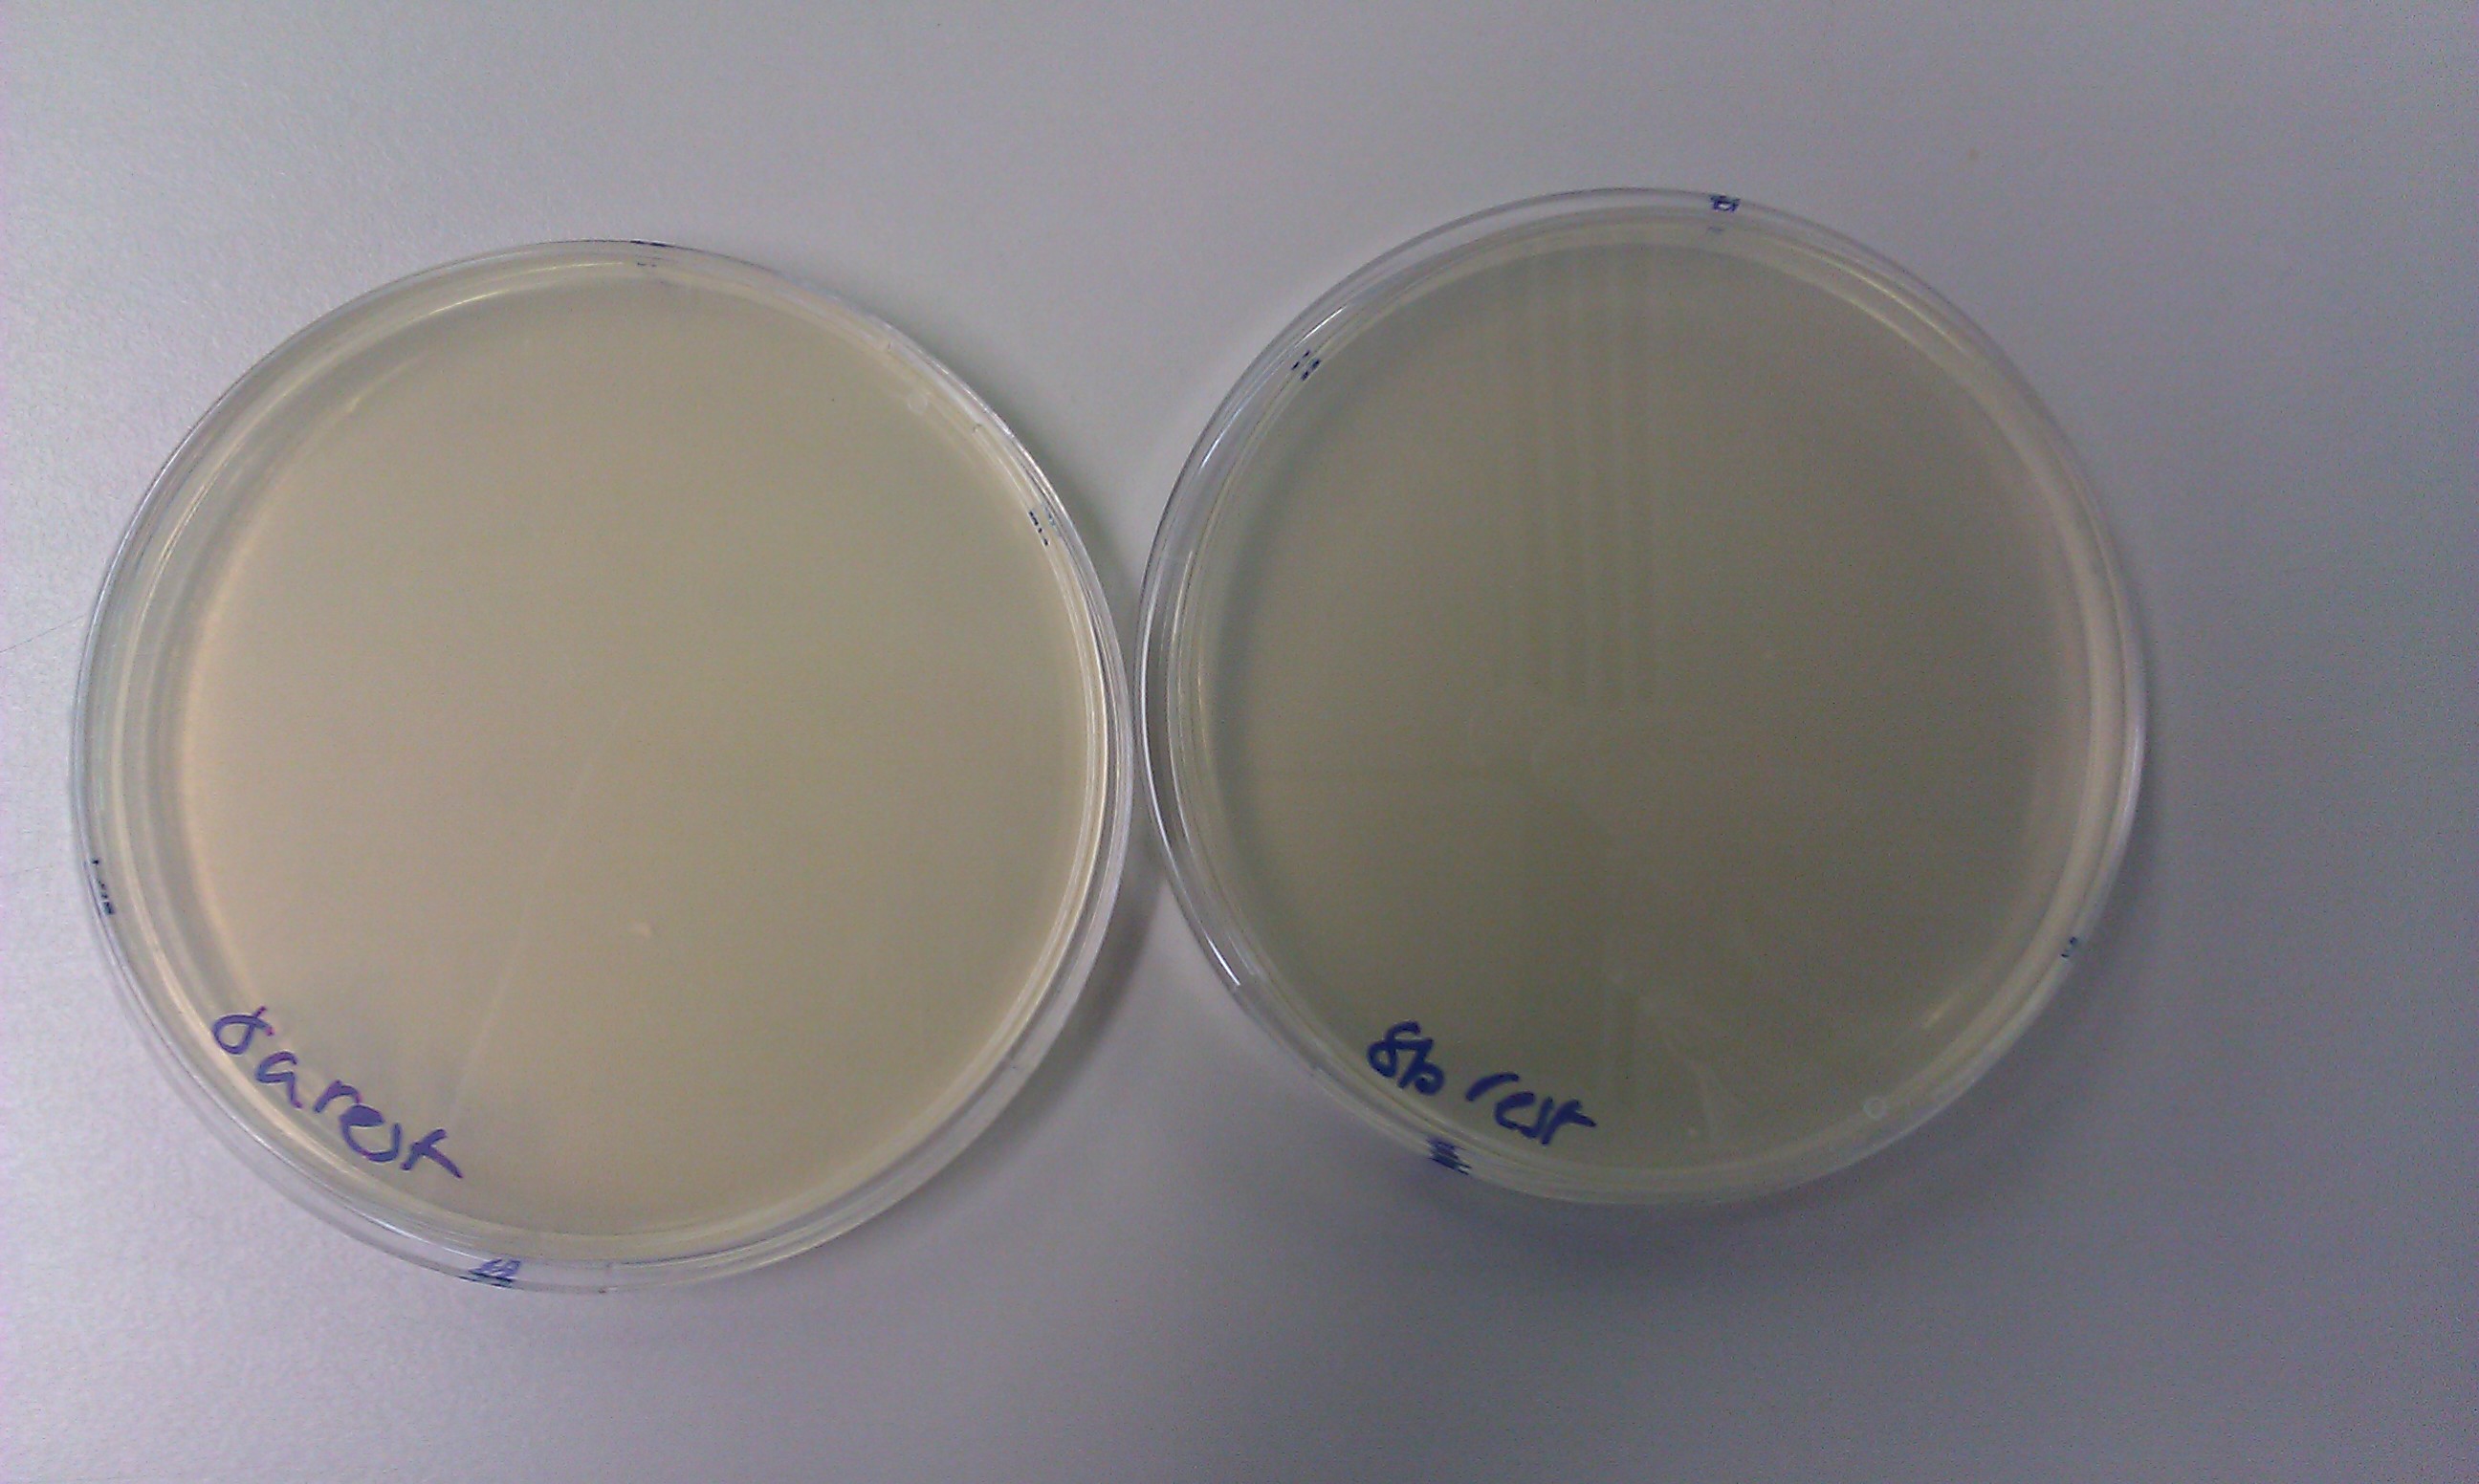
Transformations of auxin fragment 1 (20) and auxin fragment 4 (24) were successful. We obtained plenty of colonies to choose from on both the ampicillin and kanamycin plates. Also, the DpnI digest transformations created bacteria that had no resistance to chloramphenicol.
However, sample 8 has to be repeated because in the "rest" plates there were 1 or 2 colonies on each.
Chapter 2: Auxin assays
How much auxin will we be producing? More importantly, has the module actually worked?! This chapter will look into the methods that we have decided to use in order to measure the amount of auxin in a solution. We have decided to use qualitative methods such as the Salkowski reagent (changes colour which is always good) as well as quantitative methods such as HPLC and GC-MS for more accurate results. Cross our fingers and hope this works!
5th of August
Today we performed the first S2/1 Salkowski assay successfully. The solution did indeed change colour giving an excellent visual result.
8th of August
Today we performed the first PC Salkowski assay successfully. We even took a picture of the gradient:
[[File:ICL_PC_picture.jpg|400px|center]]This was one of the 3 repeats that gave us the following standard curve:
Chapter 3: effect of auxin on plants
Tuesday, 9 August 2011
To look at the effect of auxin on plants, we supplied differing indole 3-acetic acid concentrations to Arabidopsis seedlings in liquid culture.
Si modelled the concentration of auxin secreted by our bacteria to be 10mM. Accordingly, we used concentrations starting from 10mM to test the effect of different auxin concentrations on the length of the roots and their branching. We made the auxin concentrations by serial dilution and added 10ml of concentrated auxin solution to 100ml of half-MS media each. Twenty-five seeds were added to each flask. The seeds were incubated at 23°C and wrapped in aluminium foil to allow the plants to germinate in the dark. They will be allowed to grow in the light in 3 days' time. This follows a protocol described by King et al. (1995).
Wednesday, 10 August 2011
Looking at the effect of auxin on the roots also involves observing its effect on phytogels. On these gels, individual seedlings grow horizontally into a gel containing plant nutrients. These gels enable us to supply the plant with auxin at set distances from the seedling itself.
Si corrected the estimated auxin secretion of our bacteria to 0.0001 to 0.01 mM. Accordingly, we set up the auxin concentration gradient experiment with 0.0001, 0.001 and 0.01 mM of IAA. We injected a small volume of IAA dissolved in 70% ethanol at set distances from seeds, which were subsequently put onto the gel.
 "
"


