Team:BU Wellesley Software/Notebook/AlbertoNotebook
From 2011.igem.org
2011 IGEM Wet Lab Notebook
Weekly log by Alberto Purwada
Contents |
7/4/2011-7/10/2011
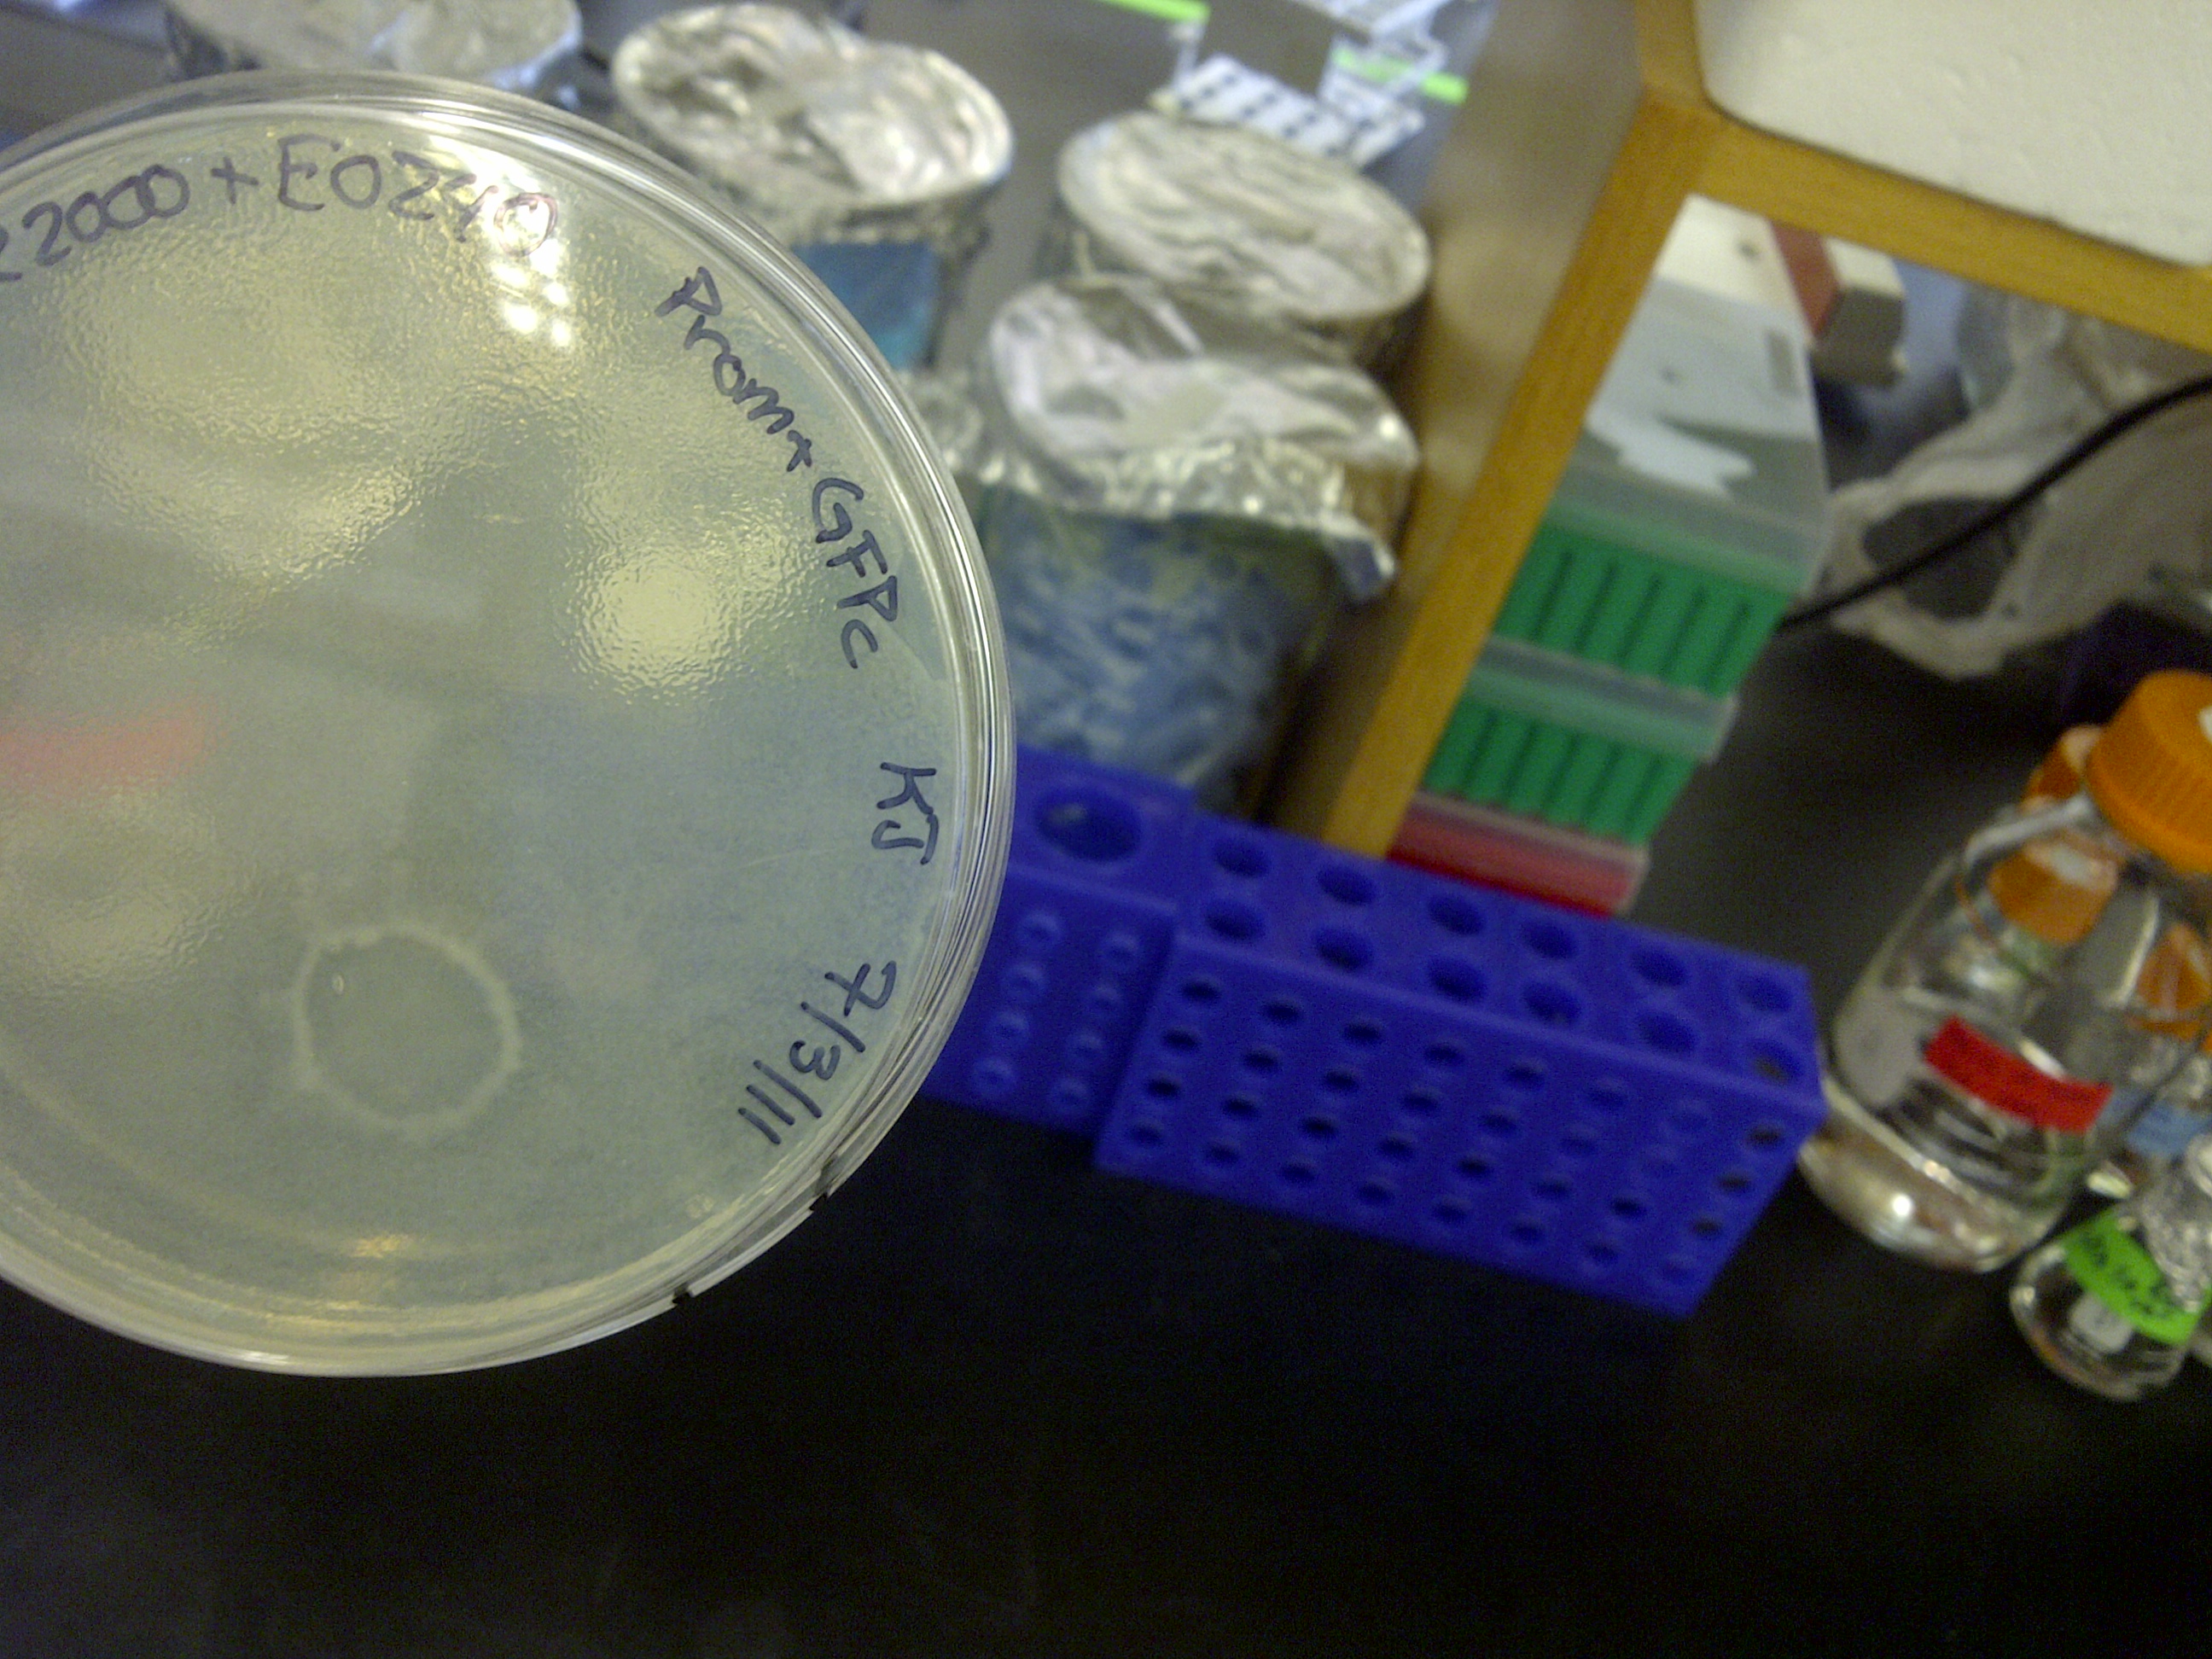
The transformed plates from last week did not contain the usual colonies. Instead, each plate had a thin layer of bacterial biofilm and it smells far stronger, albeit similar, to the usual E. coli culture.
6/27/2011-7/3/2011
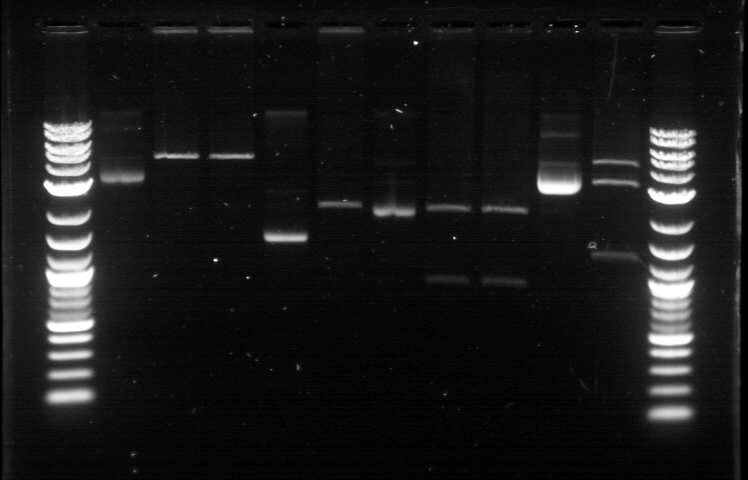
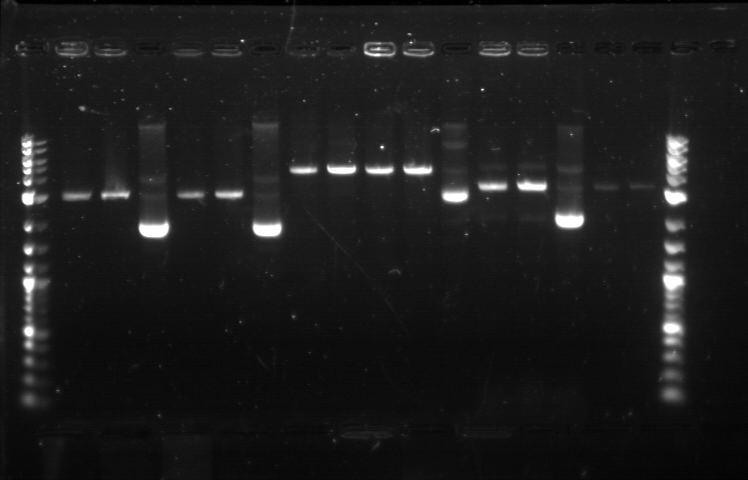
Utilizing the digested plasmid from last week, I ran gel electrophoresis to separate the fragments of the digested plasmids from last week. It was apparent that the GFP composite had been successfully cut, which means that we had solved the problem with restriction digest.
1. DNA Ladder
2. Promoter (Bba_R2000.1)
3. Promoter (Bba_R2000.1) - Cut
4. Promoter (Bba_R2000.2) - Cut
5. Promoter (Bba_R0040.1)
6. Promoter (Bba_R0040.1) - Cut
7. GFP Composite (2) (Bba_E0240.1)
8. GFP Composite (2) (Bba_E0240.1) - Cut
9. GFP Composite (2) (Bba_E0240.2) - Cut
10. GFP (BBa_J52028)
11. GFP  (BBa_J52028) - Cut
12. DNA Ladder
Despite our success with the restriction digest, one question still remains: why did the bands look faint, while the DNA ladder was extremely bright? We later found out that this issue was caused by using DNA ladder without diluting it first. Once we mixed the DNA ladder and water with 1:4 ratio, the bands on the gel fluoresced with the same intensity, allowing us to clearly verify their relative position according to the DNA ladder.
Progressing to the next step, we found numerous problems with the ligation and we then tried to isolate the error sources systematically. We realized that we had ignored the number of base pairs for the insert and vector ratio calculation. This mean that the unexpected band size from the GFP + Terminator composite part could possibly result from bad ligation. I did ligation again with this new formula, but nothing grew. We then tried using the improved calculation method, where the vector mass were kept constant and as close to 50 ng as possible. In the meantime, Margaux successfully did the ligation, which could be verified by the red tinted colonies. From her experiment, we found out that the amount of ligase enzyme did not matter. Kyle also did ligation and found out that two ligation incubation protocols did not yield different result. Nevertheless the yield was extremely small as only 1 or 2 plates show bacterial growth. In addition, there was at most 1 or 2 colonies found on each of those plates.
We then tried to do ligation with different protocol, where the ligation reaction will be incubated in 16 degrees overnight, using the 5 samples prepared with the revised calculation. One of these samples, Bba_R2000_E0240 (Promoter+GFP Composite), underwent ethanol precipitation to increase its concentration. While the concentration of its individual part was very small, ethanol precipitation can create a significantly small sample with high concentration. We expected this approach to allow a better attachment between the sticky parts, even though the small volume prohibit us from mixing the parts based on the previously established ratio. The result were transformed on Sunday and we expected the plates to be ready by next Tuesday.
6/20/2011-6/26/2011
On 6/21, we had the first Computational + Wet Lab joint meeting where everyone presented an update on his/her progress so far. We also talked on what further improvement can be implemented and how to proceed to the next phase of the project. Based on the meeting, we realized the need to figure out how to put more media files into the online notebook, label the gel, and organize a clearer division of labor. I plan to work mostly on part/device creation, especially on part characterization and data entry for the BU Registry. Professor Densmore also mentioned that we should write basic laboratory protocols as future references for new people, verification method to determine if things are working, and troubleshooting method in case the experiment yields unusual result.
But the most important thing that came from the meeting was the new objective: creating 4 biological devices for each fluorescent protein. In order to achieve that, we would like to utilize 2 different approaches. The first one is a 'Bottom Up Approach' where we will continue attaching fluorescent protein gene to terminator, then putting them together with RBS before finally combining the resulting composite part with a promoter. While this method is going to take longer time and require more effort, it will allow us more opportunity in creating a fully customizable plasmid. The second one is a 'Composite Approach' where we will obtain premade composite parts from the IGEM plate and combine them with other part to save time. The advantage from this method is the ability to create a working biological circuit in a shorter steps and reduce any possible chance of error. I plan to work mostly on the second approach, so I will try to combine several types of promoter with composite GFP gene that already has a RBS and a Terminator.
On the day before the meeting, I was actually working on trying to combine a cut RBS with a composite GFP+Terminator part. Using the previously prepared GFP (BBa_J52028) + Terminator (BBa_B0015) composite part, I did restriction digest on them using the enzyme X and P. I predicted that the GFP+Terminator will be cut away from the rest of the backbone so that the gel electrophoresis will produce a ~700 bp fragment (GFP+Terminator) and a ~3000 bp fragment (the backbone). However, the gel did not produce the expected result: while a faint second band was indeed visible, it was too close to the first one, meaning that this band was too big to be a GFP+Terminator fragment. I decided to carry on this work along with the new 'Composite Approach'. I did restriction digest on YFP composite (Bba_E0430), GFP composite (Bba_E0240), promoter (Bba_R2000), terminator (Bba_B0015), and the previously prepared GFP (Bba_J52028) + Terminator (Bba_B0015) part. For some yet to be determined causes, the YFP and GFP composite were not digested properly as no second band was visible. The GFP+Terminator produce a weird result like before.
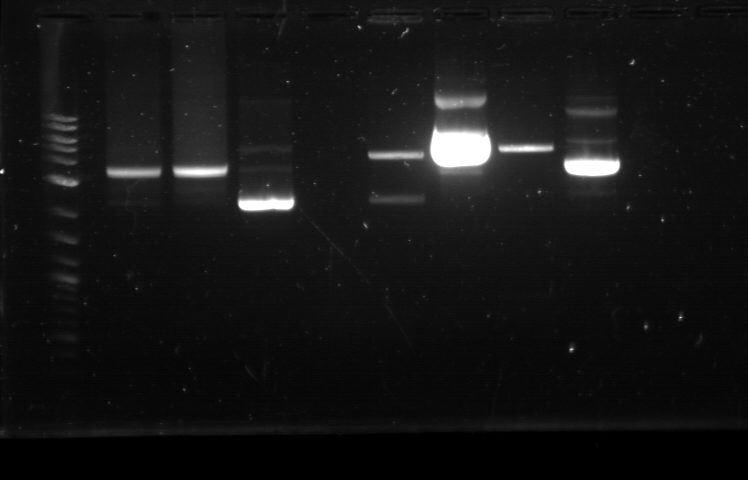
I tried to do the same thing for the second time with larger volume, because Traci told us that the nanodrop quantification result from the extracted gels could be improved by using more sample instead of the constant ~10 uL that we had been using all this time. The pictures of the result can be seen below. We were still unable to see any separated band for the cut YFP and GFP composite part. Some promoters and terminators were successfully cut, but our previously made GFP+Terminator composite parts did not seem to produce the expected band and the same thing happened with the parts that encode fluorescent proteins.
a
Restriction Digest 1:
1. DNA Ladder
2. YFP Composite - Cut
3. YFP Composite - Cut
4. YFP Composite
5. GFP Composite - Cut
6. GFP Composite - Cut
7. GFP Composite
8. Promoter
9. Promoter
10. Promoter
11. Promoter
12. Promoter
13. Terminator - Cut
14. Terminator - Cut
15. Terminator
16. Terminator - Cut
17. Terminator - Cut
18. DNA Ladder
Restriction Digest 2:
1. DNA Ladder
2. GFP+Terminator - Cut
3. GFP+Terminator - Cut
4. GFP+Terminator
5. GFP - Cut
6. BFP - Cut
7. BFP
8. RFP - Cut
9. RFP
10. DNA Ladder
Suma told us that she previously encountered the same problem and she pointed out that there might be problem with the restriction digest. In double digestion, where we cut the plasmid with 2 enzymes simultaneously, buffer 2 was always used since it has the highest activity in all enzymes combinations. But it turns out that this assumption may not be enough, since the website for New England Biolabs states that different combinations need different buffer and digestion time. So I repeated the restriction digest with this method and cut the following biobricks: GFP composite (Bba_E0240) and promoter (Bba_R2000 & Bba_R0040). The digestion time was 2 hours instead of the usual 1 hour in accordance to the optimization recommendation found in the NEB website. The digested plasmids were then kept in the freezer.
6/13/2011-6/19/2011
- GFP + Terminator
The starting materials were GFP (BBa_J52028) and Terminator (BBa_B0015). Each of these biobrick underwent restriction digest to cut out the necessary part. Because the GFP gene is large enough to be separated in gel electrophoresis, it was cut out from the backbone with EcoRi and SpeI. In contrast, the terminator is too small for gel separation so it was not separated from the backbone. Instead, the backbone was cut with EcoRI and XbaI. For the first time, the gel electrophoresis yielded visible results where the cut biobrick plasmid appeared as two bands (the cut region and the leftover). Nanodrop quantification showed that the DNA concentration for each sample was very small as it was between 2-3 ng/uL. The GFP gene and the backbone, which contains the terminator, were combined through ligation reaction.
Throughout these processes, three ligation reactions were made and thus three petri dishes were prepared for each of them. The backbone used here also contains genes that encode for both kanamycin and ampicillin resistance, so petri dishes with either antibiotic can be used for transformation. But since there had been problems with the ampicillin plate where it did not selectively inhibit the bacteria that were not transformed (this was known when the negative control in other experiment yielded positive result), kanamycin petri dishes were used. On the next day, only one out of the three dishes contained bacteria cultures (there were 4 cultures, to be exact). Plasmid prep was done and 12 hours later, the opaqueness from each tube showed that a good number of bacteria amplification had taken place. No string-like substance was found at the end of the pipet tip in each tube. Miniprep was done and the results were: 48.4 ng/uL, 260/280: 1.80, 260/230: 0.89 (composite part 1) and 14.7 ng/uL, 260/280: 1.76, 260/230: 0.91 (composite part 2). The plasmids were kept in the -20C freezer and the corresponding plasmid preps had glycerol added before being stored in 2 places.
- Isolated Parts
From the recently arrived spring 2011 IGEM plate, the following parts were isolated: Bba_E0430 (RBS+YFP+Promoter), Bba_E0240 (RBS+GFP+Promoter), Bba_R2000 (Promoter that works best with the previous composite parts), Bba_E0020 (ECFP), Bba_E0032 (EYFP), and Bba_K156010 (BFP).
- Miscellaneous
TAE buffer was prepared from the 50X TAE stock. Approximately 40 LB+Ampicillin agar plates were made because many of the parts contained gene that encode for Ampicillin resistance. Almost all used glasswares were autoclaved and kept for future use. Lab bench was cleaned with 70% ethanol and paper towel. QIAcube was received for demo and would stay for approximately one week from Tuesday (6/14).
6/6/2011-6/10/2011
- BFP2
Plasmid prep were created from the BFP2 culture plate and incubated for approximately 16 hours for plasmid amplification. The resulting plasmids were isolated by miniprep and quantified with nanodrop. The DNA concentration in the two samples are 16.5 ng/uL and 14.9 ng/uL, respectively. While such values are below the normally acceptable range of 20 and above, we still run electrophoresis on them. No band was detected in the gel.
- Pbad
Pbad promoter biobrick was obtained from the spring 2010 IGEM plate, and transformed into E. coli bacteria. The bacteria were then plated onto agar-based LB+Ampicillin growth medium. Lots of cultures were found on the next day after the overnight transformation. Instead of uniform appearance, however, each plate was composed of both dark or light colonies. Plasmid prep was done for each of the color type (pipet tip was used instead of metal loop) and each tube was incubated for 12 hours. On the next morning, the tip in each tube was found to contain a spiral, string-like thing and most of the plasmid preps were not opaque. After the miniprep, each of the plasmid was quantified with nanodrop. Their respective concentrations were 10.0 ng/uL and 8.3 ng/uL. They were also found to be free from contaminants (based on the 260/280 and 260/230 values). But none of the samples appeared on the gel after electrophoresis.
In order to understand the problem that had been plaguing our work, we went to a biology lab to view the plasmid preps under compound microscope and conduct gram staining analysis. All plasmid preps seemed to be contaminated with either another type of bacteria (due to differences in shape and size) or unidentified string-like compound. Many of the plasmid preps contain purple-colored bacteria, even though E. coli bacteria are supposed to be pink since they are gram-negative.
Based on these observations, we plan to improve on the lab cleanliness and avoid contamination. One important decision here was to autoclaved all of the pipet. This was done not only to avoid the possibility of contamination in daily experiments but also to ensure that the plasmid preps will properly amplify the plasmid-containing bacteria.
 "
"
