Team:Peking S/project/wire/harvest
From 2011.igem.org
Template:Https://2011.igem.org/Team:Peking S/bannerhidden Template:Https://2011.igem.org/Team:Peking S/back2
Template:Https://2011.igem.org/Team:Peking S/bannerhidden

Chemical Wire Toolbox
Introduction|Harvesting ‘Chemical Wires’ From Nature|Synthesizing Quorum Sensing Inverters|Orthogonal Activating Matrix
Harvesting ‘Chemical Wires’ From Nature
Contents |
Introduction
Multicellular strategy provides us a visa to constructing a complex gene network. During gene network constructing, as genetic network scaling up, more cells are involved in compartmentalizing genetic network. Natural quorum sensing and small chemical molecule generator and receiver systems provide an excellent pool for developing ‘chemical wire’ toolbox. Unfortunately, naturally existed and well-characterized cell-cell communication systems are far from sufficient. So harvesting ‘chemical wires’ from the nature is a fast and affordable way for the toolbox development.
Many signaling molecules could serve as candidates of synthetic consortia ‘chemical wire’, but not all of them perform well when applied to microbial chassis. One of the most significant problems is that they are difficult to be synthesized or perceived when chemical molecule generating or receiving mechanism is too complex to engineer. Besides, threshold, response time and coordination of receiver cell performance should also be considered during chemical wire toolbox candidate selection. Because only chemical signaling molecules with low threshold, fast response speed and highly synchronized coordination response deserve to be candidates.
According to the criteria above, in our project two signal generator and receiver systems were selected. One employs auto-inducer N-(3-hydroxy-7-cis-tetradecenoyl)-L-homoserine lactone (3OH-C14:1-HSL), as the signal molecule (Figure 1). The other system employs Salicylate (Figure 2). In order to confirm their usability in practical application, we designed experiment including three aspects of the systems, namely dose response, time dependence and coordination.
Cin system
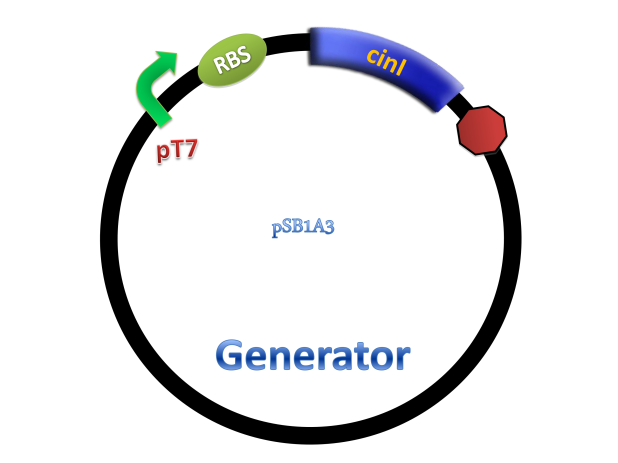
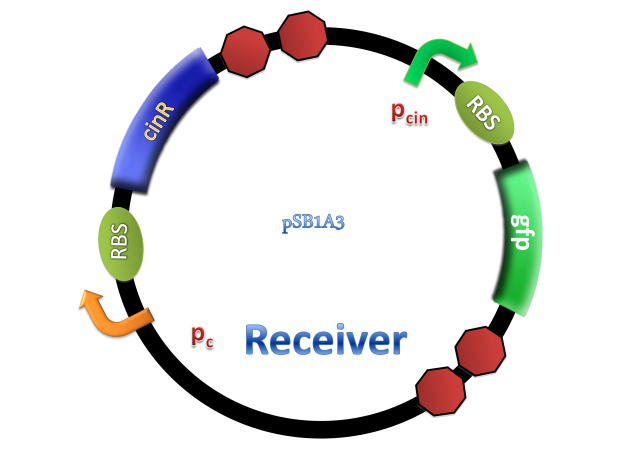
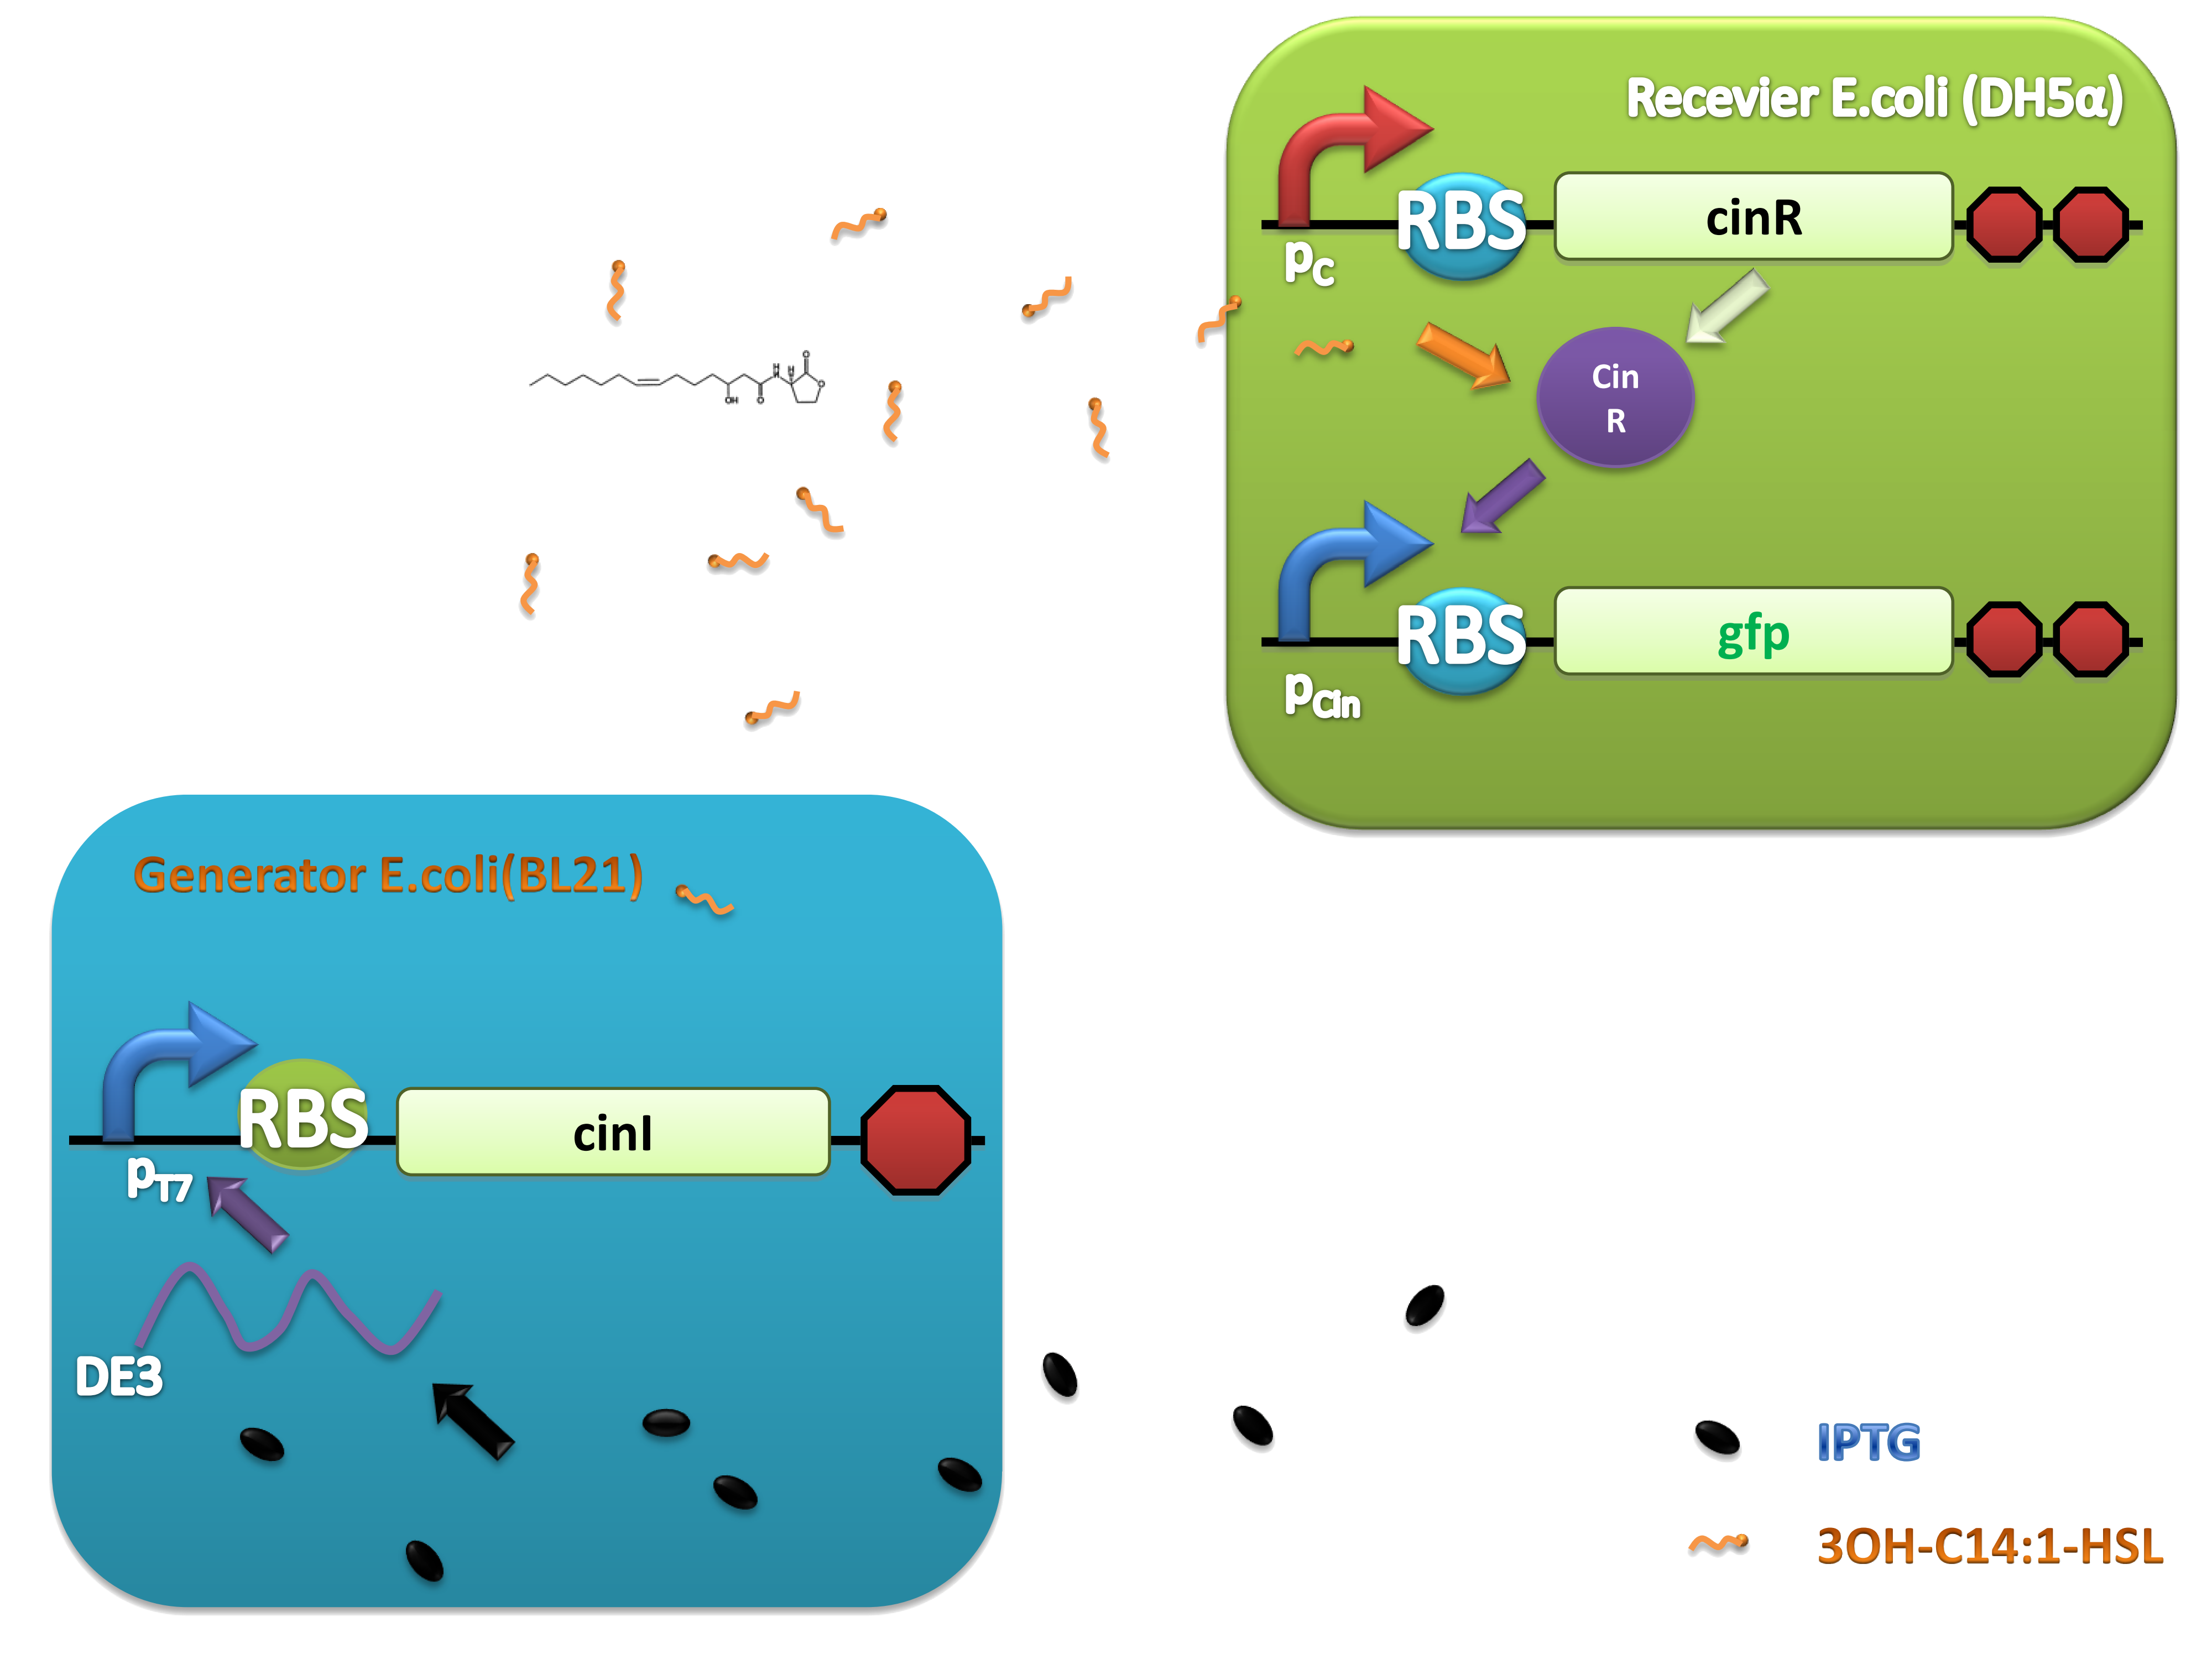
This system was derived from Rhizobium leguminosarum which are Gram-negative soil bacteria living in symbiotic association with legumes by forming nodules. In this system, cinI, pcin, cinR are core elements. CinI is a typical LuxI-type synthase, synthesizing 3OH-C14:1-HSL and cinR is a LuxR-type transcriptional regulator to sense this molecules. Pcin will be turned on by CinR binding together with 3OH-C14:1-HSL.
Naturally existing and simple mechanism make Cin system a promising candidate.

Experiments were conducted to verify its validness. Firstly we constructed two plasmids as 3OH-C14:1-HSL generator and receiver devices (Figure 2). Then dose response, ,time dependence and coordination experiments were performed.
(C)
Figure 2. Architecture of cin system and schematic of generator and receiver system. (A) Autoinducer generator plasmid. (B) Autoinducer receiver system plasmid. This plasmid contains 3 core parts: constitutively expressed cinR, protein CinR binding promoter pcin and CinR activated gfp. (C) Operation of experiment system.
Salicylate system
Some microorganisms can degrade salicylate and the mechanism has been studied extensively in Pseudomonas putida. Interestingly, there is a bacterium species named Pseudomonas aeruginosa which can synthesize salicylate. These two bacteria strains provide the possibility of constructing an artificial quorum sensing system.
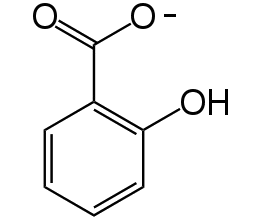
Figure 3. Chemical structure of salicylate
1. Salicylate operon has a broad concentration response curve
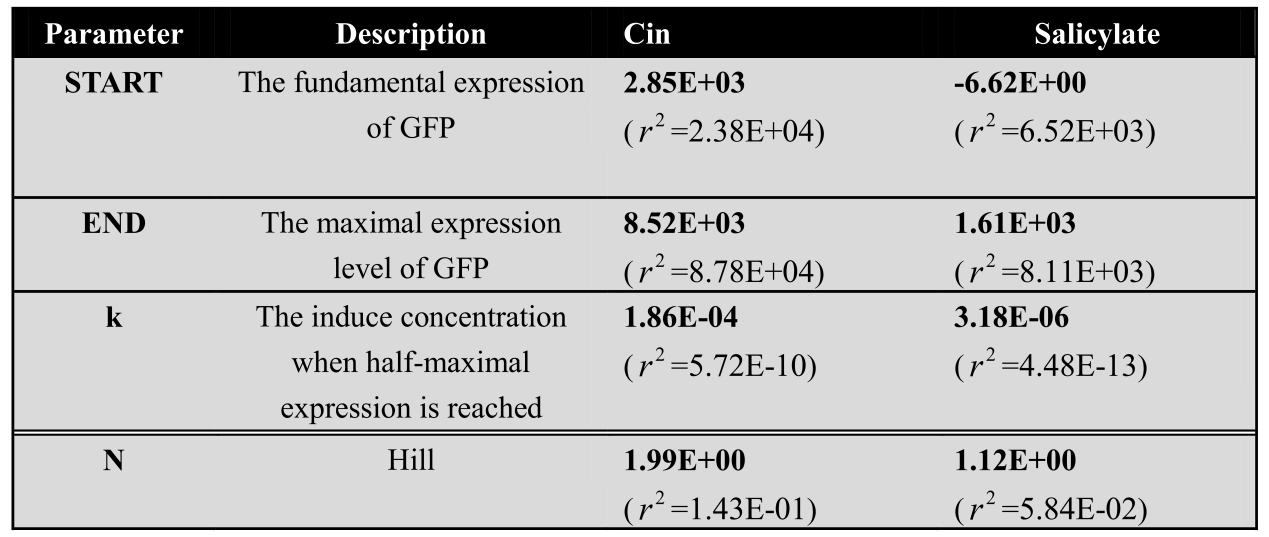
We found that salicylate sensor NahR is able to response to salicylate among a wide concentration range. When induced with high concentration of salicylate, for instance, 10^-3M, the gene of interest regulated by pSal promoter will be dramatically expressed, while NahR could still sense salicylate even as low as 10^-6M.
2. Salicylate would not cause huge burden on the cell metabolism
As a chemical wire, salicylate has small molar mass and simple chemical structure. The synthesis pathway of salicylate only involves two genes. As a result, metabolic burden will not be a hurdle when using salicylate as artificial quorum sensing molecules.
3. Salicylate has a unique chemical feature making it more stable
Benzene ring and carboxyl make salicylate more stable than other quorum-sensing small molecules. In order to characterize the system, generator device and receiver device were transformed into different strains. Generator device plasmid consists of lac promoter upstream and pchBA gene downstream, so salicylate will be synthesized in the presence of IPTG.
PchBA which locates in generator plasmid encodes an isochorismate pyruvate-lyase and an isochorismate synthase derived from Pseudomonas aeruginosa. PchA, an isochorismate synthase, catalyzes the conversion of chorismate to isochorismate. The enzyme PchB, catalyzes the conversion of isochorismate to salicylate.
NahR is a polypeptide which plays an important role in salicylate operon. The polypeptide can exerts its salicylate-dependent activation sal operon by interacting with the promoter sequence in the region of -83 to -45 base pairs before the transcription start site. Binding of the inducer to the central domain of NahR is thought to cause additional interactions of NahR with sequences near the -35 and DNA bending, both of which promote transcriptional activation, therefore, so if there are no salicylate in the liquid nutrient medium, NahR will not binding on the promoter and lead to RNA ploymerase can not work normally, otherwise, transcription will be actived and downstream of the promoter will be transcripted, in our case, GFP will be expressed.
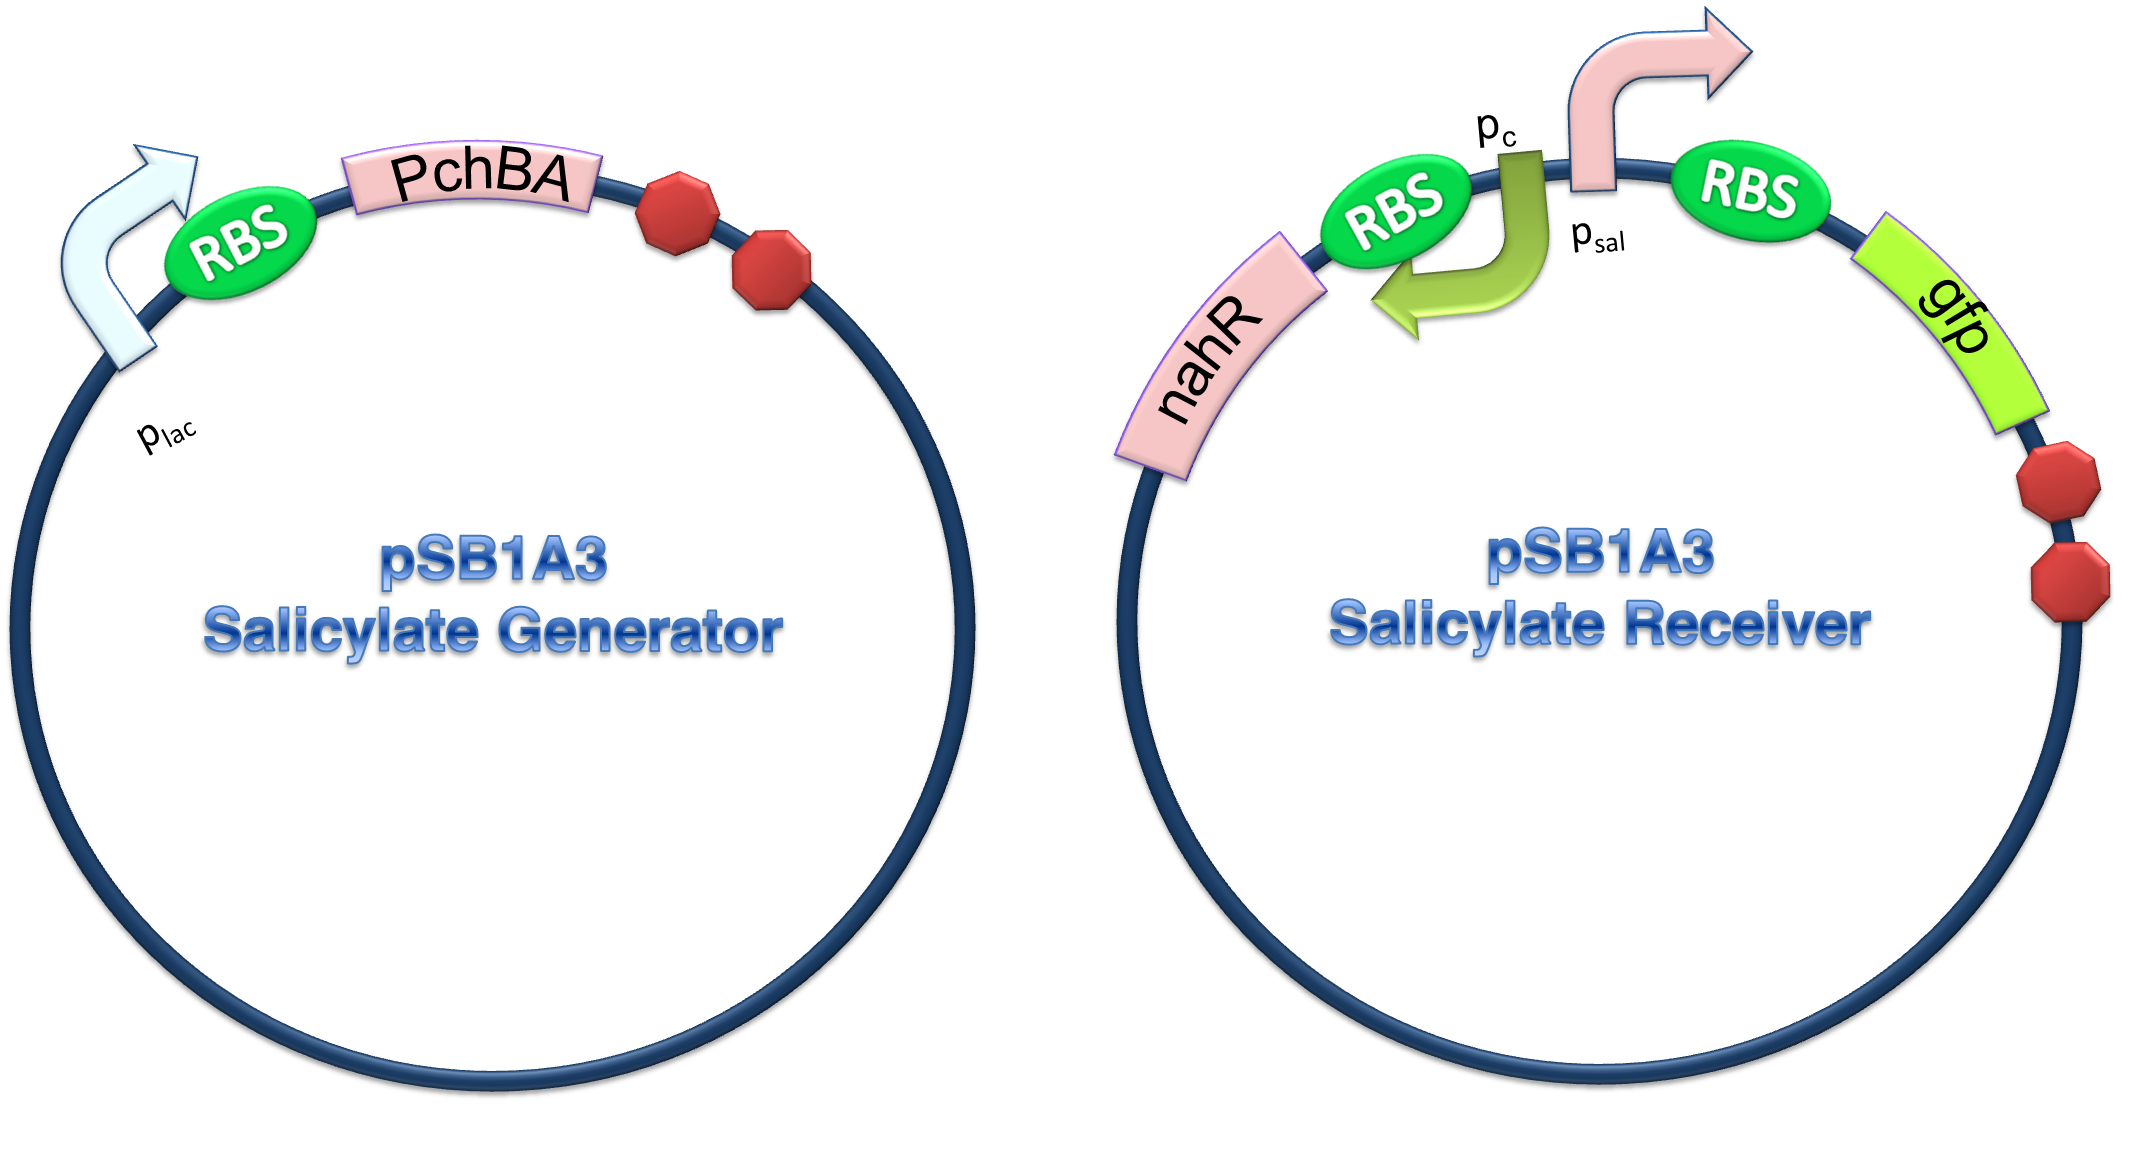
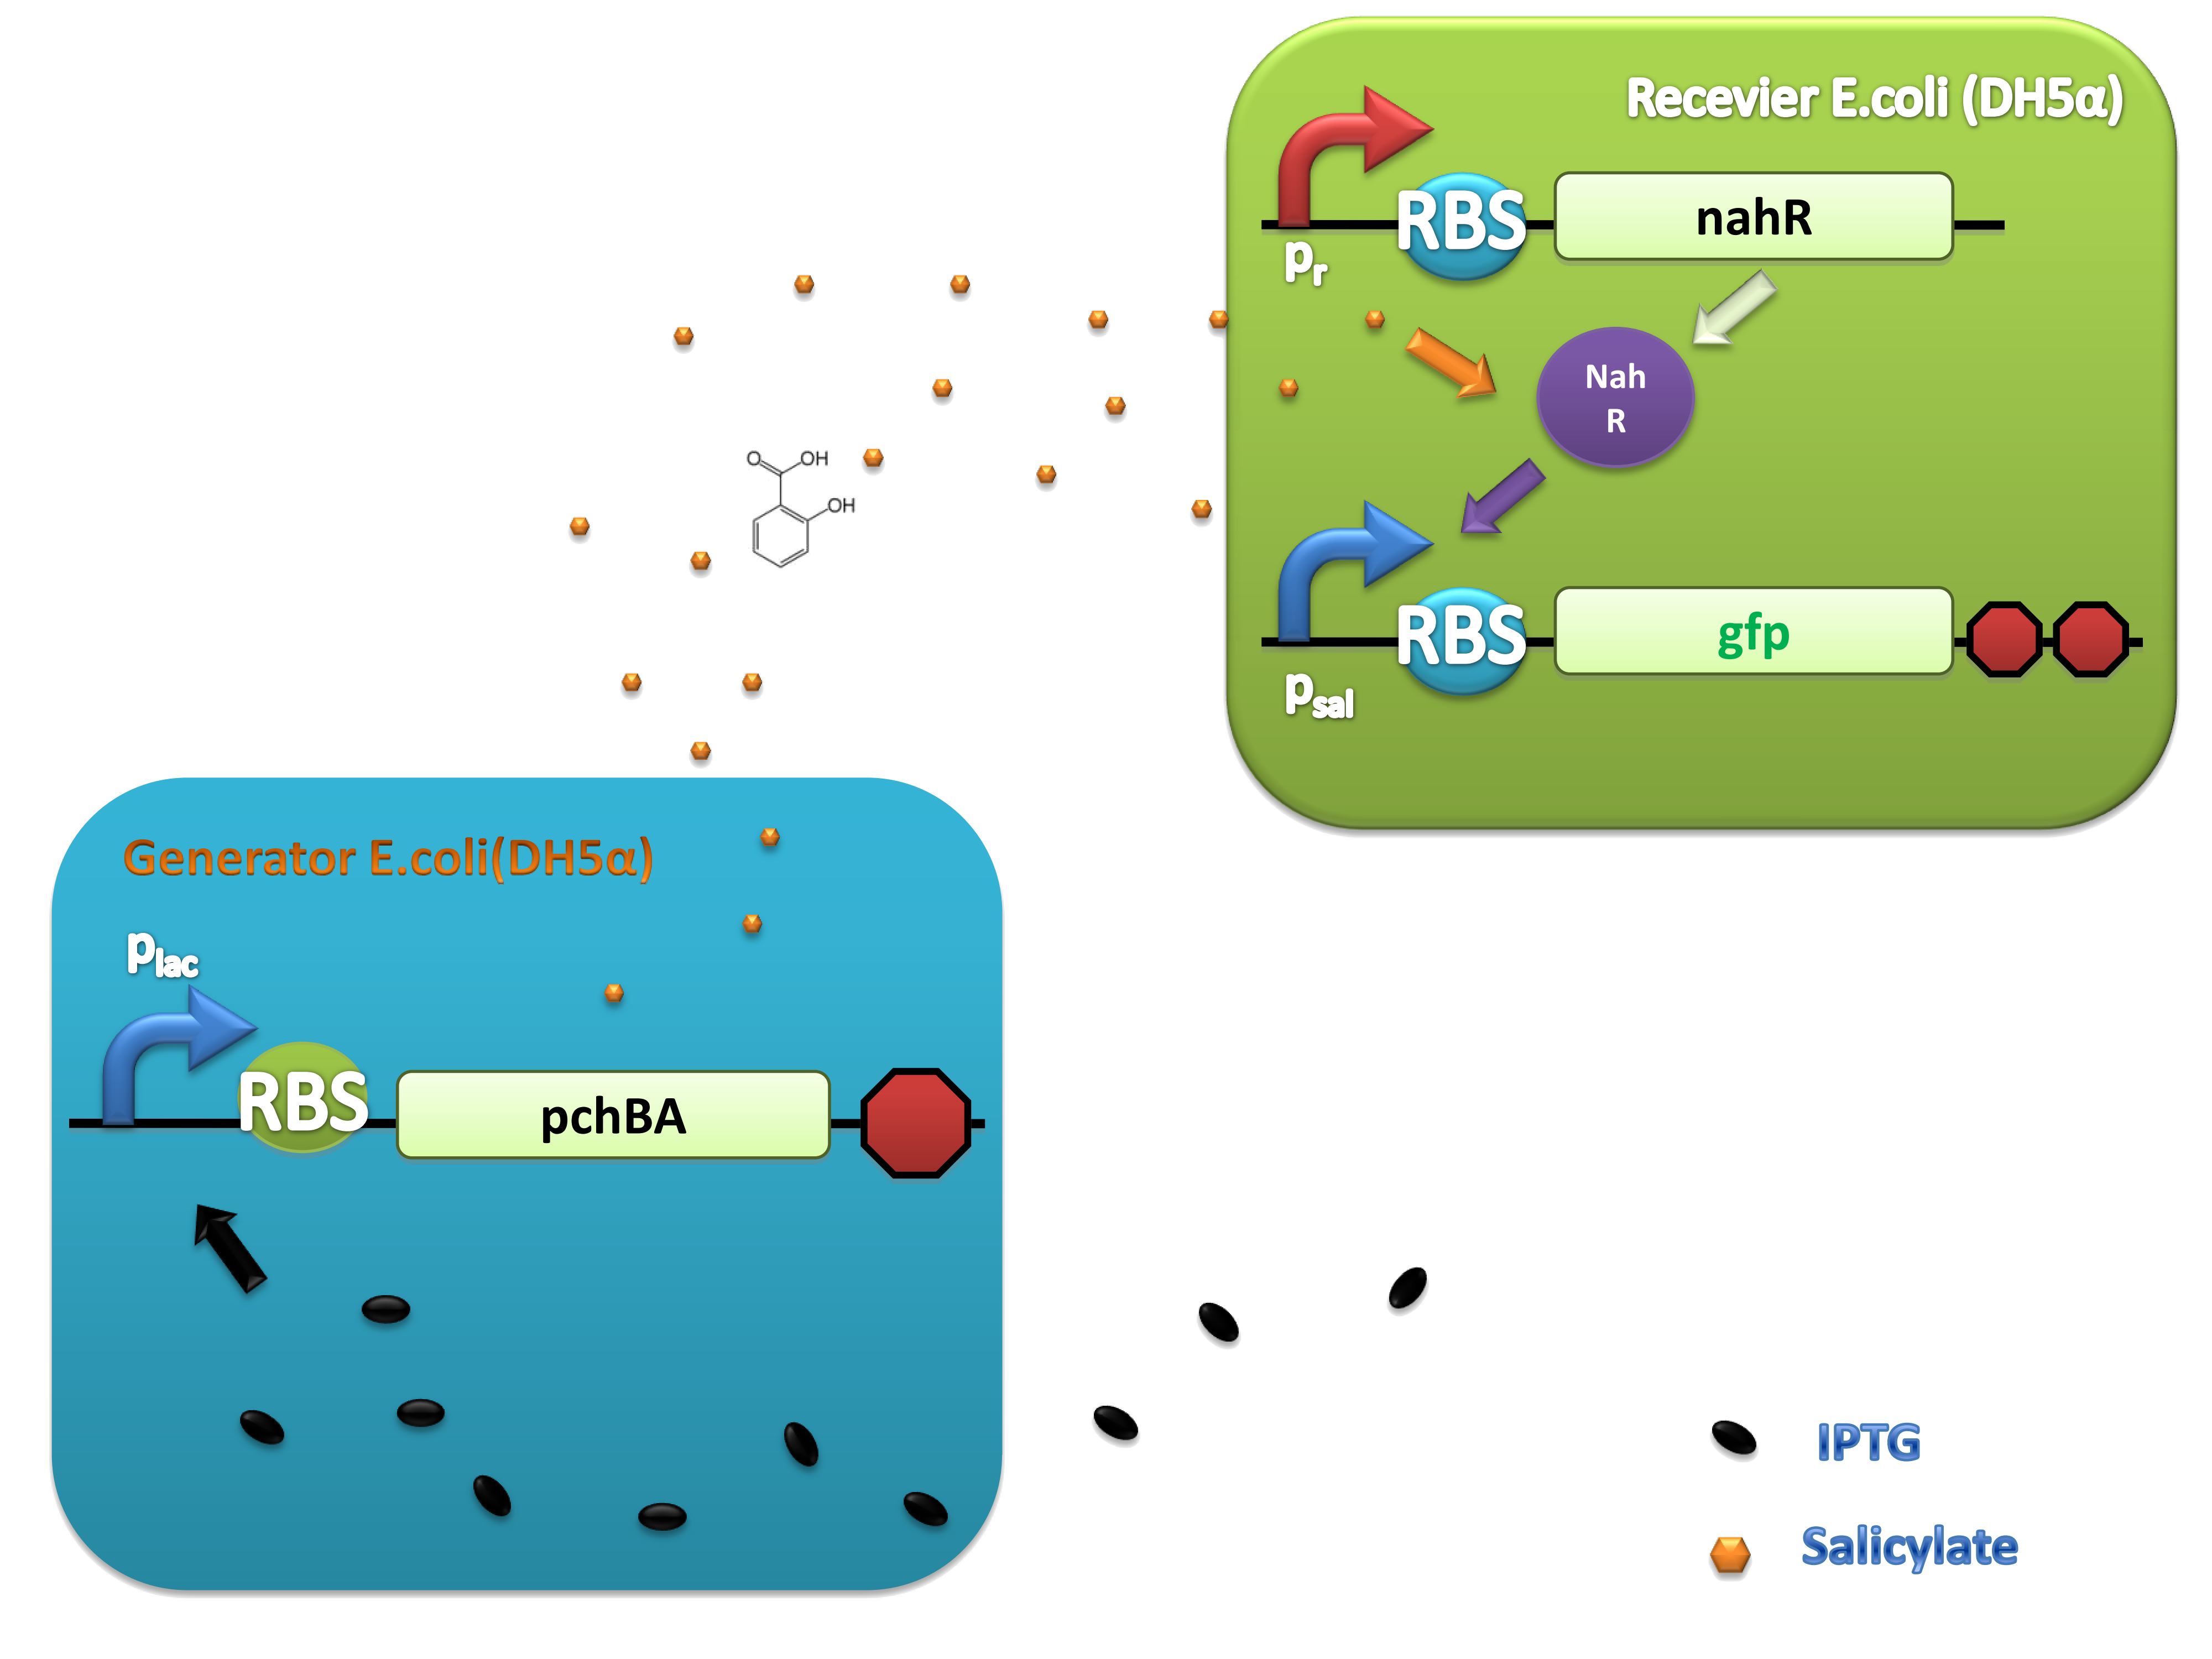
(C)
Figure 4. Scheme of salicylate system plasmids and mechanism of generator and receiver system. (A) Autoinducer generator plasmid. Core elements are plac promoter, protein binding site(RBS) B0034 and autoinducer synthase gene pchA and pchB. (B) Autoinducer receiver system plasmid. This plasmid contains 3 core parts:NahR, salicylate promoter psal and sal activated gfp. (C) mechanism of experiment system. IPTG with the help of lacI could induce the expression of Protein PchA,PchB. Then they synthesize the autoinducer. In receiver system the autoinducer binds to its receiver protein CinR and the complex actived GFP expression.
Results
Salicylate Testing experiment
In order to comfirm the system work or not. We put generator and recevier cultivate together for 3 hours, then centrifuged cells and resuspended them in phosphate buffer solution (PBS)(Figure.5). Experment result testify salicylate system work.
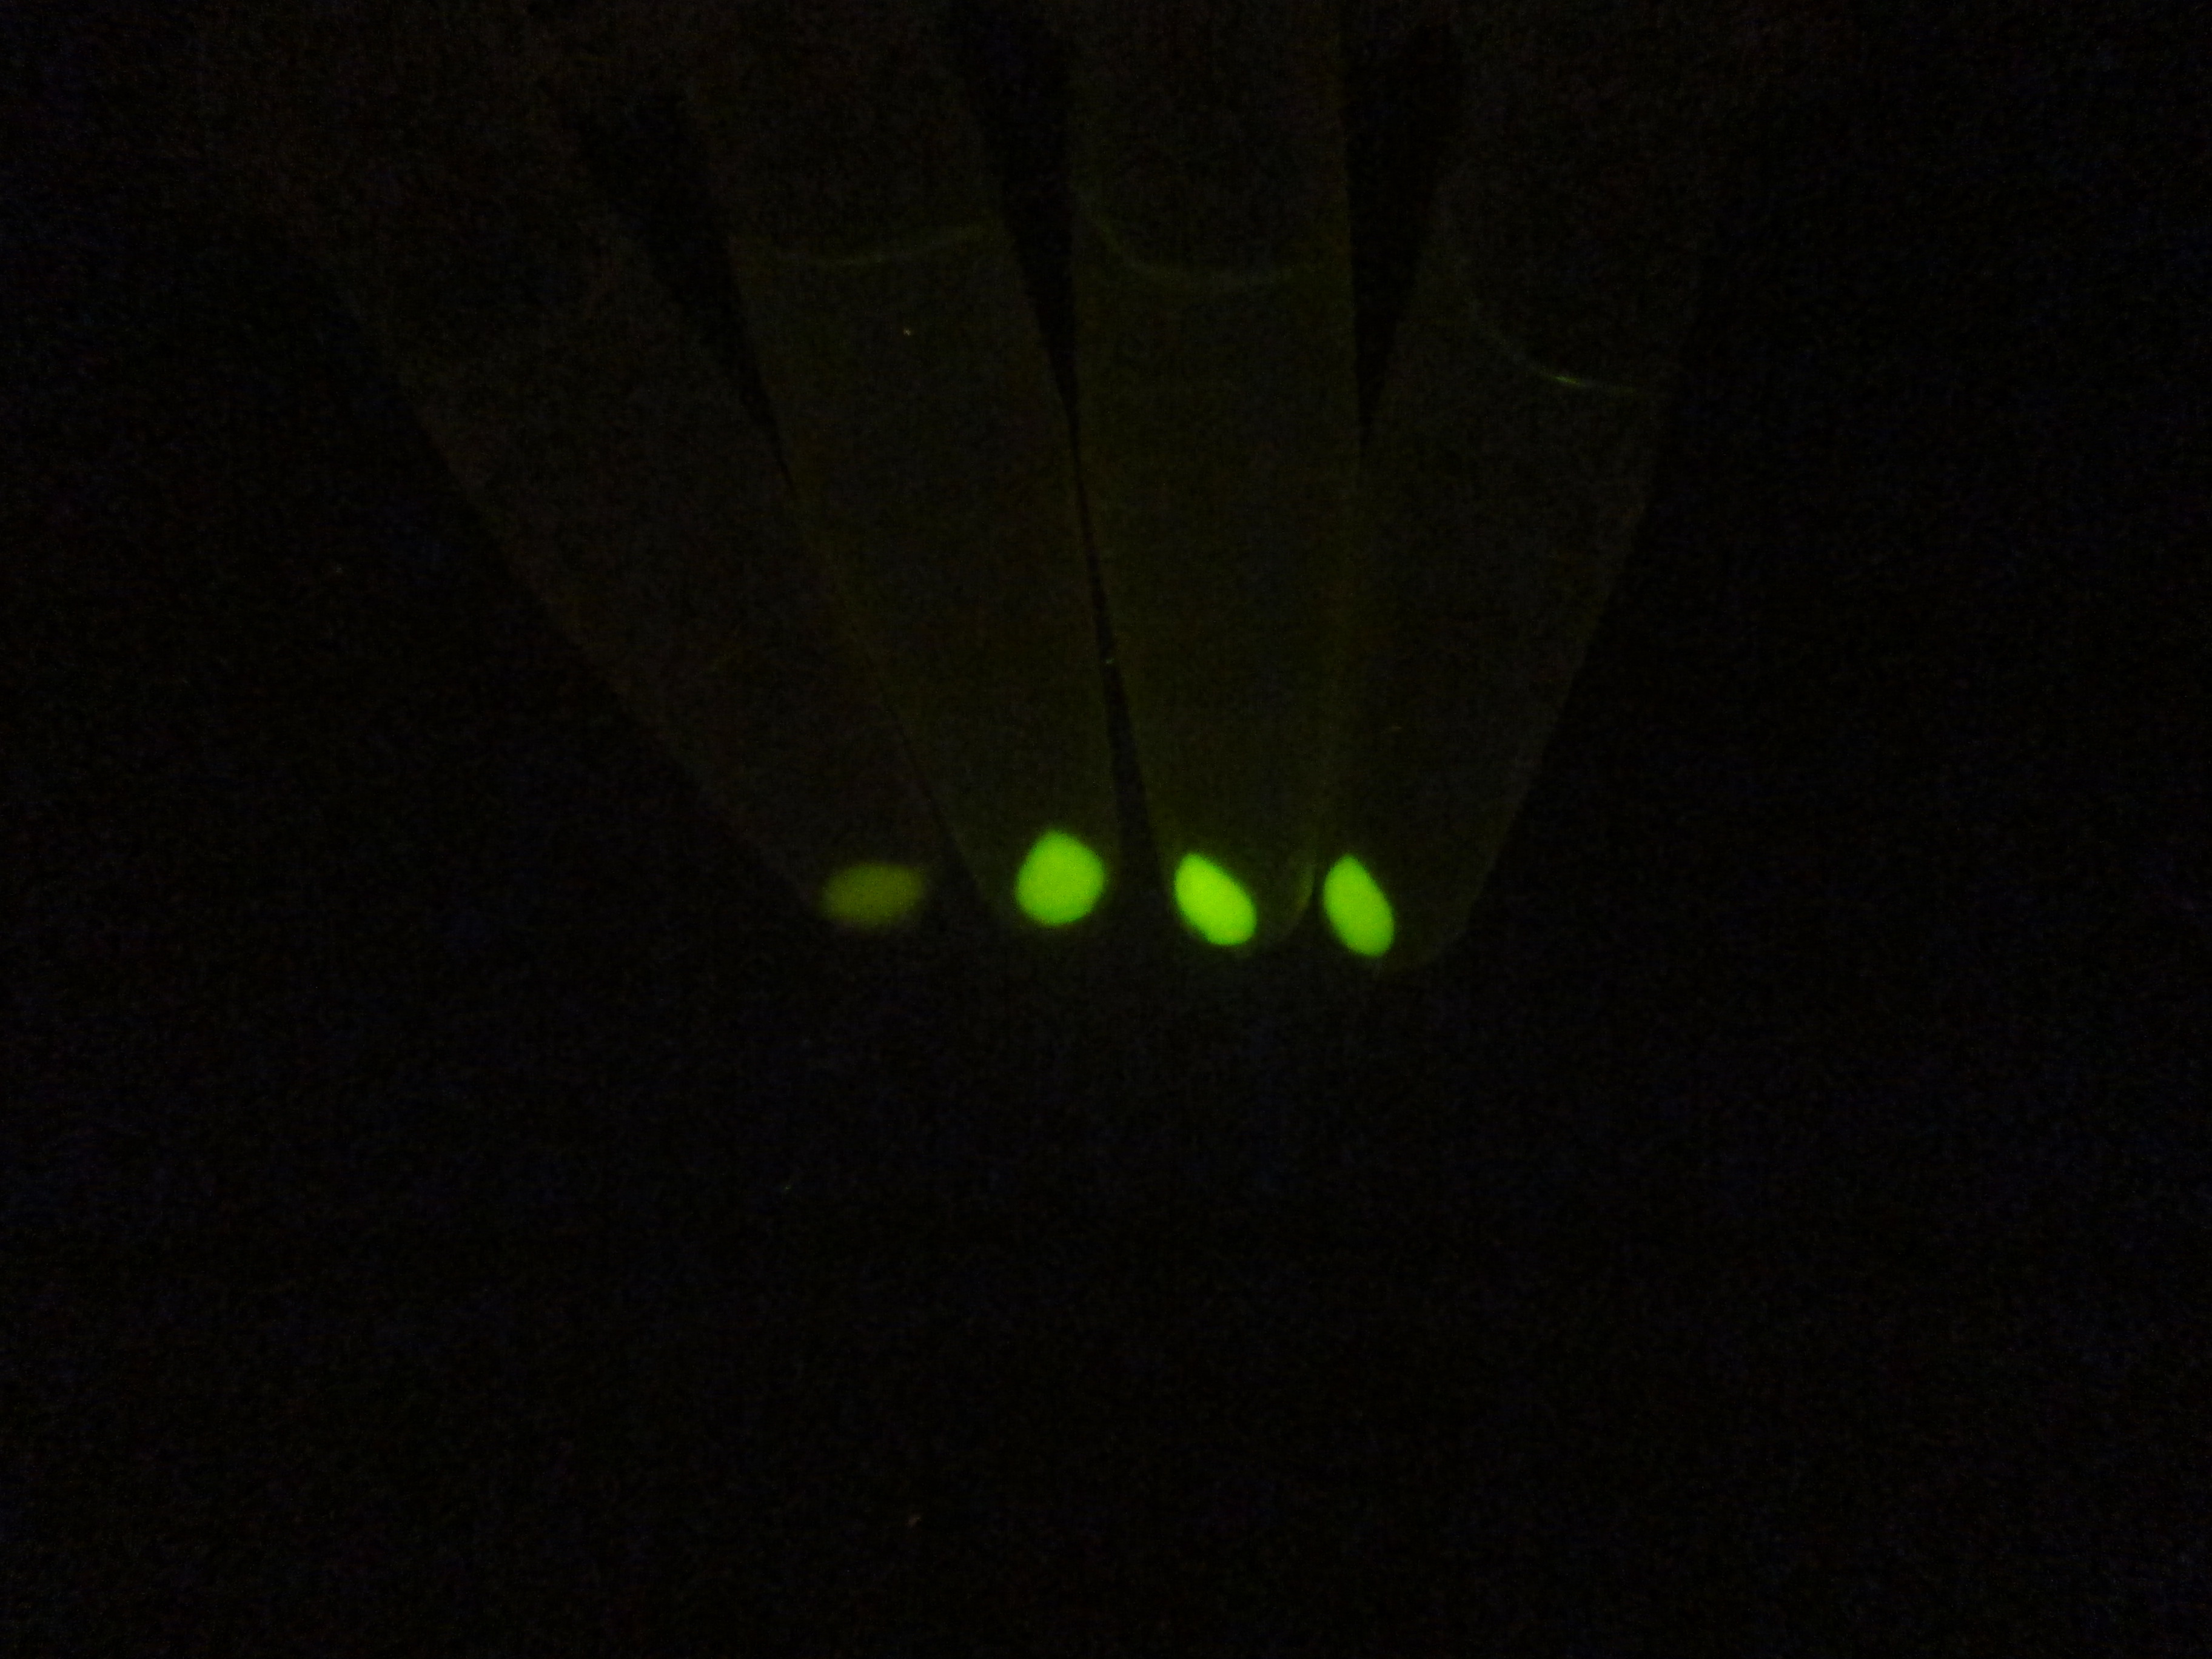
Figure 5. Salicylate verify experiment result. The tube on the left side is control and three tube on the right is tube that mix of generator and recevier.
Dose Response
cin system
First, we induced generator cell with 10-3M IPTG for 16 hours, then centrifuged cells and collect the supernatant. We use this supernatant as original 3OH-C14:1-HSL solution,then we diluted it to 10-7, 5×10⁻⁷, 10-6, 5×10⁻⁶, 10-5, 6×10⁻⁵, 8×10⁻⁵, 10-4, 2×10⁻⁴, 4×10⁻⁴, 7×10⁻⁴, 10-3, 3×10⁻³, 6×10⁻³, 8×10⁻³, 10-2 of original solution concentration respectively. Using these diluted supernatants to induce receiver cells (OD600 0.4) at 37℃ for 3 hours, then centrifuged cells and resuspended in PBS. The GFP fluorescence of each culture was obtained using enzyme-labeled assay. The result is shown in figure 6.

Figure 6. Dose Response Curve. Vertical axis RFU/OD represents GFP expression measured through enzyme-labeled assay and the Horizontal axis represent different relative dilution concentration of 3OH-C14:1-HSL. Data was fitted with Hill function.
salicylate system
We cultivate the recevier E.coli until the OD up to 0.4 and add salicylateinto 16 EP tube containing aforementioned E.coli respectively. Different concentration of salicylate solution will be added, that is 10-7 M, 10-6 M, 5×10⁻⁶ M, 10-5 M, 2.5×10⁻⁵ M, 5×10⁻⁵ M, 7.5×10⁻⁵ M, 10-4 M, 2.5×10⁻⁴ M, 5×10⁻⁴ M, 7.5×10⁻⁴ M, 10-3 M. Cultivate the cell for 3 hours at 37℃. Then centrifuged cells and resuspended in phosphate buffer solution (PBS). The GFP fluorescence of each culture was obtained using FCM(flow cytometry). The result is shown in figure 7.
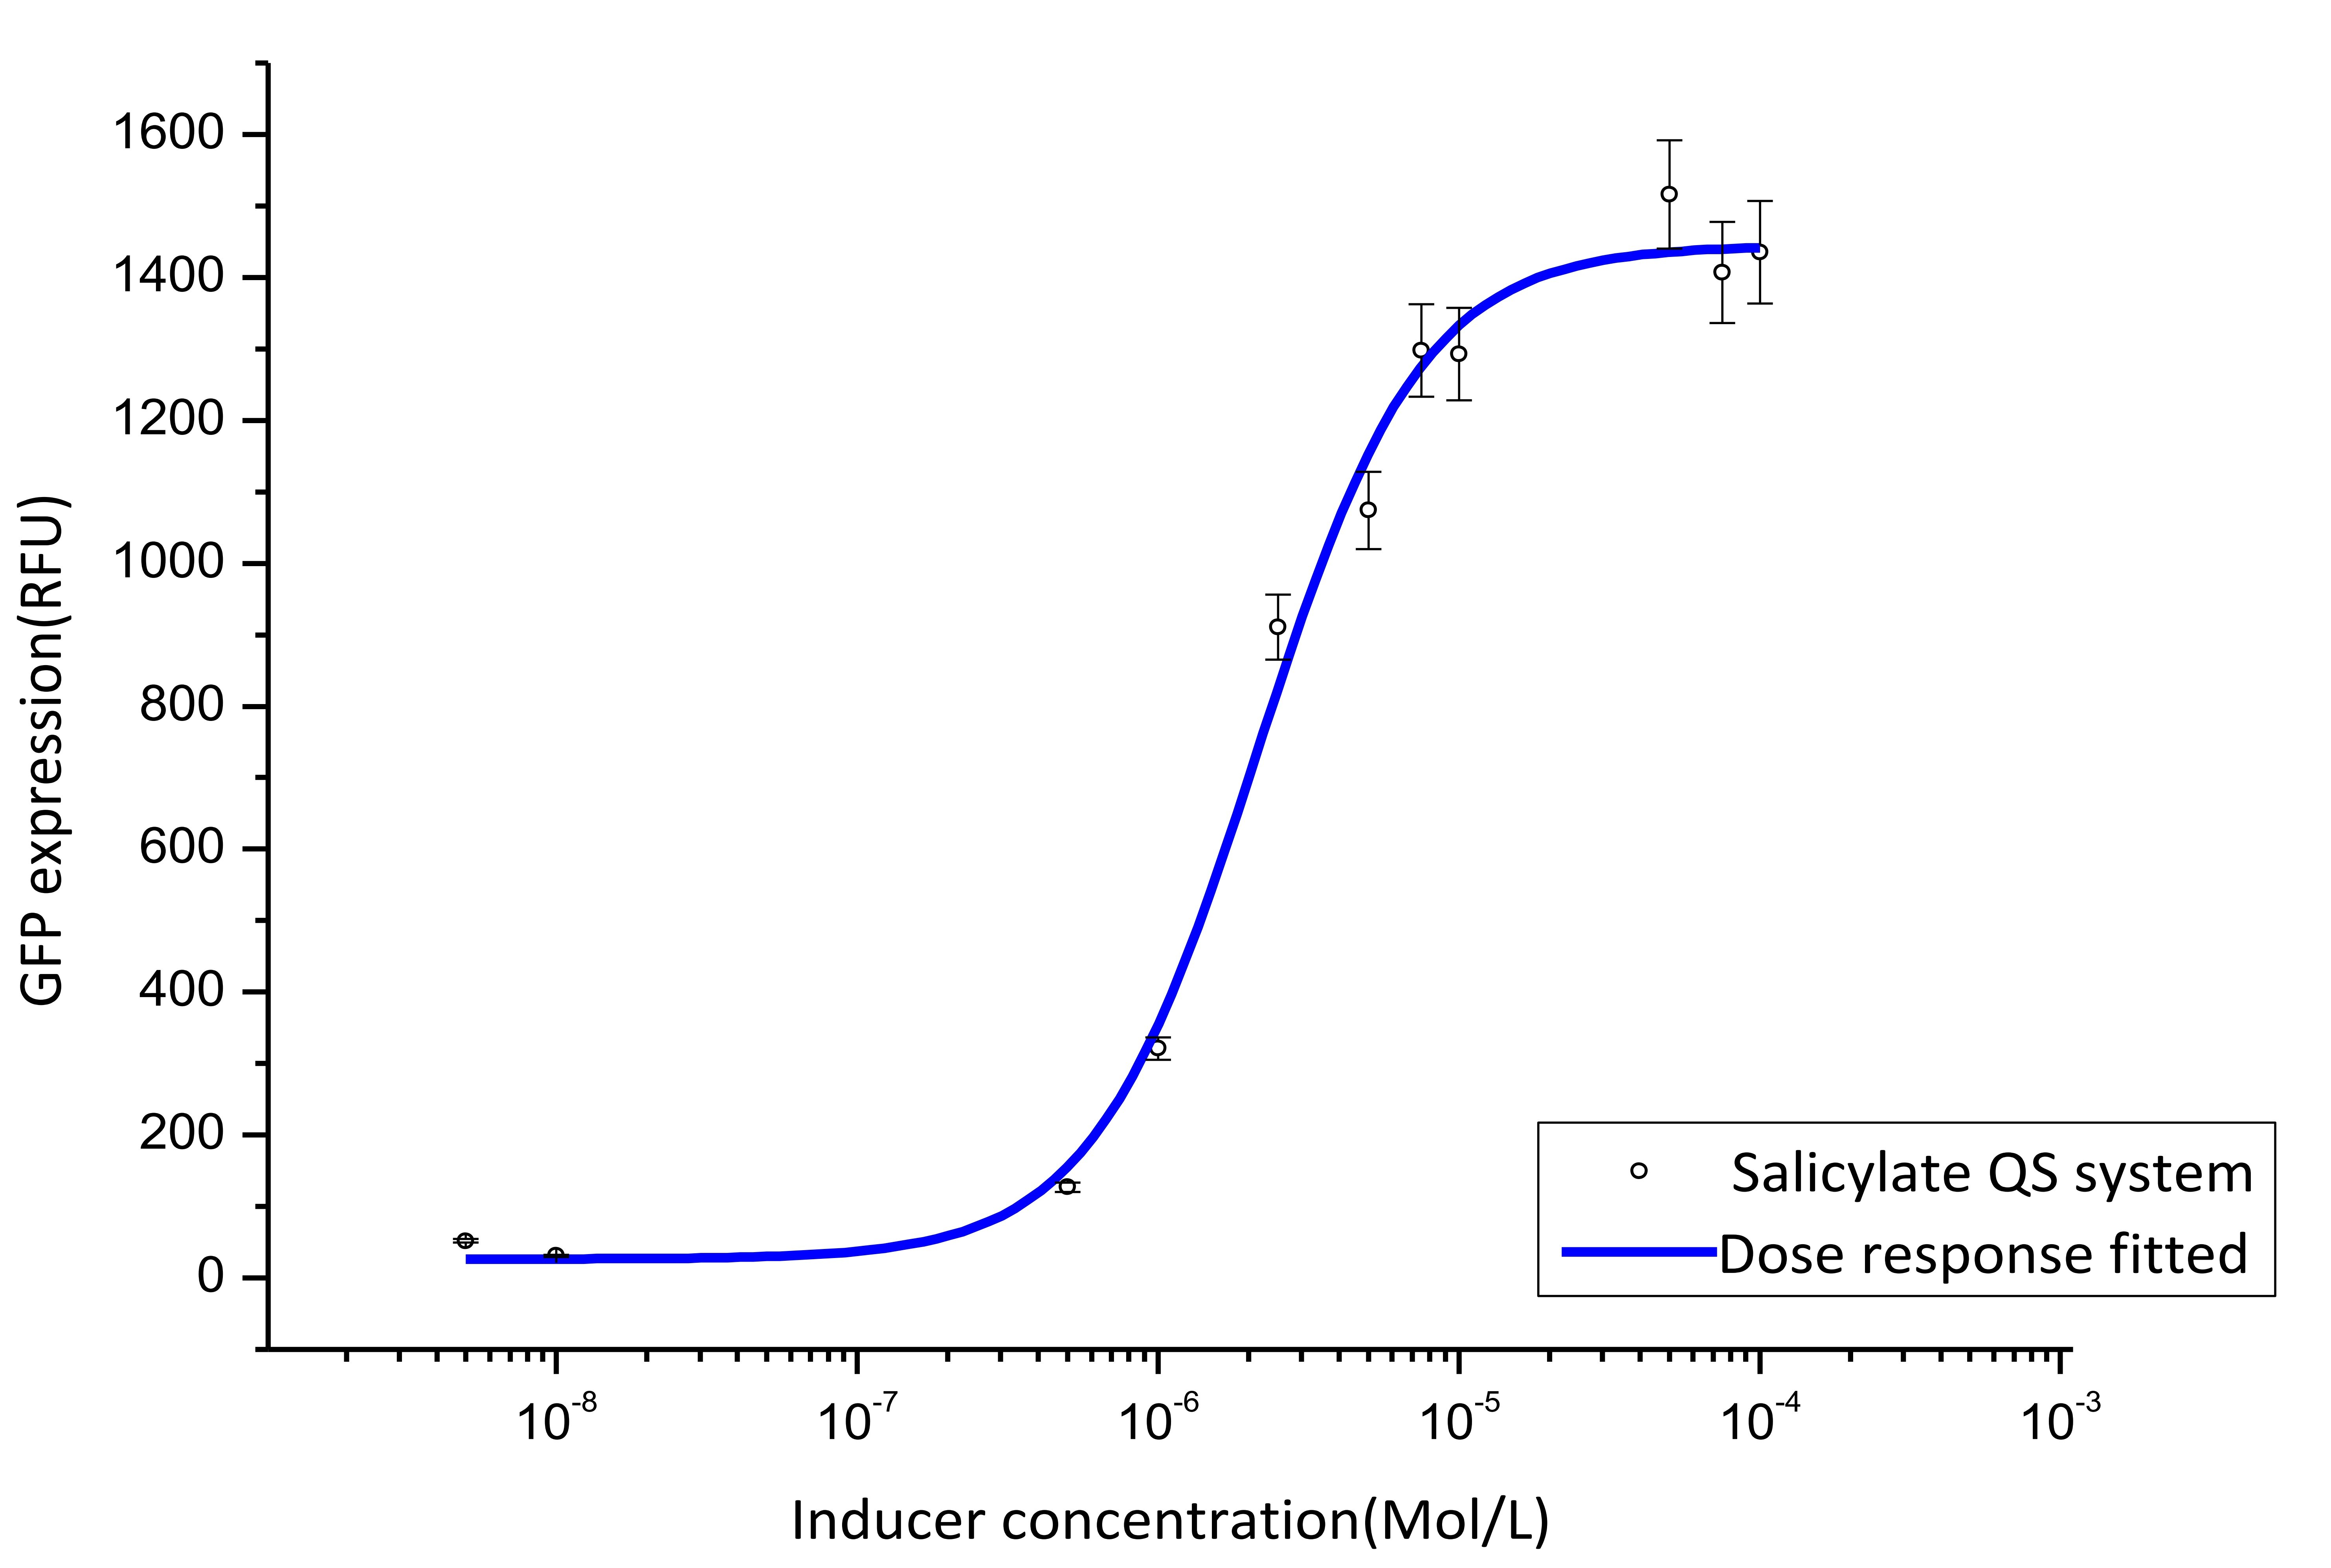
Figure 7. Dose response curve. Horizontal axis represents GFP expression measured by flow cytometry and the vertical axis represen different salicylate concentration. Data was fitted with Hill function.
Time Dependence
cin system
We induced E.coli with receiver plasmid using supernatant diluted 10-2 times, and measure OD and absorbance of GFP every 15 minutes.
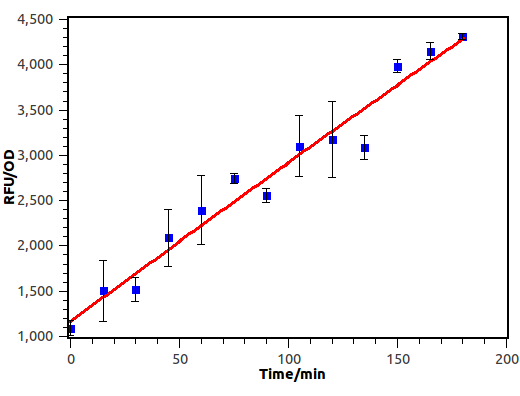
Figure 9. Time response curve of cin receiver system. We measured RFU and OD600 every 15 minutes and experiment performed in 3 hours.
salicylate system
We cultivate the recevier E.coli until its OD up to 0.4. Afterward, add salicylate into the liquid medium and salicylate ultimate concentration is 10-4 M, at last the gfp expression level of different length will be measured by FCM(flow cytometry), delta time is 15 min or 30 min between each sample.
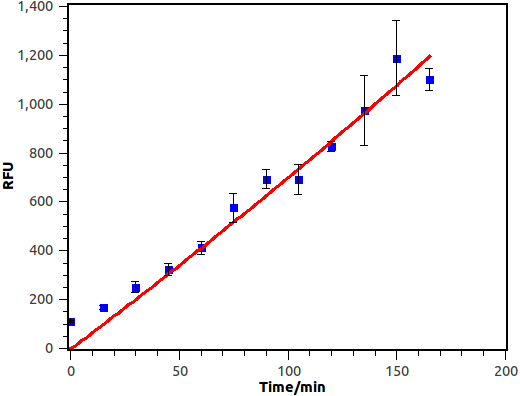
Figure 10. Time response curve of salicylate recevier. Horizontal axis represent time while the vertical axis represent average fluorescence intensity measured by flow cytometry.

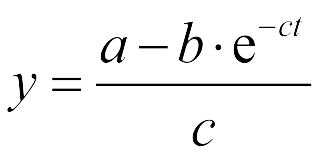
The Fluorescence intensity X obeys: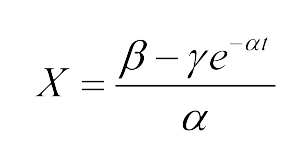
Coordinatiblity
We induced cin and salicylate cell with Dose Response experiment method. We collect the resuspended and measured FITC-A with flow cytometry. Result as Figure 10 shows.
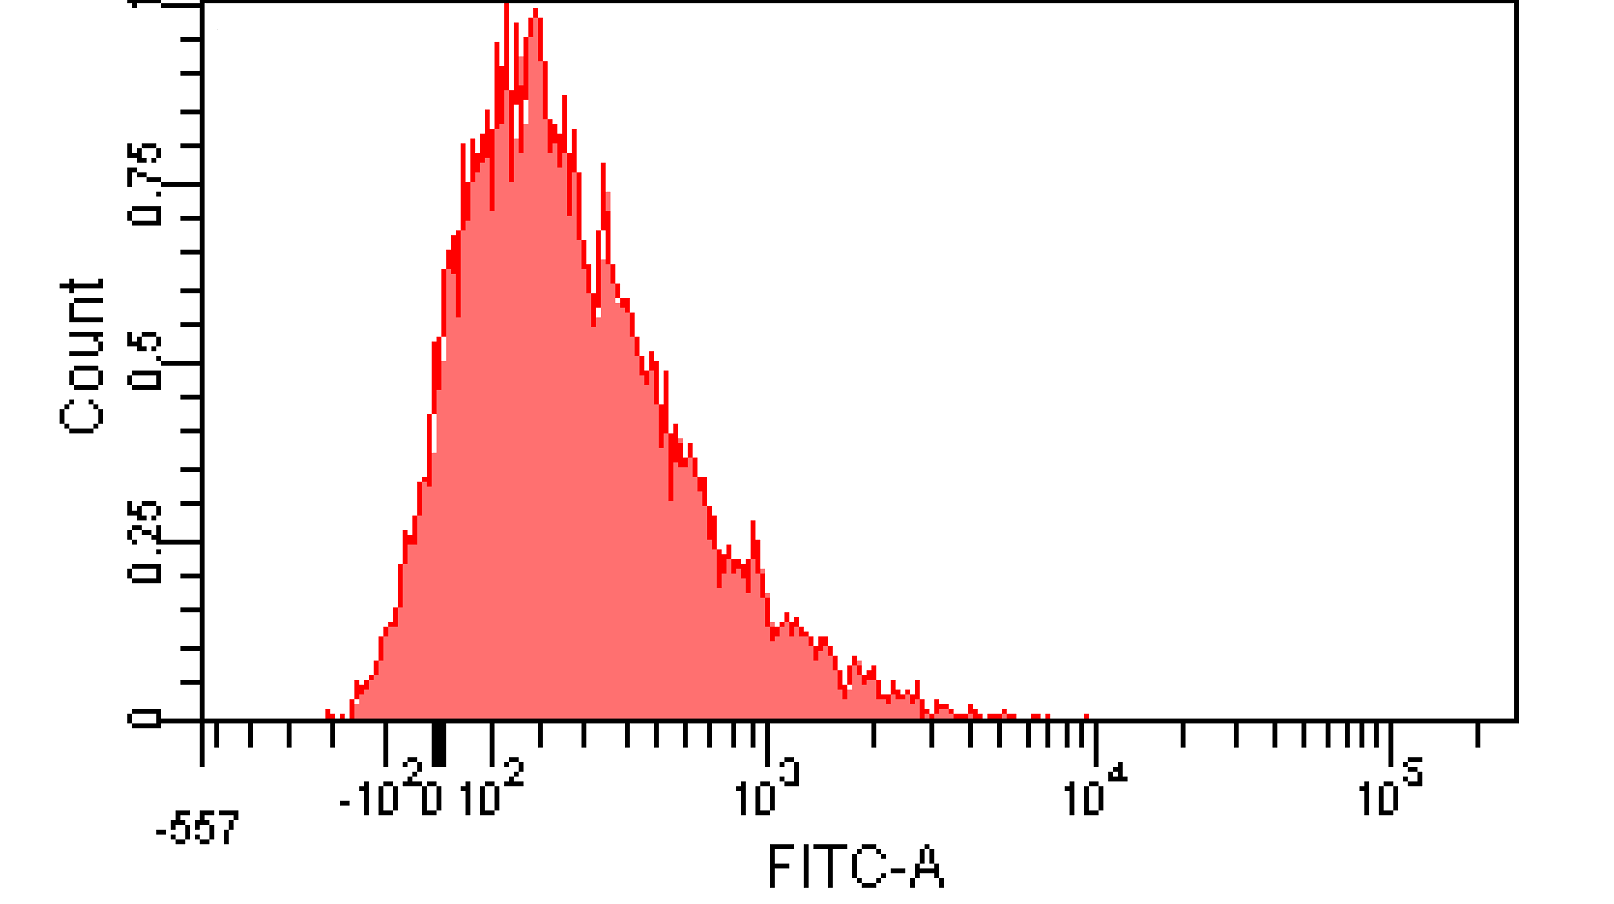
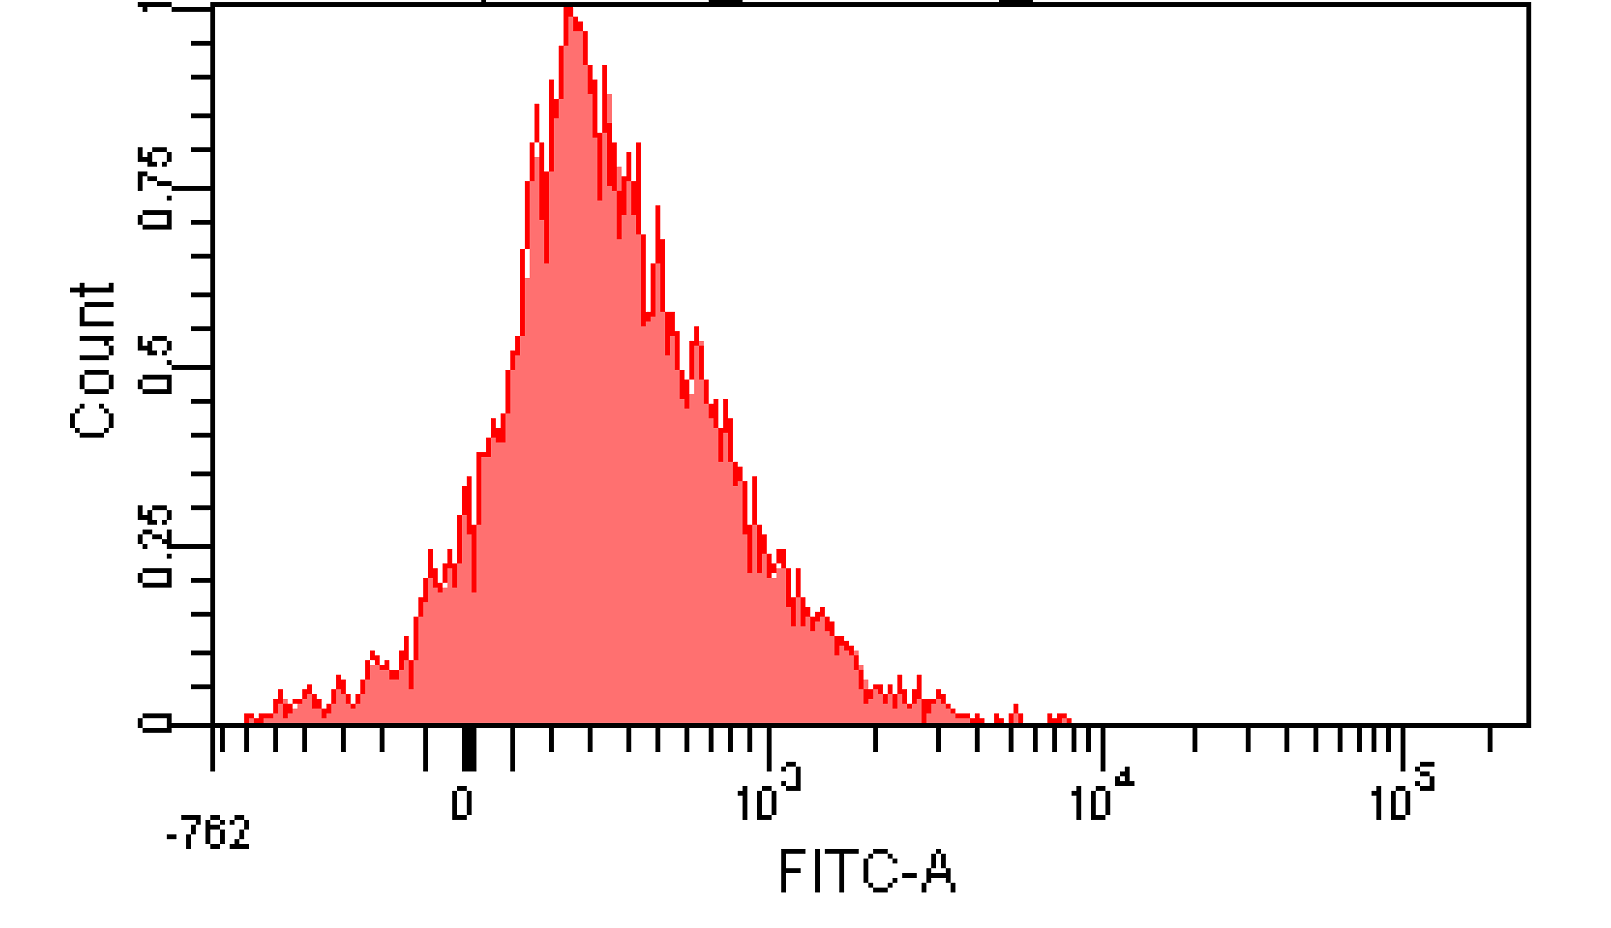
Figure 12. Distribution of Fluorescence Intensity. (A) Cin receiver system cell distribution of GFP fluorescence intensity. (B) salicylate receiver system cell distribution of GFP fluorescence intensity.
 "
"


