Team:Peking S/project/nonb/comparator
From 2011.igem.org
Template:Https://2011.igem.org/Team:Peking S/bannerhidden Template:Https://2011.igem.org/Team:Peking S/back2
Template:Https://2011.igem.org/Team:Peking S/bannerhidden

Non-Boolean Dynamics
Introduction|Design|Comparator
Comparator
Synthesizing a Modular Comparator Using Small Regulatory RNAs
Introduction
Our ‘chemical wire’ toolbox is not only applicable to Boolean logic gene networks, but also amenable to non-Boolean population dynamics, for instance, the microbial population density balancer mentioned above.
In such a dynamical network, we need to construct a comparator device that can integrate two environmental signals. We managed to fulfill the task with the simplest elements and types of interactions of gene regulation, i.e., the inducible promoters, mRNAs and regulatory small RNAs that silence them. We will demonstrate that simply by combining these three types of genetic components, a comparator module can be implemented and thus to work in population balancer system to verify the feasibility of our "chemical wire" toolkit for non-Boolean population dynamic.
Design
Small noncoding RNAs (sRNAs) have been depicted in recent years to play central roles in gene regulation. The special features of small RNA mediated regulation are fast responsive, noise insensitive and threshold effect, which inspire us to construct an artificial comparator based on small RNA regulation. Before biological implementation in bench, during circuit design, series of requirements must be met.
(1) Input 1 activates mRNA and sRNA 1.
(2) Input 2 activates mRNA and sRNA 2.
(3) Suppose there is more input 1, sRNA 1 will strongly repress mRNA 2 and vice versa.
(4) Suppose there is less input 2, the repression going towards the other way should be weak enough. This will lead to the production of output 1, and little to no production of output 2.
(5) The output of the device is either dominated by output 1 or output 2. By seeing which is the case, we can infer whether input 1 or input 2 was present in greater amounts. (See Fig. 1)
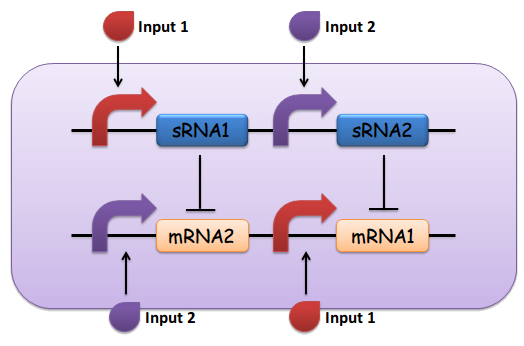
Fig.1 The design of the sRNA-dependent comparator, as described above
Numerous sRNA/5’UTR pair have been reported in literature. We regarded the ptsG/SgrS pair as an ideal candidate for our comparator design for its special regulation mechanism described below.
Mechanism
SgrS is an Hfq-binding small antisense RNA that is induced upon phosphosugar stress (Vanderpool, 2007). It forms a ribonucleoprotein complex with RNase E through Hfq to mediate silencing of the target ptsG mRNA encoding the major glucose transporter (Geissmann and Touati, 2004). A 31-nt-long stretch in the 3’ region of SgrS is partially complementary to the translation initiation region of ptsG mRNA, and a 6 nt region overlapping the Shine-Dalgarno sequence of the target mRNA turns out to be crucial for SgrS’ function, shown as Fig 2 (Kawamoto et al., 2006; Maki et al., 2010).
Fig. 2 Sequence alignment of wild type ptsG/SgrS pair and its mutant complementary pairs. (A) The partial complementary region of ptsG (wt) mRNA and its corresponding sRNA SgrS. (B) The complementary pair of ptsG1 mRNA and corresponding SgrS1. (C) Another complementary pair site-mutant version of ptsG2 mRNA and corresponding SgrS2.
Teppei Morita et.al’ s work suggests that two mutations (C85G and C87G) in ptsG mRNA could completely impair the ability of SgrS to downregulate its expression, while compensatory mutations of SgrS (G178C and G176C) restore the gene silencing ability. These results indicate that it is the base pairing of the two RNAs rather than particular nucleotides that is important for SgrS action. They have also illustrated that sequence outside this region, even though complementary, is rather dispensable for the efficient silencing (Kawamoto et al., 2006). This makes mutant ptsG/SgrS pairs orthogonal to genetic context of the host cell.
By employing two sets of mutant ptsG mRNA as well as its complementary SgrS in the design shown in Fig 1, we set to biologically implement the comparator. In detail, ptsG1 refers to a C85G mutant of ptsG (wt) while ptsG2 is a C87G mutant. SgrS1 (G178C) and SgrS2 (G176C) are the corresponding revertants which could help restore their complementarity. And as a proof-of-concept experiment, we constructed synthetic gene circuits, in which the 5’ untranslated region of ptsG mRNA was translationally fused to the coding sequence of the reporter gfp (Levine et al., 2007), as shown in Fig 3.
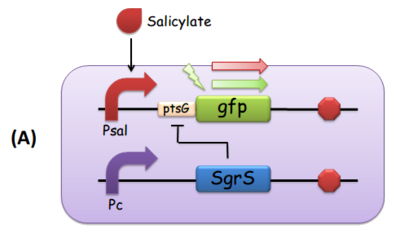
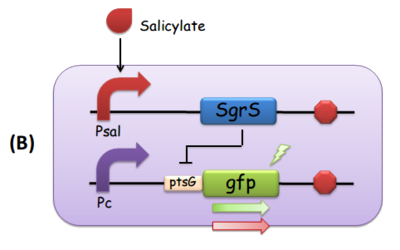
Fig. 3 The modular components of the comparator. (A) Salicylate leads to the transcription of ptsG-gfp mRNA, which is the target of constitutively expressed SgrS. This is how we implemented both reporting and repressing outputs as a result of the activation of Psal. When there is more salicylate in the media, the GFP fluorescence intensity is expected to be stronger. (B) Salicylate leads to the transcription of SgrS, while the ptsG-gfp mRNA is downstream a constitutive promoter. In this scenario, as the concentration of salicylate increases, the repression effect SgrS exerts on ptsG would in turn be stronger, so the GFP fluorescence intensity is supposed to be weaker.
Data Analysis and Discussion
To qualitatively and quantitatively characterize the performance of our competitor, we conducted the following experiments.
Part I. The Orthogonal Silencing Matrix
The repression capacity of each ptsG/SgrS pair was indicated by the ratio of the average fluorescence intensity before to after the trigger of SgrS. What we expected was a significant repression within the cognate pairs (ptsG1/SgrS1, ptsG2/SgrS2, and ptsG (wt)/SgrS (wt)), and a minor repression folds among different pairs.
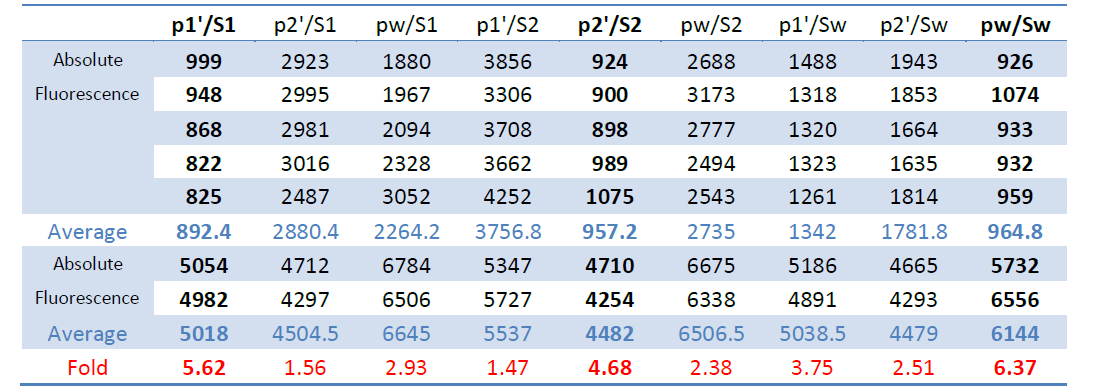
As Figure 4 shows, the highest ratio lie at the diagonal from the upper left to the lower right as expected, which is 5 to 6 folds. As for the ptsG (wt)/SgrS1&2, ptsG1/SgrS (wt), and ptsG2/SgrS (wt), given that these crosses differ at only one base pair, the repression efficacy is around 3 folds. By contrast, the inhibiting effect of on ptsG2 and SgrS2 on ptsG1 is rather unapparent, which can be seen as an appropriate characteristic fitting our competitor requirements.
The original data also provided below (Table 1).

Fig. 4 A graphical representation of the repression matrix associated with SgrS and its mutants, and ptsG and its mutants. The values represent the repression ratios, defined as the repression capacity of each ptsG/SgrS pair, denoted by the ratio of fluorescence intensity before to after the induction of SgrS, suggesting within-subgroup pairwise specificity.
Table 1 Original Data for the ptsG/SgrS Interaction Matrix
Part II. Response Curves
The sRNA-mediated gene silencing can be formulated quantitatively via a simple kinetic model. The model is cast in terms of two mass-action equations for the cellular concentrations of the sRNA (s) and its target mRNA (m):
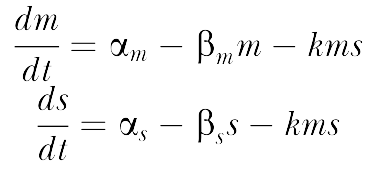
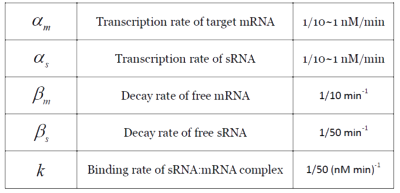
The parameters are defined as in Table 2.
Table 2. Model Parameters: Definitions and Estimated Values
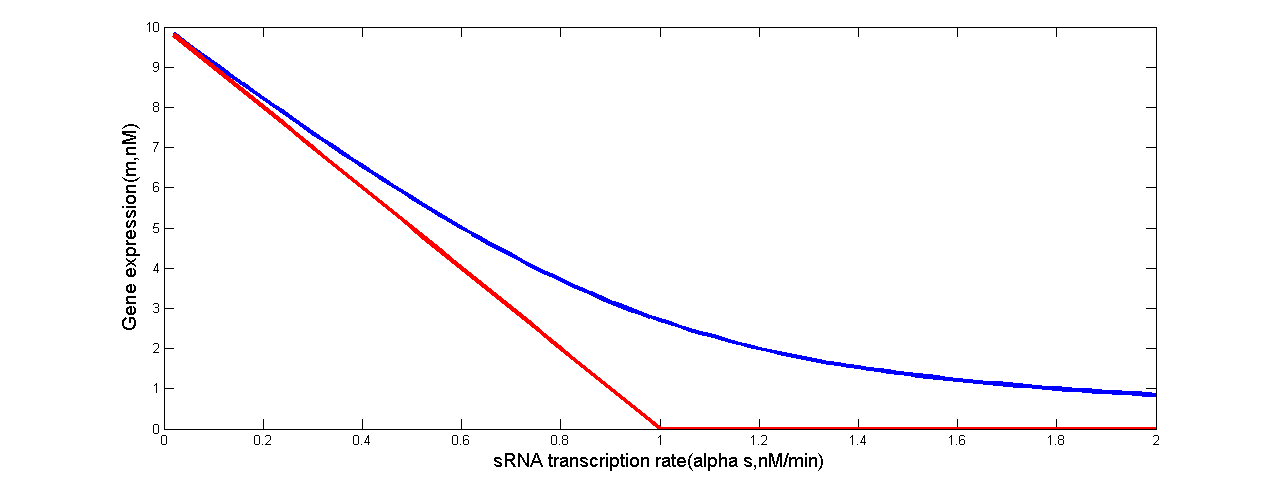
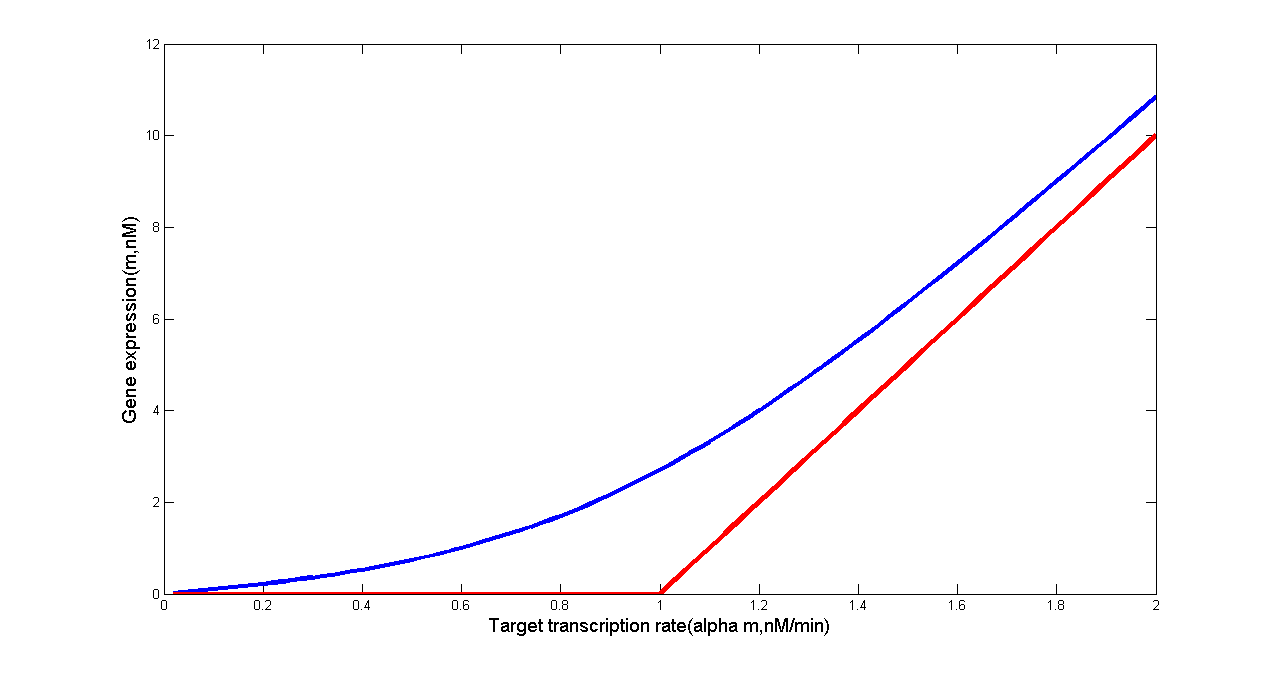
Levine et. al’s work has revealed that in the idealized scenario when binding between sRNA and mRNA occurs extremely rapidly, gene expression is completely silenced if the target transcription rate is below a threshold. Above this threshold, gene expression will increase linearly. Such threshold-linear model is based on the difference of transcription rates between sRNA and mRNA(Levine et al., 2007).
Fig 5. Threshold-Linear Response of the Target Gene (in our case, ptsG-GFP mRNA or SgrS). Predicted response curve of a target gene. (a) The red line depicts the idealized threshold-linear mode of regulation in which gene expression is completely silenced if the SgrS transcription rate exceeds a threshold set by the transcription rate of the ptsG-gfp mRNA. Under this threshold, gene expression decreases linearly with the difference between the mRNA and sRNA transcription rates. (b) The red line depicts the idealized threshold-linear mode of regulation in which gene expression is completely silenced if the ptsG-gfp mRNA transcription rate is below a threshold set by the transcription rate of the sRNA. Above this threshold, gene expression increases linearly with the difference between the mRNA and sRNA transcription rates. The idealized scenario is expected when binding between sRNA and mRNA occurs extremely rapidly. The blue line is the actual response expected using the estimated parameters of Table 2.
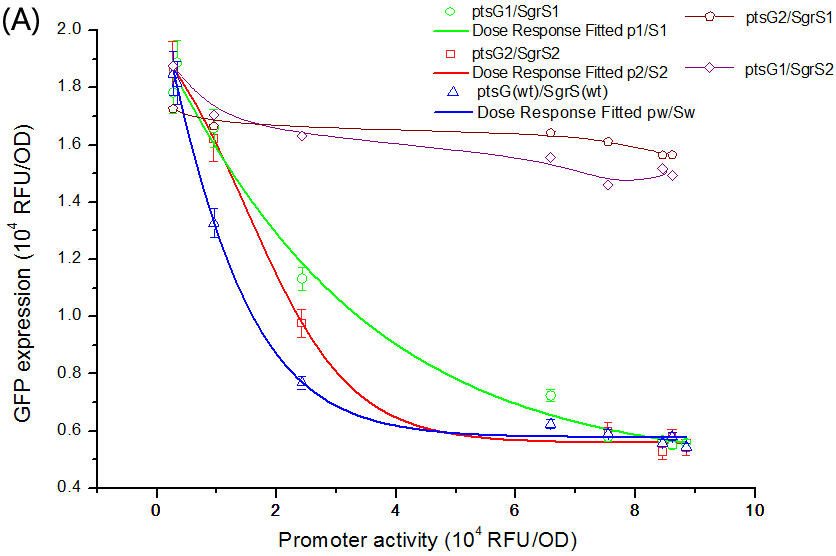
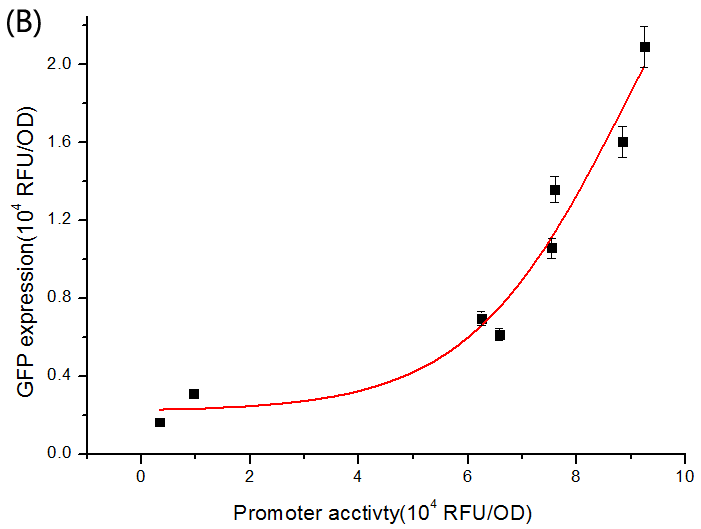
To verify this, we performed experiments to get the dose-response curve. The result is shown in Figure 6.
Fig. 6 The dose-response curve of SgrS/ptsG-gfp interaction. (A) Salicylate-induced SgrS repressing the expression of ptsG-GFP. The promoter activity is defined as the GFP expression of the Psal+gfp strain grown in identical media. Different promoter activities were obtained by varying salicylate concentration in the media. The conjugate pairs fit into dose-response curve with variable Hill slope given as a parameter, and the R^2 is 0.9974, 0.9879, and 0.9607 corresponding to ptsG(wt)/SgrS(wt), ptsG1/SgrS1 and ptsG2/SgrS2, respectively. (B) When sgrS (wt) was constitutively expressed and ptsG (wt) salicylate-induced, a dose-response curve is also fitted with an R^2 of 0.9301.
Such results are in accordance with Levine et. al’s conclusion, i.e., the binding rates between mRNA and sRNA in effect are inherently limited, so the threshold-linear model couldn’t be strictly fitted (Levine et al., 2007). But the performance of SgrS/ptsG pairs is very close to the idealized threshold-linear mode of regulation.
Methods
I. The Orthogonal Silencing Matrix
Materials:
We have constructed two types of plasmids presented in Figure 7.


Fig. 7 Plasmids constructed for characterizing ptsG/SgrS orthogonal silencing matrix
After co-transformation to the DH5α competent cells, we got 3×3 strains shown in Table 3.
Table 3. E. coli strains constructed for ptsG/SgrS orthogonal silencing matrix.
Procedure:
1. Pick a colony to 2ml of LB antibiotic medium, in which the concentration of arabinose is 10-2 mol/L, and every 5 experimental groups are coupled with 2 controls.
2. Place the induction system at 37 degree for 8 hours.
3. Pellet bacterial cells by 10 min centrifugation at 4200 rpm, discard the supernatant.
4. Resuspend the pelleted cells in 1000μl of Phosphate Buffered Solution (PBS).
6. Transfer 500μl of bacterial resuspension into tubes to test the expression of GFP by flow cytometry.
II. The Response Curve
We have constructed two types of plasmids shown as Figure 8.


Fig. 8 (A) Plasmids constructed for plotting salicylic acid dose-response curve for SgrS. (B) Plasmids constructed for plotting salicylic acid dose-response curve for ptsG
Procedure:
1. Pick a colony to 400 milliliter of LB antibiotic medium, in which the concentration of salicylate is set from 10^-8 to 10^-4. Every 6 experimental groups are coupled with 2 controls.
2. Place the induction system at 37 degree for 8 hours.
3. Pellet bacterial cells by 10 min centrifugation at 4200 rpm, discard the supernatant.
4. Resuspend the pelleted cells in 1000μl of Phosphate Buffered Solution (PBS).
6. Transfer 100μl of bacterial resuspension into each well of 96-well plate to undergo the enzyme-labeled assay.
Reference
1.Geissmann, T.A., and Touati, D. (2004). Hfq, a new chaperoning role: binding to messenger RNA determines access for small RNA regulator. The EMBO journal 23, 396-405.
2.Gottesman, S. (2002). Stealth regulation: biological circuits with small RNA switches. Genes & development 16, 2829-2842.
3.Kawamoto, H., Koide, Y., Morita, T., and Aiba, H. (2006). Base-pairing requirement for RNA silencing by a bacterial small RNA and acceleration of duplex formation by Hfq. Molecular microbiology 61, 1013-1022.
4.Levine, E., Zhang, Z., Kuhlman, T., and Hwa, T. (2007). Quantitative characteristics of gene regulation by small RNA. PLoS biology 5, e229.
5.Maki, K., Morita, T., Otaka, H., and Aiba, H. (2010). A minimal base-pairing region of a bacterial small RNA SgrS required for translational repression of ptsG mRNA. Molecular microbiology 76, 782-792.
6.Vanderpool, C.K. (2007). Physiological consequences of small RNA-mediated regulation of glucose-phosphate stress. Current opinion in microbiology 10, 146-151.
 "
"


