Team:uOttawa/Results
From 2011.igem.org
Results
Contents |
BrickMason
The construct
In order to test the BrickMason assembly method, we decided to build the following construct:
When transformed into yeast this construct should knock out the ADE2 gene, causing the cell to turn red. Cells that have successfully taken up the construct should be resistant to the G418 drug (conferred by KanMx) and should express the Ura3-GFP fusion protein. They should therefore also grow on Ura- plates, and express GFP.
The assembly
Constructs 1-6 were PCRed using biobrick primers and then cut out of a gel, This is shown below in figure 2. The ladder used in all of our gels is the NEB 2-Log DNA Ladder which can be found at: http://www.neb.com/nebecomm/products/productN3200.asp
These pieces were then used to create overlapping heterodimers as explained in the BrickMason animation and description. Part A of the heterodimer was digested with SpeI, and part B was digested with XbaI, part B was then dephosphorylated. Part A and B were ligated together, and were then digested with XbaI and SpeI to get rid of homodimers. This reaction mixture was used as a template in the a PCR reaction using the forward BioBrick primr for part A and the reverse BioBrick primer for part B. The heterodimers used in this assembly (12,23,34,45,56) are shown in figure 4.
Each heterodimer was cut out of the gel in figure 4, gel purified, and digested with XbaI and SpeI. These heterdimers were then combined in one final PCR reaction to obtain the final construct shown in figure 5.

The ~4 KB band shown in figure 5 was cut out of the gel and transformed into yeast using standard transformation protocols. Figure 6 shows a picture of the transformation plate, red colonies indicate positive transform ants.
Results
16 red colonies form the plate shown in figure 6 were restreaked onto SM – Ura plates, and all of them grew, the wild type BY4742 strain did not grow.
These colonies were then inoculated into liquid culture and grown overnight and measure on the flow cytometer. Figure 8 shows that 6 of the 16 colonies expressed GFP.

Benchmarking
Our construct was amplified out of each of the 16 colonies and was sequenced. Out of the 40 000 bp that were sequenced, there were only 7 definitive mutations identified. Therefore we have benchmarked out method as having an error rate of 0.0175 errors per nucleotide. Unfortunately many of these errors occurred at the junction of the Ura3-GFP fusion protein causing the GFP to be out of frame. This error occurred early on in the procedure during heterodimer formation and propagated throughout the assembly. That is why all the colonies grew in –Ura but only 6 expressed GFP. Most likely this problem is related to the ligase rather than multiple rounds of PCR.
Summary
We developed a new DNA assembly protocol called BrickMason assembly. We assembled 6 pieces in one day's work and showed that the assembled constructs functioned as expected in yeast. The yeast cells were extensively sequenced and we found that the method had an error rate of 0.0175 errors per nucleotide. The same cloning protocol would have taken 9 days to complete using traditional cloning methods. The whole procedure can be completed with standard lab equipment and reagents. Users who will not be using E. coli as the final destination for their constructs do not need to use E. coli at all, they can instead transform the final construct directly into the organism of interest. We hope that BrickMason makes you enjoy cloning as much as we do!
BioBrick characterization
Characterization of BBa_K642000 and BBa_K642004
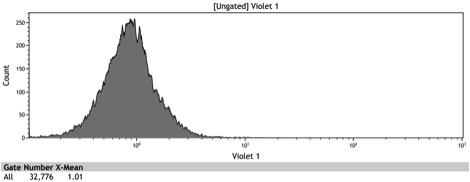
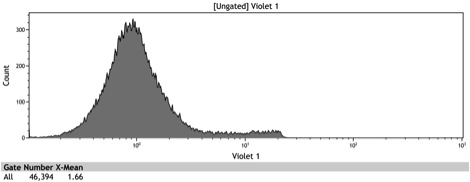
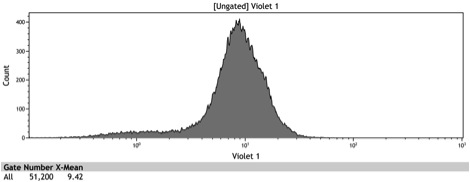
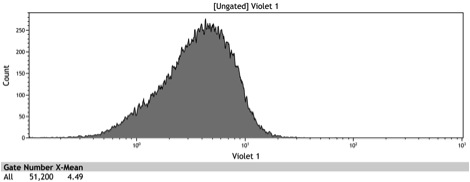
We quantified the fluorescence of two tagged repressors: BBa_K642000 and BBa_K642004 by cloning them downstream of the yeast Gal10/1 promoter. The construct was then integrated using KanMX6 selection into the Ade2 locus of a BY4742 strain of S. cerevisiae. The resulting strain was innoculated in 3 mL of 1x SM + 2% Galactose + 2% Adenine overnight. The overnight culture was reinoculated into 1 mL of the same media at an OD600 of 0.02. After three hours the strain was analyzed for BFP fluorescence on a Cyan ADP flow cytometer.
Figure 1: In vivo BFP fluorescence of BBa_K642000, a TetR repressor tagged with yeast codon optimized BFP and BBa_K642004, a TetR repressor tagged with yeast codon optimized BFP and VP16 activation domain. These parts were integrated using KanMX6 selection into a BY4742 strain of S. cerevisiae.
Figure 2: Histogram of uninduced wildtype BY4742
Figure 3: Histogram of uninduced BBa_K642000 -TetR-BFP
Figure 4: Histogram of uninduced BBa_K642004 - TetR-BFP-VP16
Figure 5: Histogram of induced wildtype BY4742
Figure 6: Histogram of induced BBa_K642000 – TetR-BFP
Figure 7: Histogram of induced BBa_K642004 – TetR-BFP-VP16
Characterization of the ADH1 distal-Gal10/1 proximal promoter
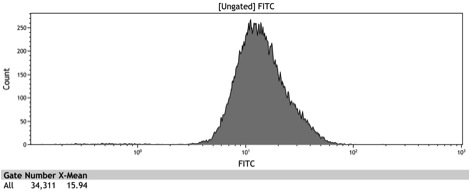
Although we did not manage to submit the ADH1 distal-Gal10/1 proximal promoter as a BioBrick by the wiki freeze (cloning issues), we were able to quantify its fluorescence by cloning yeast enhanced GFP downstream of it. The promoter was integrated using NatMX selection into the Ade4 locus of a BY4742 strain of S. cerevisiae. The resulting strain was innoculated in 3 mL of 1x SM + 2% Galactose + 2% Adenine overnight. The overnight culture was reinoculated into 1 mL of the same media at an OD600 of 0.02. After three hours the strain was analyzed for GFP fluorescence on a Cyan ADP flow cytometer.
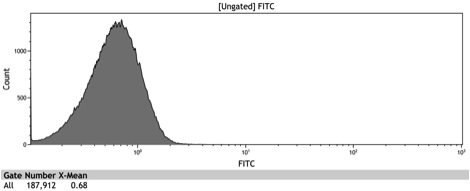
Figure 8: Histogram of induced wildtype BY4742
Figure 9: Histogram of the induced ADH1 distal-Gal10/1 proximal promoter
 "
"


