Team:UC Davis/Process
From 2011.igem.org
Start a Family
Got a favorite BioBrick? Check our our process for expanding basic parts into part families.Criteria
View our judging criteria for iGEM 2011 here.
Our Process
Want to make your own mutants? By following our library generation process, you can generate and screen variants of virtually any BioBrick part.
Generating Mutant Libraries with Error-Prone PCR
The process by which we produce our mutant libraries is both fast and simple. We select a BioBrick part and prepare an error-prone PCR reaction using a small amount of template, standard VF2 and VR primers, the error-prone PCR mix listed on our protocols page and Taq polymerase enzyme. The products of this reaction may be diluted and run through another round of PCR to introduce more mutations.Mutant parts are then ligated directly into a screening construct like those listed below to help assess part activity. For example, mutant promoters can be placed in front of GFP to estimate their strength by relative fluorescence, whereas repressors can be paired with their corresponding promoter in front of a reporter. Transformation of these ligation products into competent DH5-α cells yields plates with many colonies, many containing mutants of the selected BioBrick part.
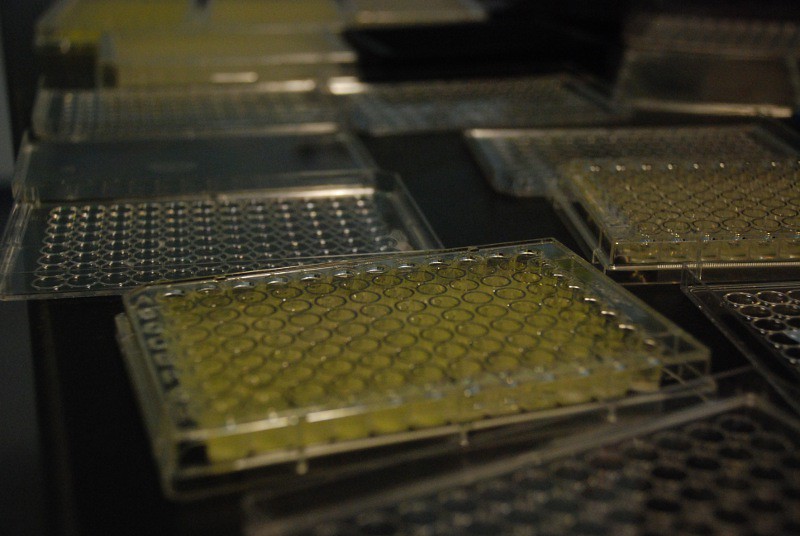
Colonies with the desired level of reporter expression are transferred to replica plates, grown up in liquid culture, and assayed in a 96-well plate reader. Consecutive screens are performed to narrow down the number of potential mutants so that they may be run in triplicate in our plate reader, using Octave scripts to select mutants with characteristics within the desired range.
Once a final group of mutants has been picked, they are carefully characterized for activity level or other features This characterization process is different for each mutant and reporter chosen.
Promoter and Repressor Mutants
 To show that our protocol can also be used to fine-tune the application of promoters, we performed our mutant library production process on parts R0010, R0040 and R0051 (the LacI, TetR and c1 Lambda promoters) using three successive rounds of error-prone PCR.
We screened these mutants for GFP fluorescence as a result of promoter activity compared to wild type, and characterized their response to changes in repressor concentration. We also characterized the response of wild-type and mutant LacI promoter / wild-type repressor pairs to IPTG at various repressor concentration levels.
To do this, we set up 150 uL liquid cultures in transparent 96-well plates and used a plate reader to measure optical density at 600 nm (OD600) and GFP fluorescence with an excitation wavelength of 478 and an emission wavelength of 518 nm. We measured our fluorescence readings for comparison between promoter mutants just after our cultures entered stationary phase, which was generally also the maximum fluorescence reading on graphs of fluorescence over time since plate inoculation. Because our promoter screening construct promotes corresponding repressors using the inducible promoter I13453 (pBAD), we had to perform our screening in E. coli strain BW22826, which contains the AraC repressor protein constitutively expressed on its chromosome but lacks AraBAD. This allowed us to increase repressor concentration in liquid culture by using LB with varying amounts of arabinose. For the LacI promoter, we pipetted equal amounts of IPTG solution at different concentrations into the wells, allowing us to vary the IPTG and Arabinose independently of one another and measure GFP expression to produce the 3D graphs shown on its data page.
General Mutant Screening Constructs
The specific order in which the parts are depicted below allows the user to swap in any promoter/repressor or promoter/activator pair using our regulatory characterization plasmid, K611018.
We designed this construct for characterizing promoter mutants. When pBAD is induced with arabinose, the repressor of choice is transcribed leading to decreased levels of the reporter, GFP.

 "
"


