Team:Brown-Stanford/REGObricks/Characterization
From 2011.igem.org
Characterization of Sporosarcina pasteurii
Sporosarcina pasteurii
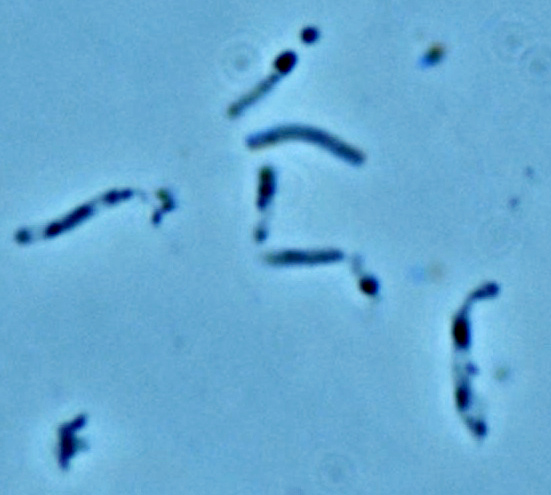
Moving urease out of the hospital and into the streets is the growing interest of biocementation. At the center of attention is the organism S. pasteurii (formerly grouped in the Bacillus taxonomy) an alkaphilic, gram-positive, aroebic, spore-forming non-pathogenic bacteria.
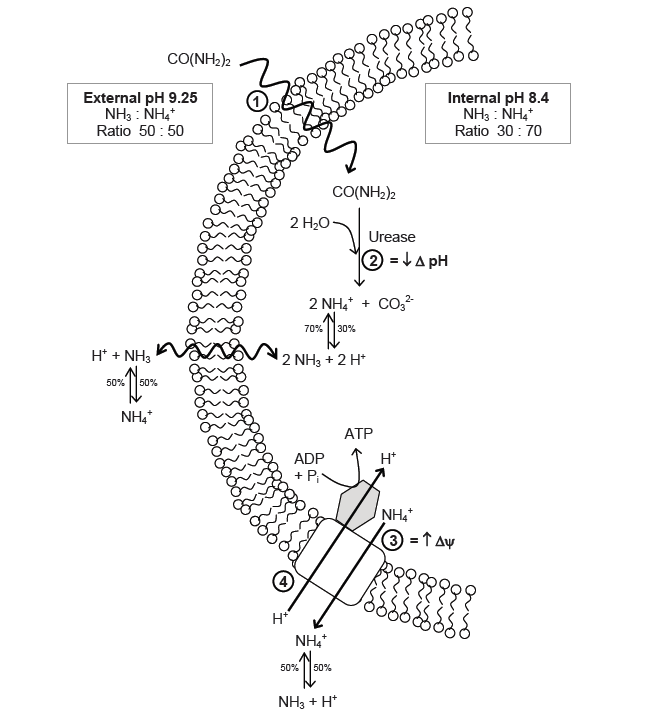
The function of urease in S. pasteurii is coupled with its capacity to generate ATP. The production of ATP is regulated by a proton-motive force (delta p), which is the sum of the pH gradient (delta pH) across the cell wall, as well as the potential of the member (delta psi). In cells that live in neutral environments, ATP is generated via the proton motive force created by the actions of an electron transport chain. For an alkaphile, the surrounding environment contains too few protons, and leads to a negative delta pH. To combat this, S. pasteurii relies on the efflux of ammonium cation created by urease activity to increase the charge potential (delta psi)1

Cell Culture
Cultures of S. pasteurii were obtained from American Tissue and Culture Collection (ATCC 11859) to be characterized in this study. Several different types of culture media were prepared (specific composition may be found in our registry of protocols and media). The cells were found to grow best in the recipe send by Dr. Sookie Bang of the South Dakota School of Mining and Technology, which we affectionately termed Bang media:
By Percentage (m/v)
- 1% tryptone
- 0.5% yeast extract
- 0.45 tricine
- 0.5% (NH4)2SO4
- 0.2% glutamic acid
- 1% urea
By Mass per Liter
- 10g tryptone
- 5g yeast extract
- 4.5g tricine
- 5g (NH4)2SO4
- 2g glutamic acid
- 10g urea
- Optional: 15g agar (for plates)
Notes
- Mix in 200mL of water (without agar) to make a 5x solution.
- Needs to be at a pH of 8.5
Quantification of urease function
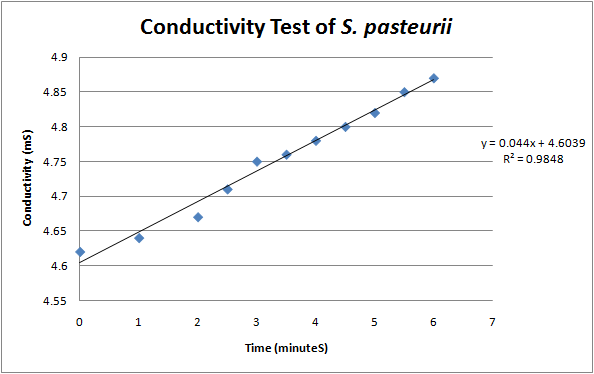
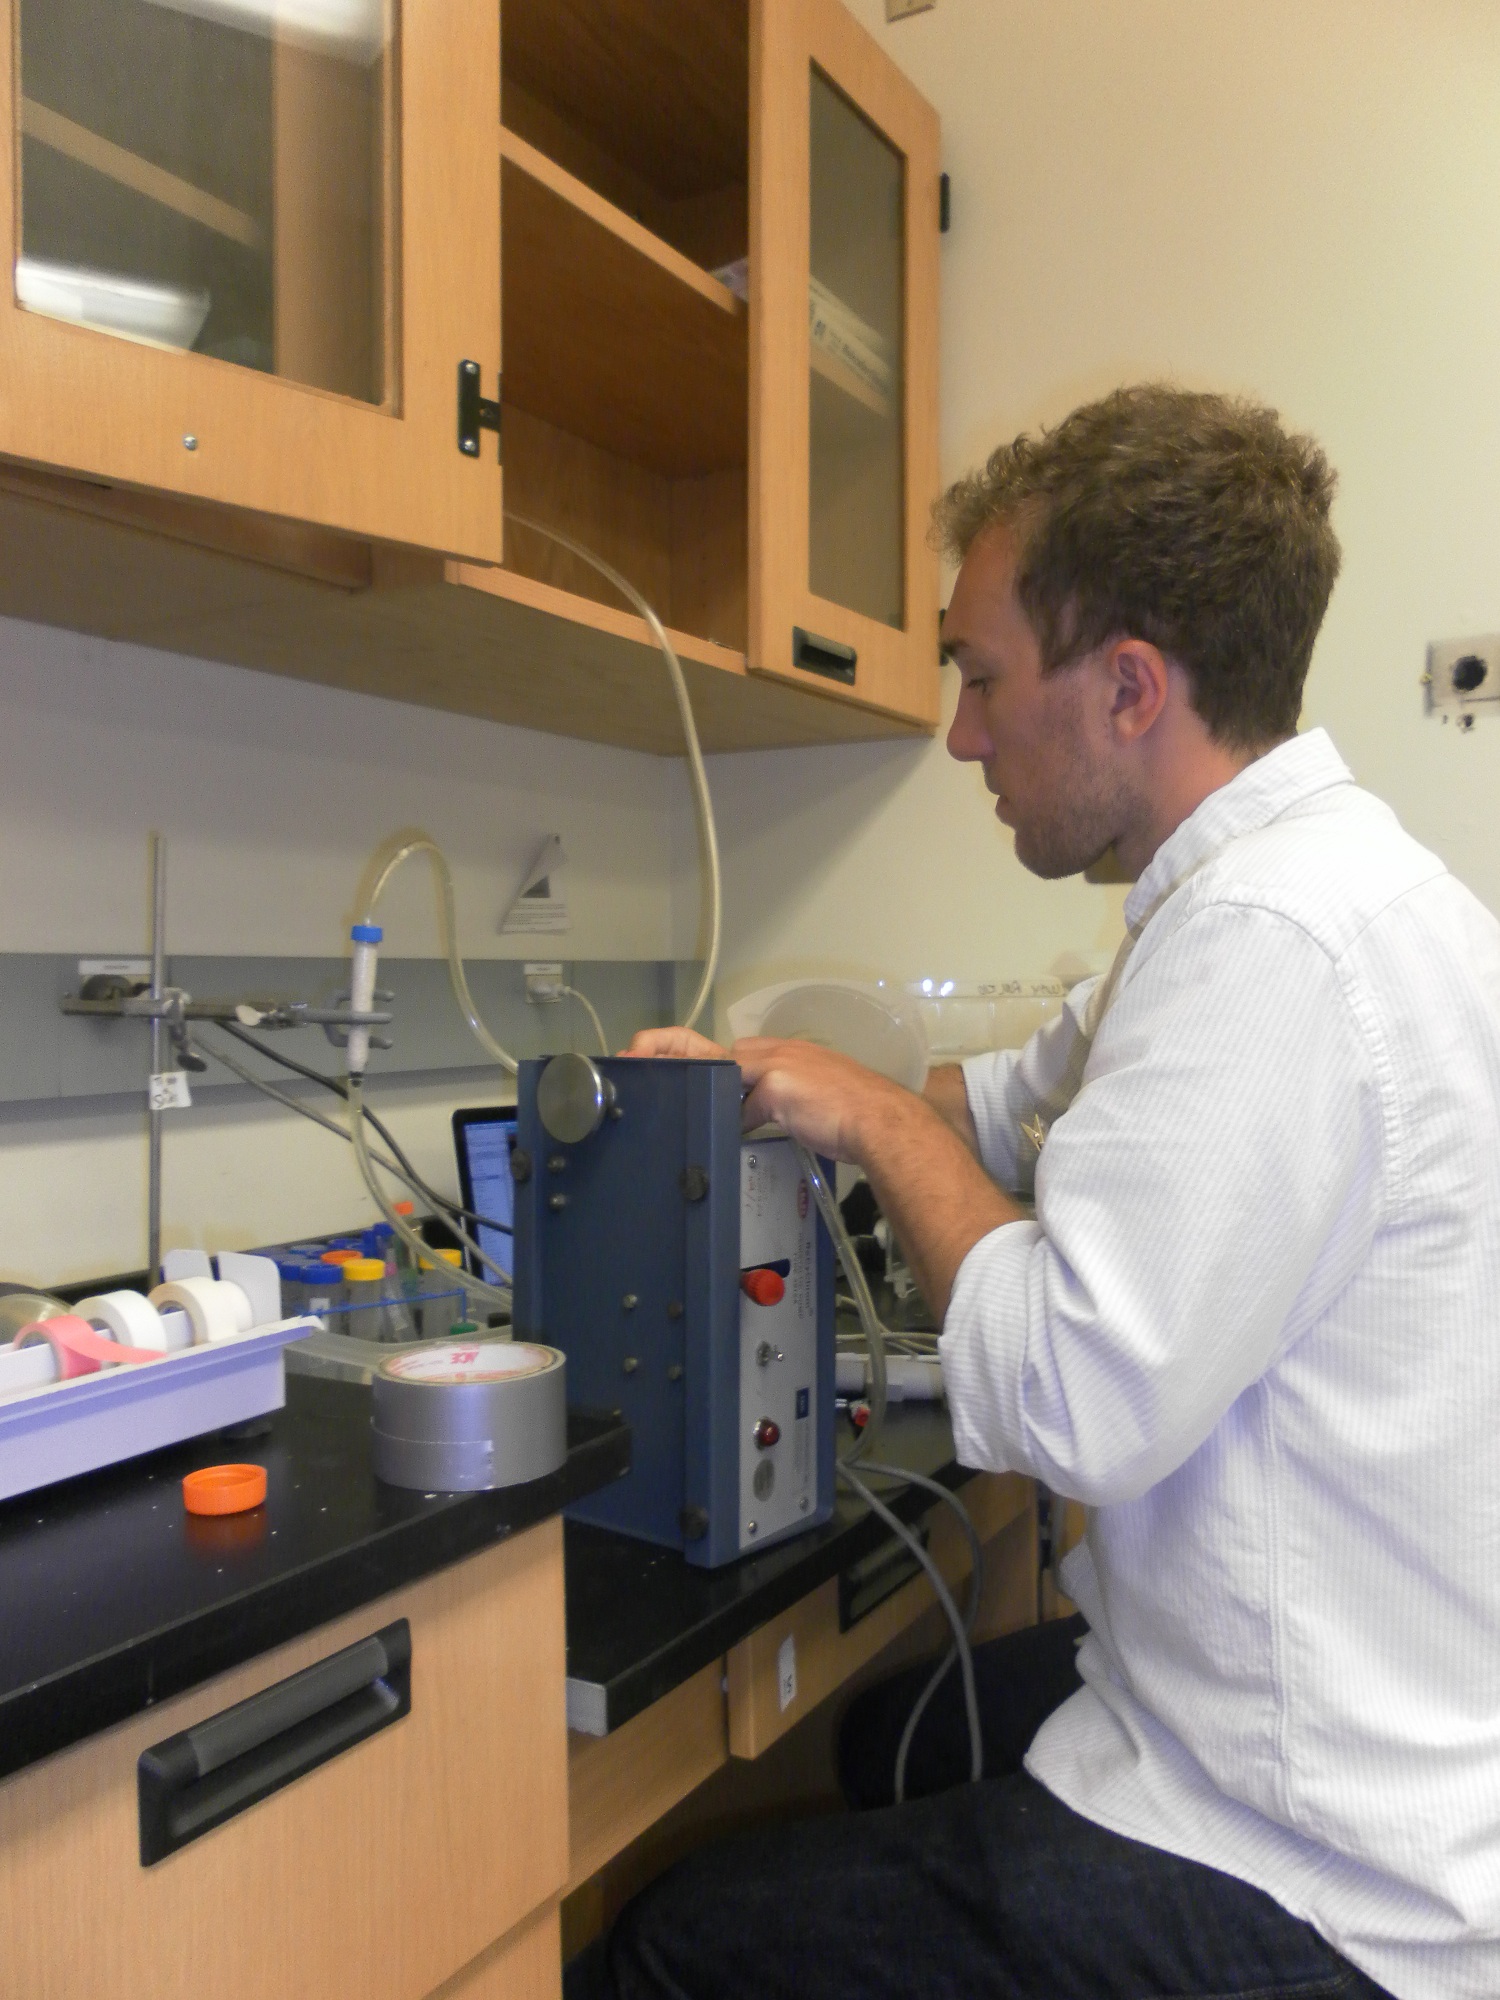
According to a protocol discussed by Whiffen et al, urease activity can be measured via changes in conductivity [1]. Vials of S. pasteurii were grown up overnight in 5 ml culture tubes of Bang media until they reached optical density of 0.6-0.8 (see cell culture), and introduced into a 30 mL solution of 1.5 M urea. Changes in conductivity were measured with a pH & Conductivity Multimeter. The rise in conductivity corresponds to the generation of positively charged ammonium ions from the hydrolysis of urea, make the solution more conductive. Samples of the conductivity were taken every half minute to show a linear increase over time. Specific activity of urease was calculated by dividing change in ammonium concentration over Optical Density @ 600 nm.
The formula for relating conductivity to ammonium generation was found in a research paper “An increase of 1mS in the urease solution is equivalent to the hydrolysis of 10mM urea” (Whiffen et al, 2004.)1
Qualitative analysis of urease function
I. Urea-Phenol Red Test Plates
To find an easy qualitative method to test for the presence of urease for our attempts at modularizing the urease gene cluster, we turned the gold standard in medical assays: agar stabs containing urea and phenol red. In the presence of urease, the urea is hydrolyzed to generate a basic ammonium gradient on the plate, causing the agar to undergo a colorimetric change from pale yellow to bright pink. The recipe for the plates can be found here
II. Microscope Slide Carbonate Precipitation
As a visual confirmation of the biocementation ability of our cells, and soon-to-be transformants, we turned to microscopy. Under 40x zoom lens, we induced carbonate precipitation on glass plates by mixing different cells (OD 0.6-0.8) and filter-sterilized cementation solution (1.5 M urea and 1.5 M CaCl2).
III. The Sand Column
We attempted to create a macroscopic demonstration of biocementation. Upon learning that the biocementation process was of sufficient value and difficulty to warrant two separate patent applications for elucidating the process, we tried to separately elucidate the process for iGEM’s open resource community. Following the guidance of several research articles, we built several cementation columns. Materials and procedures can be found here
Unfortunately, construction of a flow-through cementation column was unsuccessful, though we did manage to create surface-layer biocementation on weigh boat (see picture). Cementation after 5 days proved sufficiently stiffened enough to resist a scalpel. Disappointment aside, we learned that it had taken the researchers over six years to master the process, and that we went against high odds to replicate it in three months.
As compensation for our plight, one of the visiting researchers with a pending patent for biocementation allowed us fly one of the real cemented bricks in our weather-balloon trip to the edge of the world to see how the drastic reductions in temperature and pressure will affect the brick and bacteria.
Go on to see our attempts at Transformation here--->
Go on to see what we did to our wild-type microbes and bricks--->
References
1 Whiffen, V. S. Microbial CaCO3 Precipitation for the Production of Biocement. Science and Engineering, School of Biological Sciences and Biotechnology Perth, Western Australia, Murdoch University. Ph.D. thesis.]]
 "
"


