Team:SJTU-BioX-Shanghai/Project/Subproject1/Modeling
From 2011.igem.org
|
|
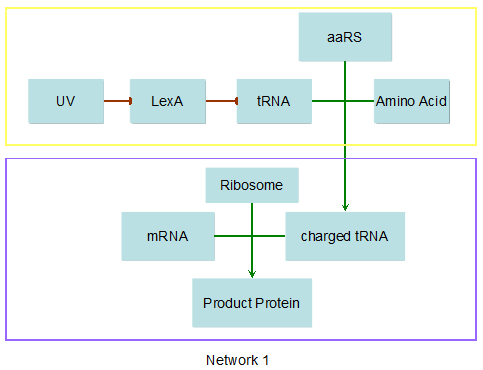
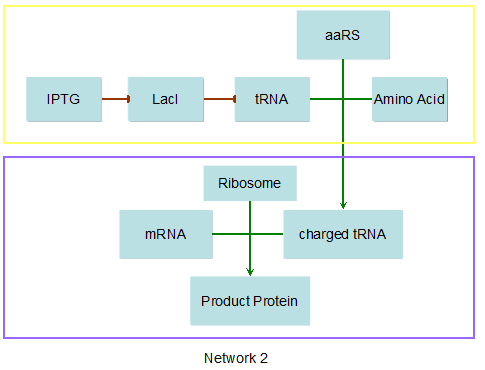
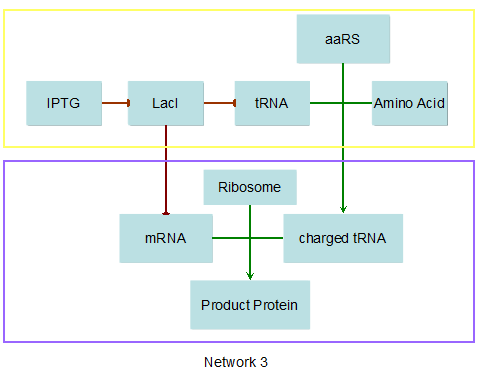
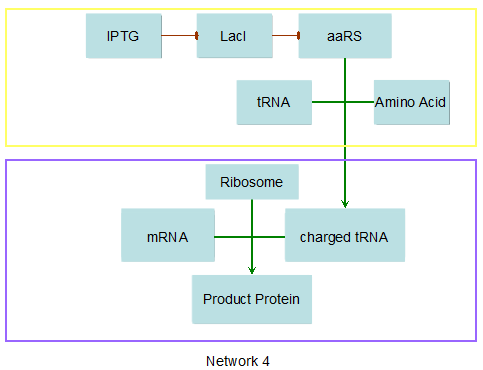
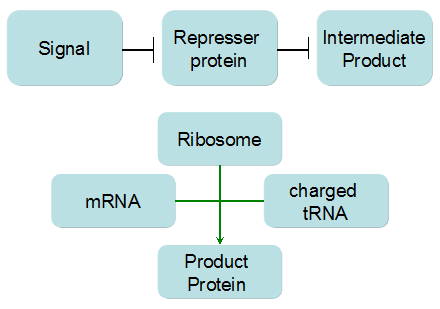
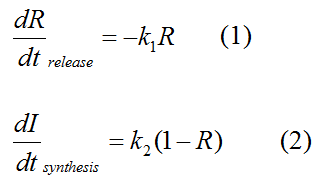
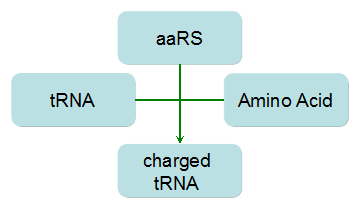
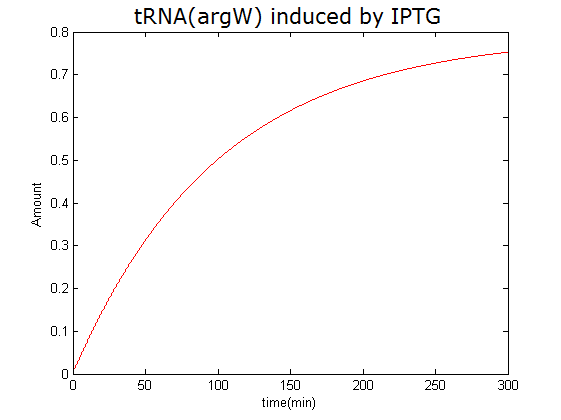
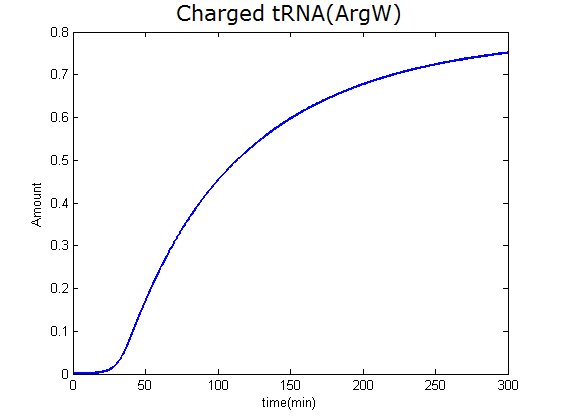
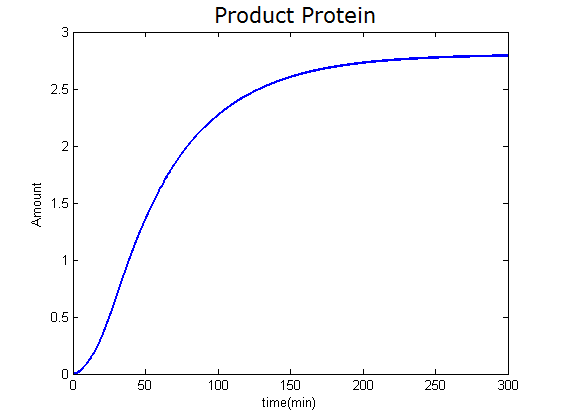
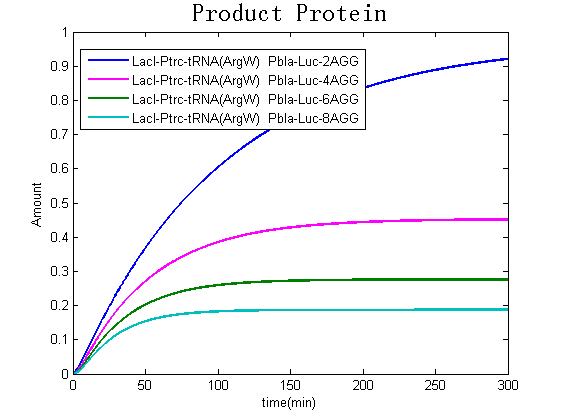
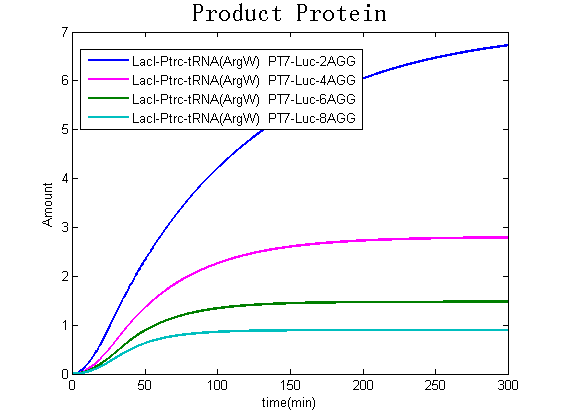
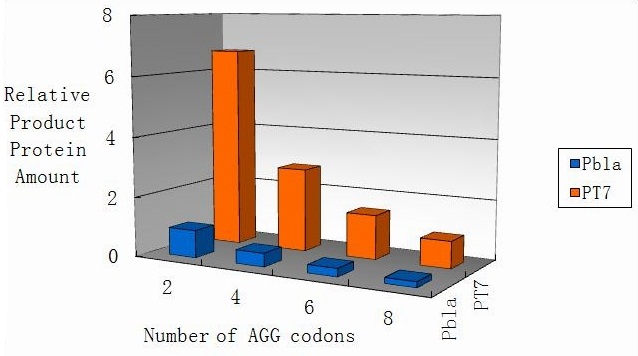
Modeling-1: Dynamic Modeling Based on the Involved Biochemical Mechanism1. MotivationMathematical modeling is a useful tool for understanding how a bio-system works and how to improve it. We build a mathematical model mainly based on the mechanism of the involved biochemical reaction. We focus on the dynamic process of "Modulator Part" in order to reveal how the system works over time. The model for other Parts can be gained by altering this existing model 2. Overview DescriptionFour different networks are involved in our project (figure 1). According to the mechanism of biochemical reaction, each of the networks can be divided into two modules: signal sensing module and translation module. Network 1 represents sulA promoter-tRNAArg and Pbla-Luc-nAGG (n=2, 4, 6, 8) system. This summarizes the modulating stimulated by ultra-violet ray Network 2 represents lacI-Ptrc-tRNAArg) and Pbla-Luc-nAGG (n=2, 4, 6, 8) system. This summarizes the modulating stimulated by IPTG Network 3 represents lacI-Ptrc-tRNAArg and PT7-Luc-nAGG (n=2, 4, 6, 8) system. This summarizes the modulating stimulated by IPTG. Note: the reporter gene is under different promoter Network 4 represents PT7-TDRS and Pbla-Luc-TAG system. Figure 1: the 4 networks involved in our project. The modules highlighted by yellow box are signal sensing modules; the ones highlighted by purple box are translation modules 3. Modeling3.1 The signal sensing moduleThe signal sensing module can be easily abstracted as the two following sub-module (figure 2): Figure 2: the sub-modules of signal sensing module The presence of signal (ultraviolet ray exposure or IPTG in our project) causes the repressor protein's releasing from the promoter of intermediate product gene. Then the transcription of intermediate product starts. Intermediate product can be tRNA, aaRS or mRNA. R represents the effective concentration of repressor protein and varies from 0 to 1. I represents the concentration of intermediate product. In the absence of signal, repressor protein regains. Besides, the degradation and other factors will cause the loss of Intermediate product Considering the mechanism of tRNA aminoacylation, this process can be described by double-substrate Michaelis-Menten equation as formula 5. Because of the complicated mechanism of amino acid concentration regulation, we assume that the concentration of amino acid is constant. 3.2 Translation moduleThe translation part is relatively invariable (figure 3). Figure 3: the scheme of translation part When the mRNA of product protein and charged tRNA are both available, our product can be synthesized in the ribosome. The process of a single protein synthesis is composed of the sequential addition of amino acid to the peptide and the pre- and post- translation process. These temporally sequential events can be summarized as the following: n represents the number of total amino acid in the open reading frame in a single mRNA. taa represents the time of the addition of one amino acid. The addition of amino acid can be divided to two parts: the addition of amino acid according to engineered codons, the amount of which is variable, and the addition of amino acid according to native codons, the amount of which is constant. nen represents the number of engineered codons, nnative that of the native codons in a single mRNA. As to a given protein, the pre- and post- translation process is relatively constant. Therefore only the number of engineered codons is variable in the whole process Reciprocal of time is rate. Therefore, the rate of product protein synthesis from a single mRNA is the reciprocal of formula 7. Similarly, the time of amino acid’s addition to the peptide is the reciprocal of its rate v: The rate of amino acid’s addition to the peptide according to a particular codon can be viewed as a first order reaction. Therefore, the rate of protein synthesis according to a single mRNA can be expressed as the following formula: Taken the concentration of mRNA into consideration, the overall rate of protein synthesis is: During the synthesis of protein some charged tRNA are converted into uncharged tRNA Due to the accumulation of metabolic waste and the consumption of resources in the cell, the synthesis of protein will slow down as the bacteria culture reaches stationary phase. Besides, the tandem of rare codons demand that charged tRNA consecutively particulates in the protein synthesis. The more charged tRNA required at one time, the more obvious the resource shortage is: Therefore, the slowing down of protein synthesis is more obvious. So it is reasonable to assume the following relation 4. Simulation and Discussion4.1 Typical Dynamic Process of ModulatingThe model summarizes a typical dynamic process of Modulating: external signal releasing intermediate product: sulA promoter-tRNAArgW ; the net result of synthesis and consumption of charged tRNA corresponding to tandem rare codons; accumulation of product protein. The induction begins when t=0 min. Fig 4: external signal releasing intermediate product. This figure shows the intermediate product of Modulating stimulated by IPTG induction: tRNAArgW Fig 5: the net result of synthesis and consumption of charged tRNA corresponding to engineered rare codons. This figure shows the amount of charged tRNA over time in LacI-Ptrc-tRNAArgW and PT7-luc-4AGG system. 4.2 Comparison of Different Promoters and Different Numbers of Rare CodonsFig 7: the yield of product protein in LacI-Ptrc-tRNAArgW and Pbla-Luc-nAGG(n=2, 4, 6, 8) system Fig 8: the yield of product protein in LacI-Ptrc-tRNAArgW and PT7-Luc-nAGG(n=2, 4, 6, 8) system Fig 9: Comparison of final yield of reporter gene with different numbers of AGG codon and under different promoter 5. ConclusionOur model correctly predicts the effect on the net result of different promotor and that of the number of rare codon in the initial end of reporter gene: Strong promoter (eg. T7 promoter) leads to higher yield of product. Besides that, the concentration of charged tRNA is lower in the presence of strong promoter due to fast consumption. Furthermore, according to formula 14, low charged tRNA concentration promotes the sensitiveness to the number of rare codons. In short, the reporter gene with strong promoter can achieve a more stable performance, which accords with our experiment data. |
 "
"
