Team:Bielefeld-Germany/SinceAmsterdam
From 2011.igem.org

Contents |
BPA degradation
Specificity of bisphenol A degradation with E. coli
In order to access the specificity of the bisphenol A degradation by the bisdA | bisdB fusion protein we tested how well two similar bisphenols, bisphenol F (BPF) and bisphenol S (BPS), were employed. The structure of those bisphenols differs only in the chemical group linking the two phenols from that of bisphenol A (see Figure 1).
BPF and BPS are used in a broad range of applications that involve the use of polycarbonates or epoxy resins and thus can often be found were BPA is also present. Accordingly their presence is a potential disruptive factor that could lead to a false positive signal with our biosensor. This is especially true for BPS that in some cases is used as a substitute for BPA in baby bottles [http://www.nytimes.com/2011/04/18/business/global/18iht-rbog-plastic-18.html]. Studies concerning the environmental pollution with BPF ([http://www.sciencedirect.com/science/article/pii/S0043135401003670 Fromme et al. (2002)]) and the acute toxicity, mutagenicity and estrogenicity of BPF and BPS ([http://www.sciencedirect.com/science/article/pii/S0043135401003670 Chen et al. (2001)] and [http://toxsci.oxfordjournals.org/content/84/2/249 Kitamura et al. (2005)]) indicate their potential harmfulness but further research is needed to fully access their impact on human health.
E. coli KRX carrying genes for the bisdA | bisdB fusion protein behind the medium strong constitutive promoter <partinfo>J23110</partinfo> with RBS <partinfo>B0034</partinfo> was cultivated at 30 °C for 36 h with LB-Medium containing 120 mg L-1 BPA, BPF respectively BPS. The BPF and BPS concentration where determined with a HPLC using the same method as with BPA. Figure 2 shows the degradation of the respective bisphenol after 24 h of cultivation in percent.
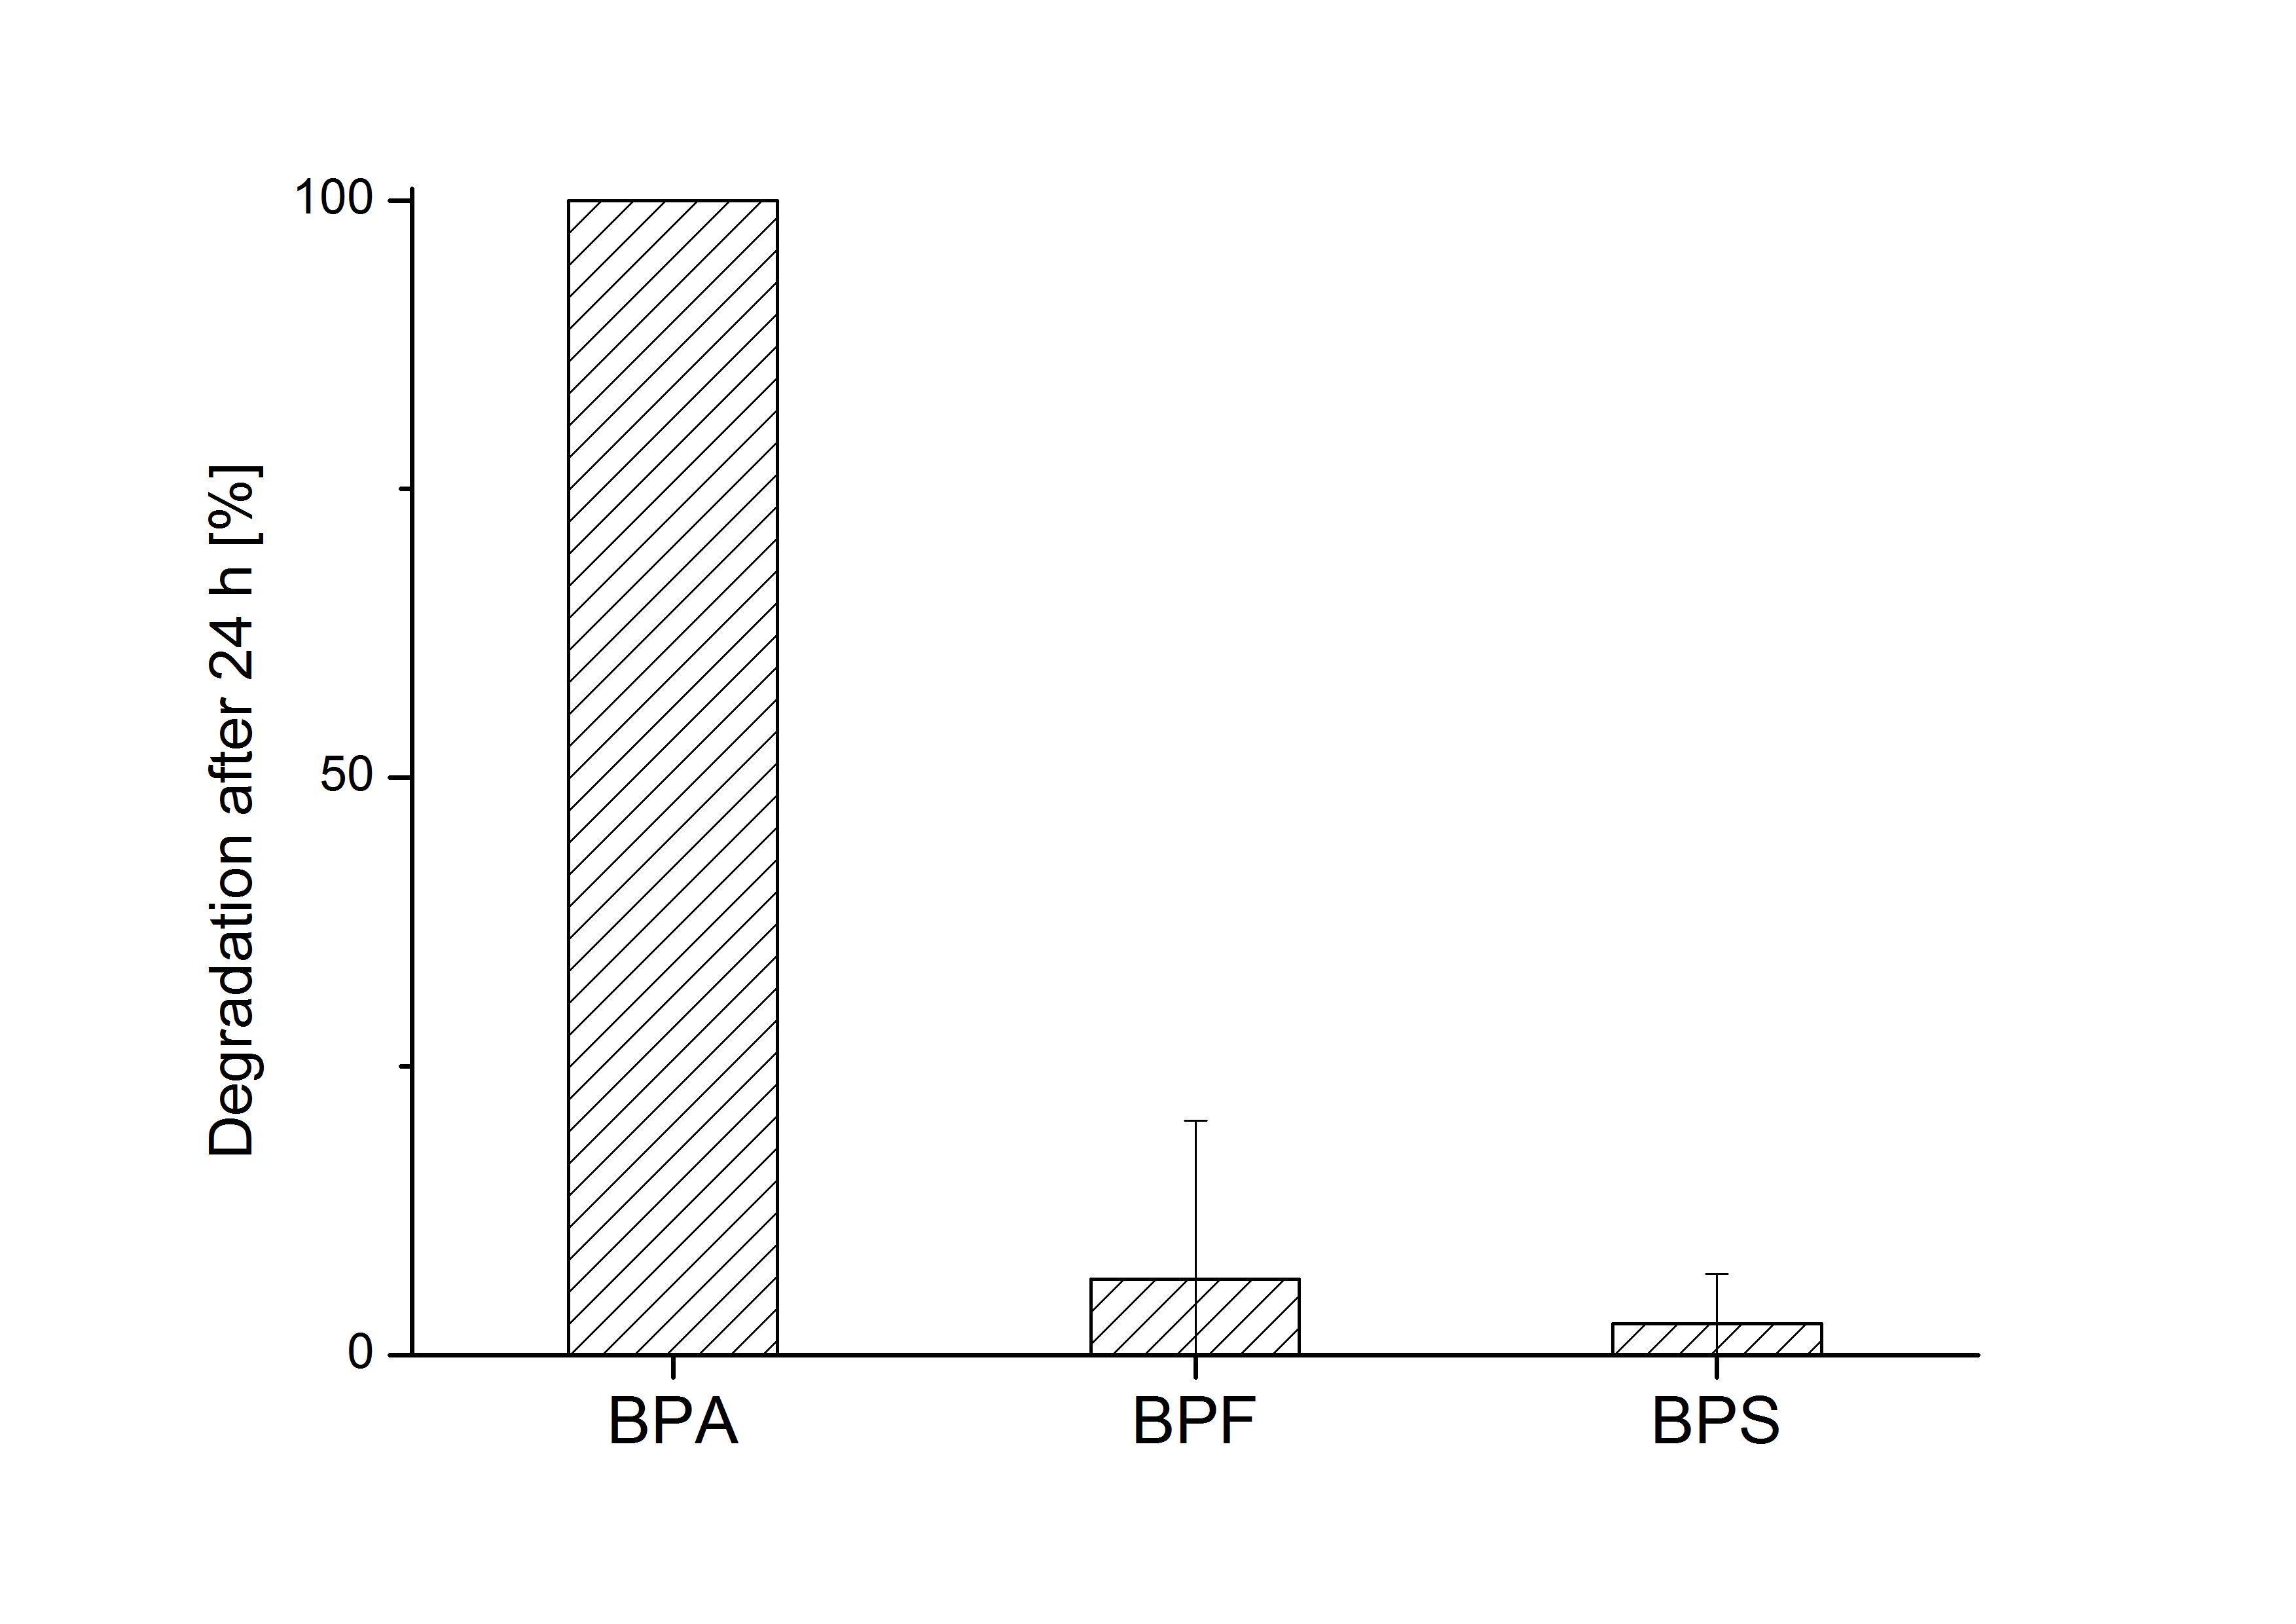
The results of the experiment indicate that the bisdA | bisdB fusion protein has a high specificity for the degradation of BPA. In addition it is possible that the decrease in BPF and BPS concentration is due to internalization of those bisphenols or a endogenous enzyme of E. coli KRX and not the bisdA | bisdB fusion protein was responsible. It can be assumed that false positive signals because of BPF or BPS present in a sample are unlikely.
BPA degradation with constructs containing FNR
Constructs containing FNR, BisdA and BisdB polycistronic <partinfo>K525551</partinfo>, FNR and a fusion protein of BisdA and BisdB <partinfo>K525582</partinfo> and a fusion protein of FNR, BisdA and BisdB <partinfo>K525560</partinfo> were tested for their ability to degrade BPA. Cultivations were done using the same conditions as with previous constructs. The results are shown in figure 3 below.
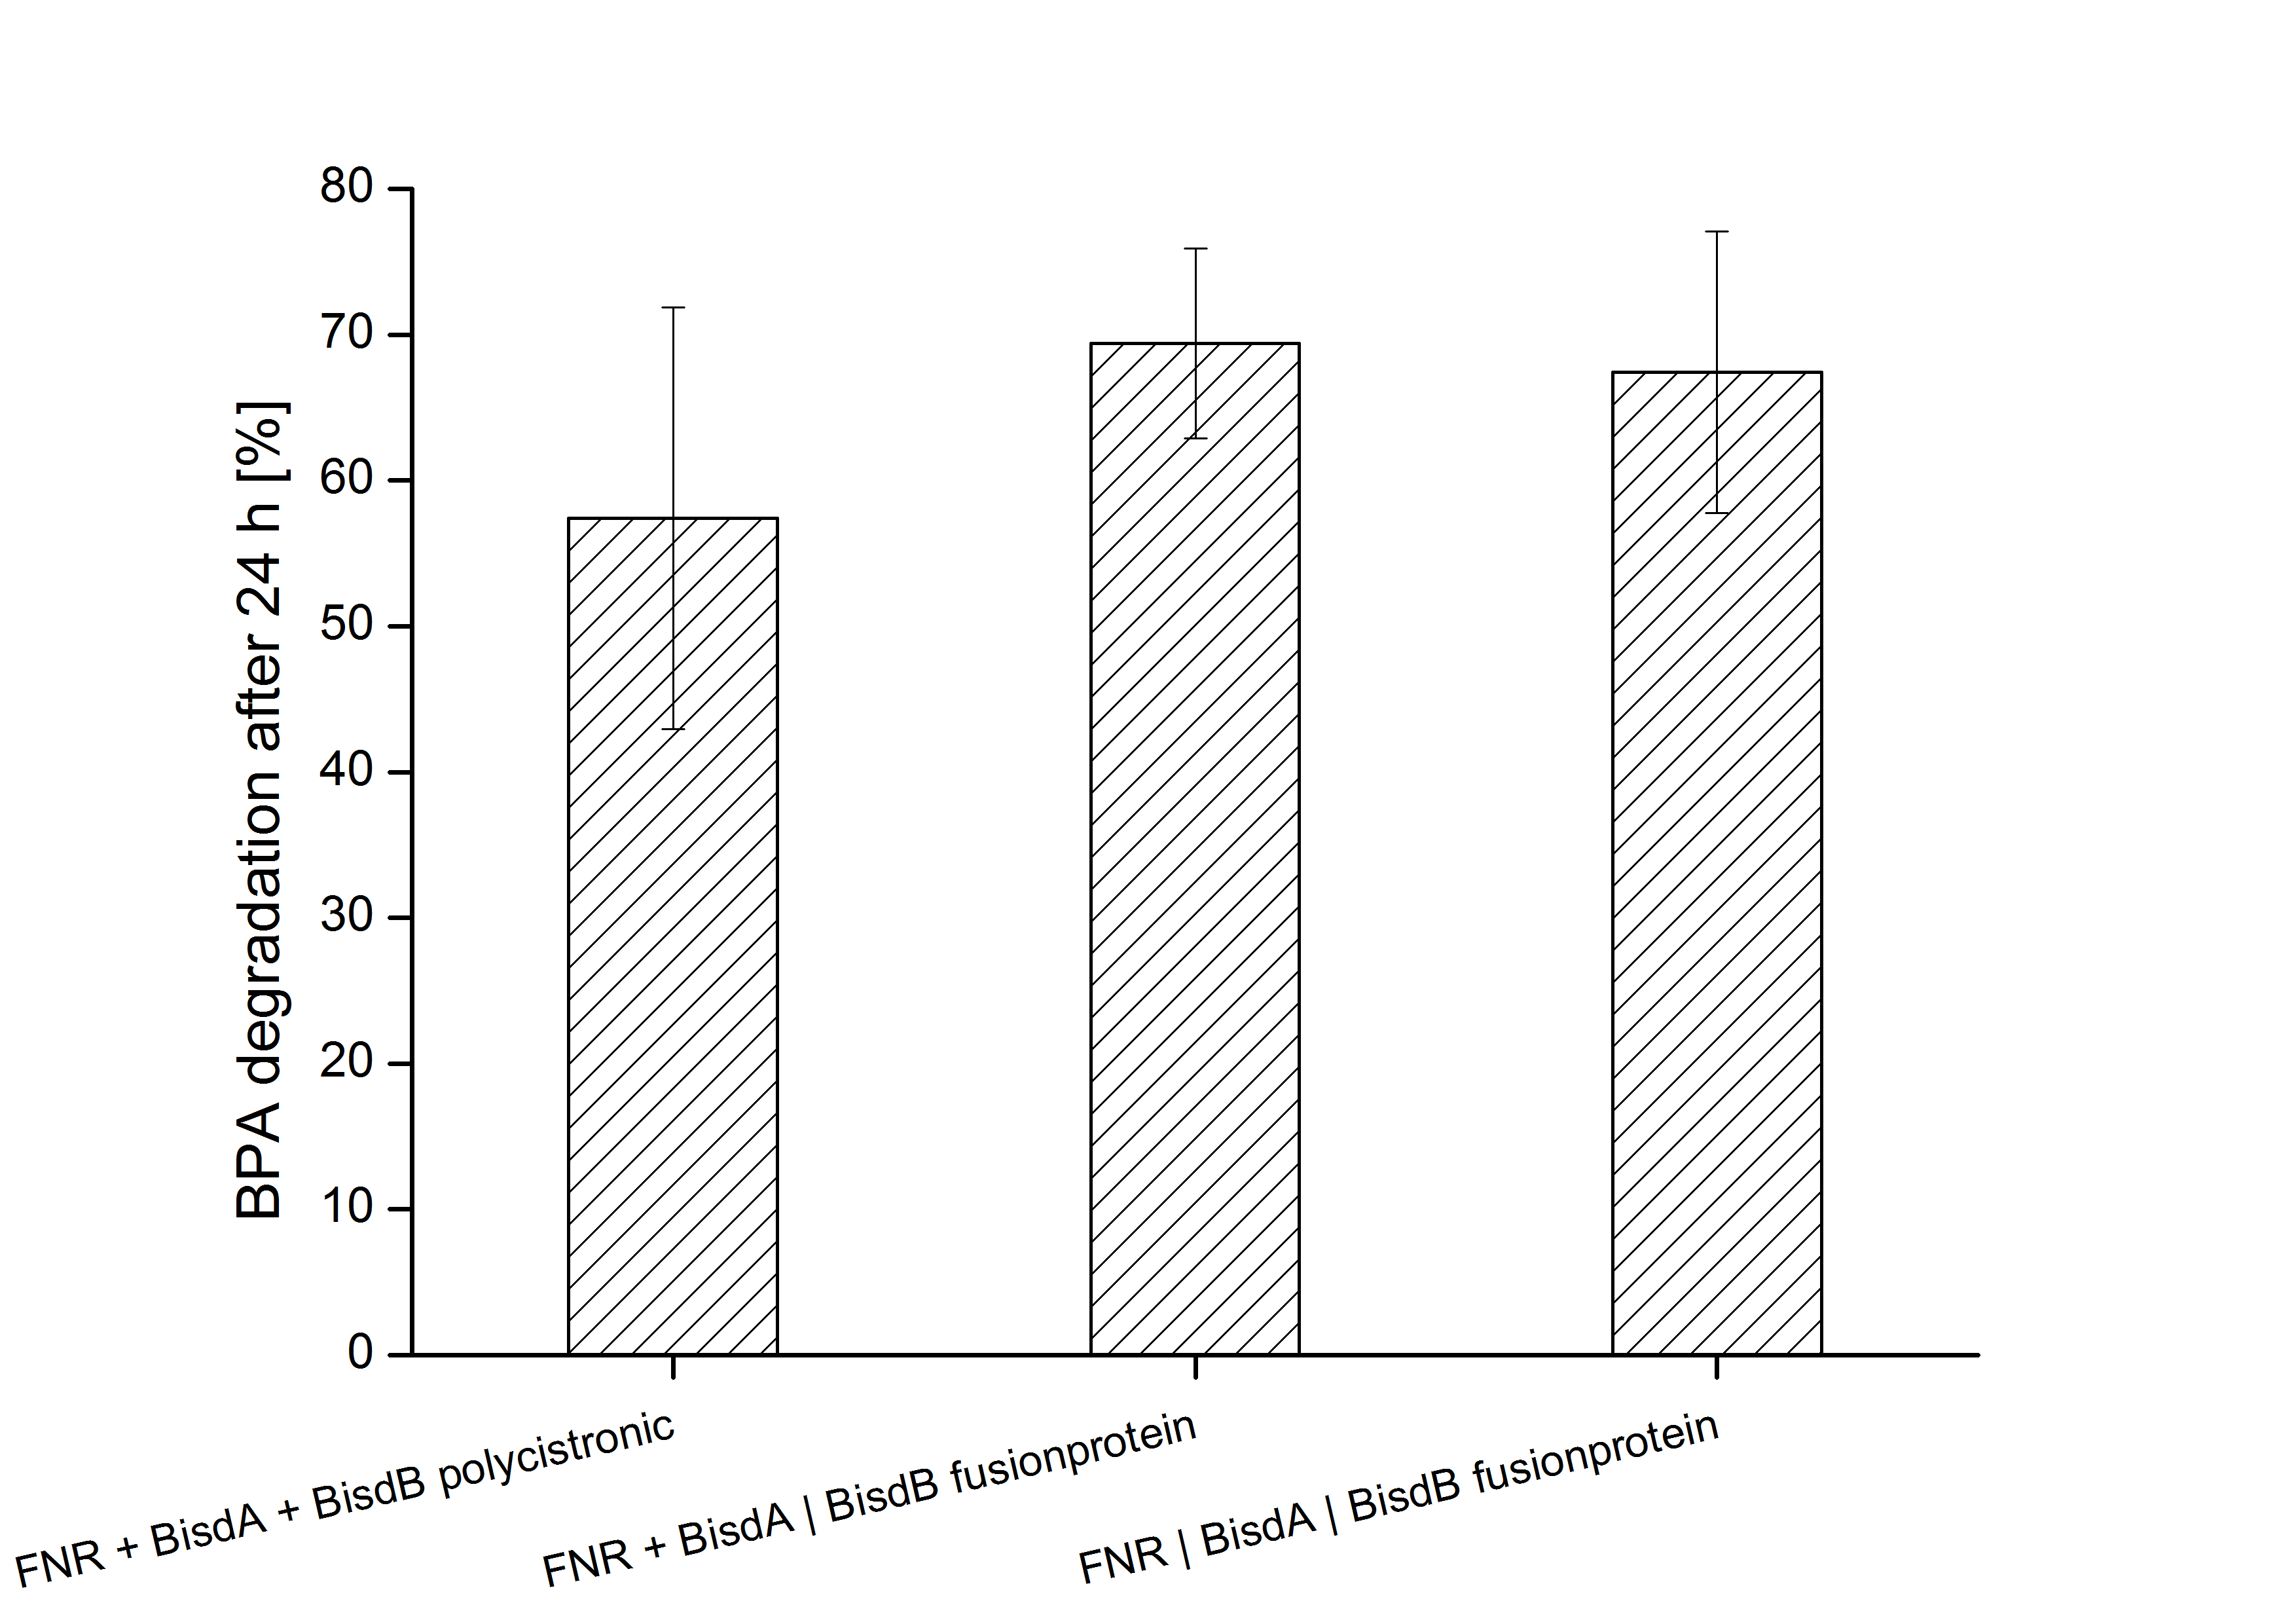
The results indicate that the BPA degradation was improved using fusion proteins compared to the completely polycistronic construct. Also the fusion protein of all three enzymes involved in the degradation of BPA worked as intended which is quite impressive.
Model for the fusion protein between FNR, BisdA and BisdB
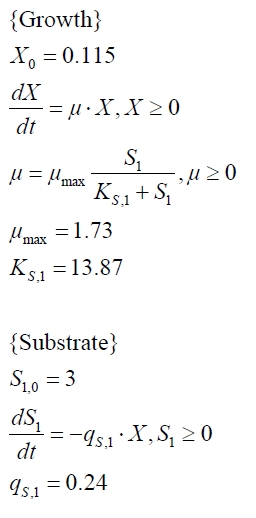
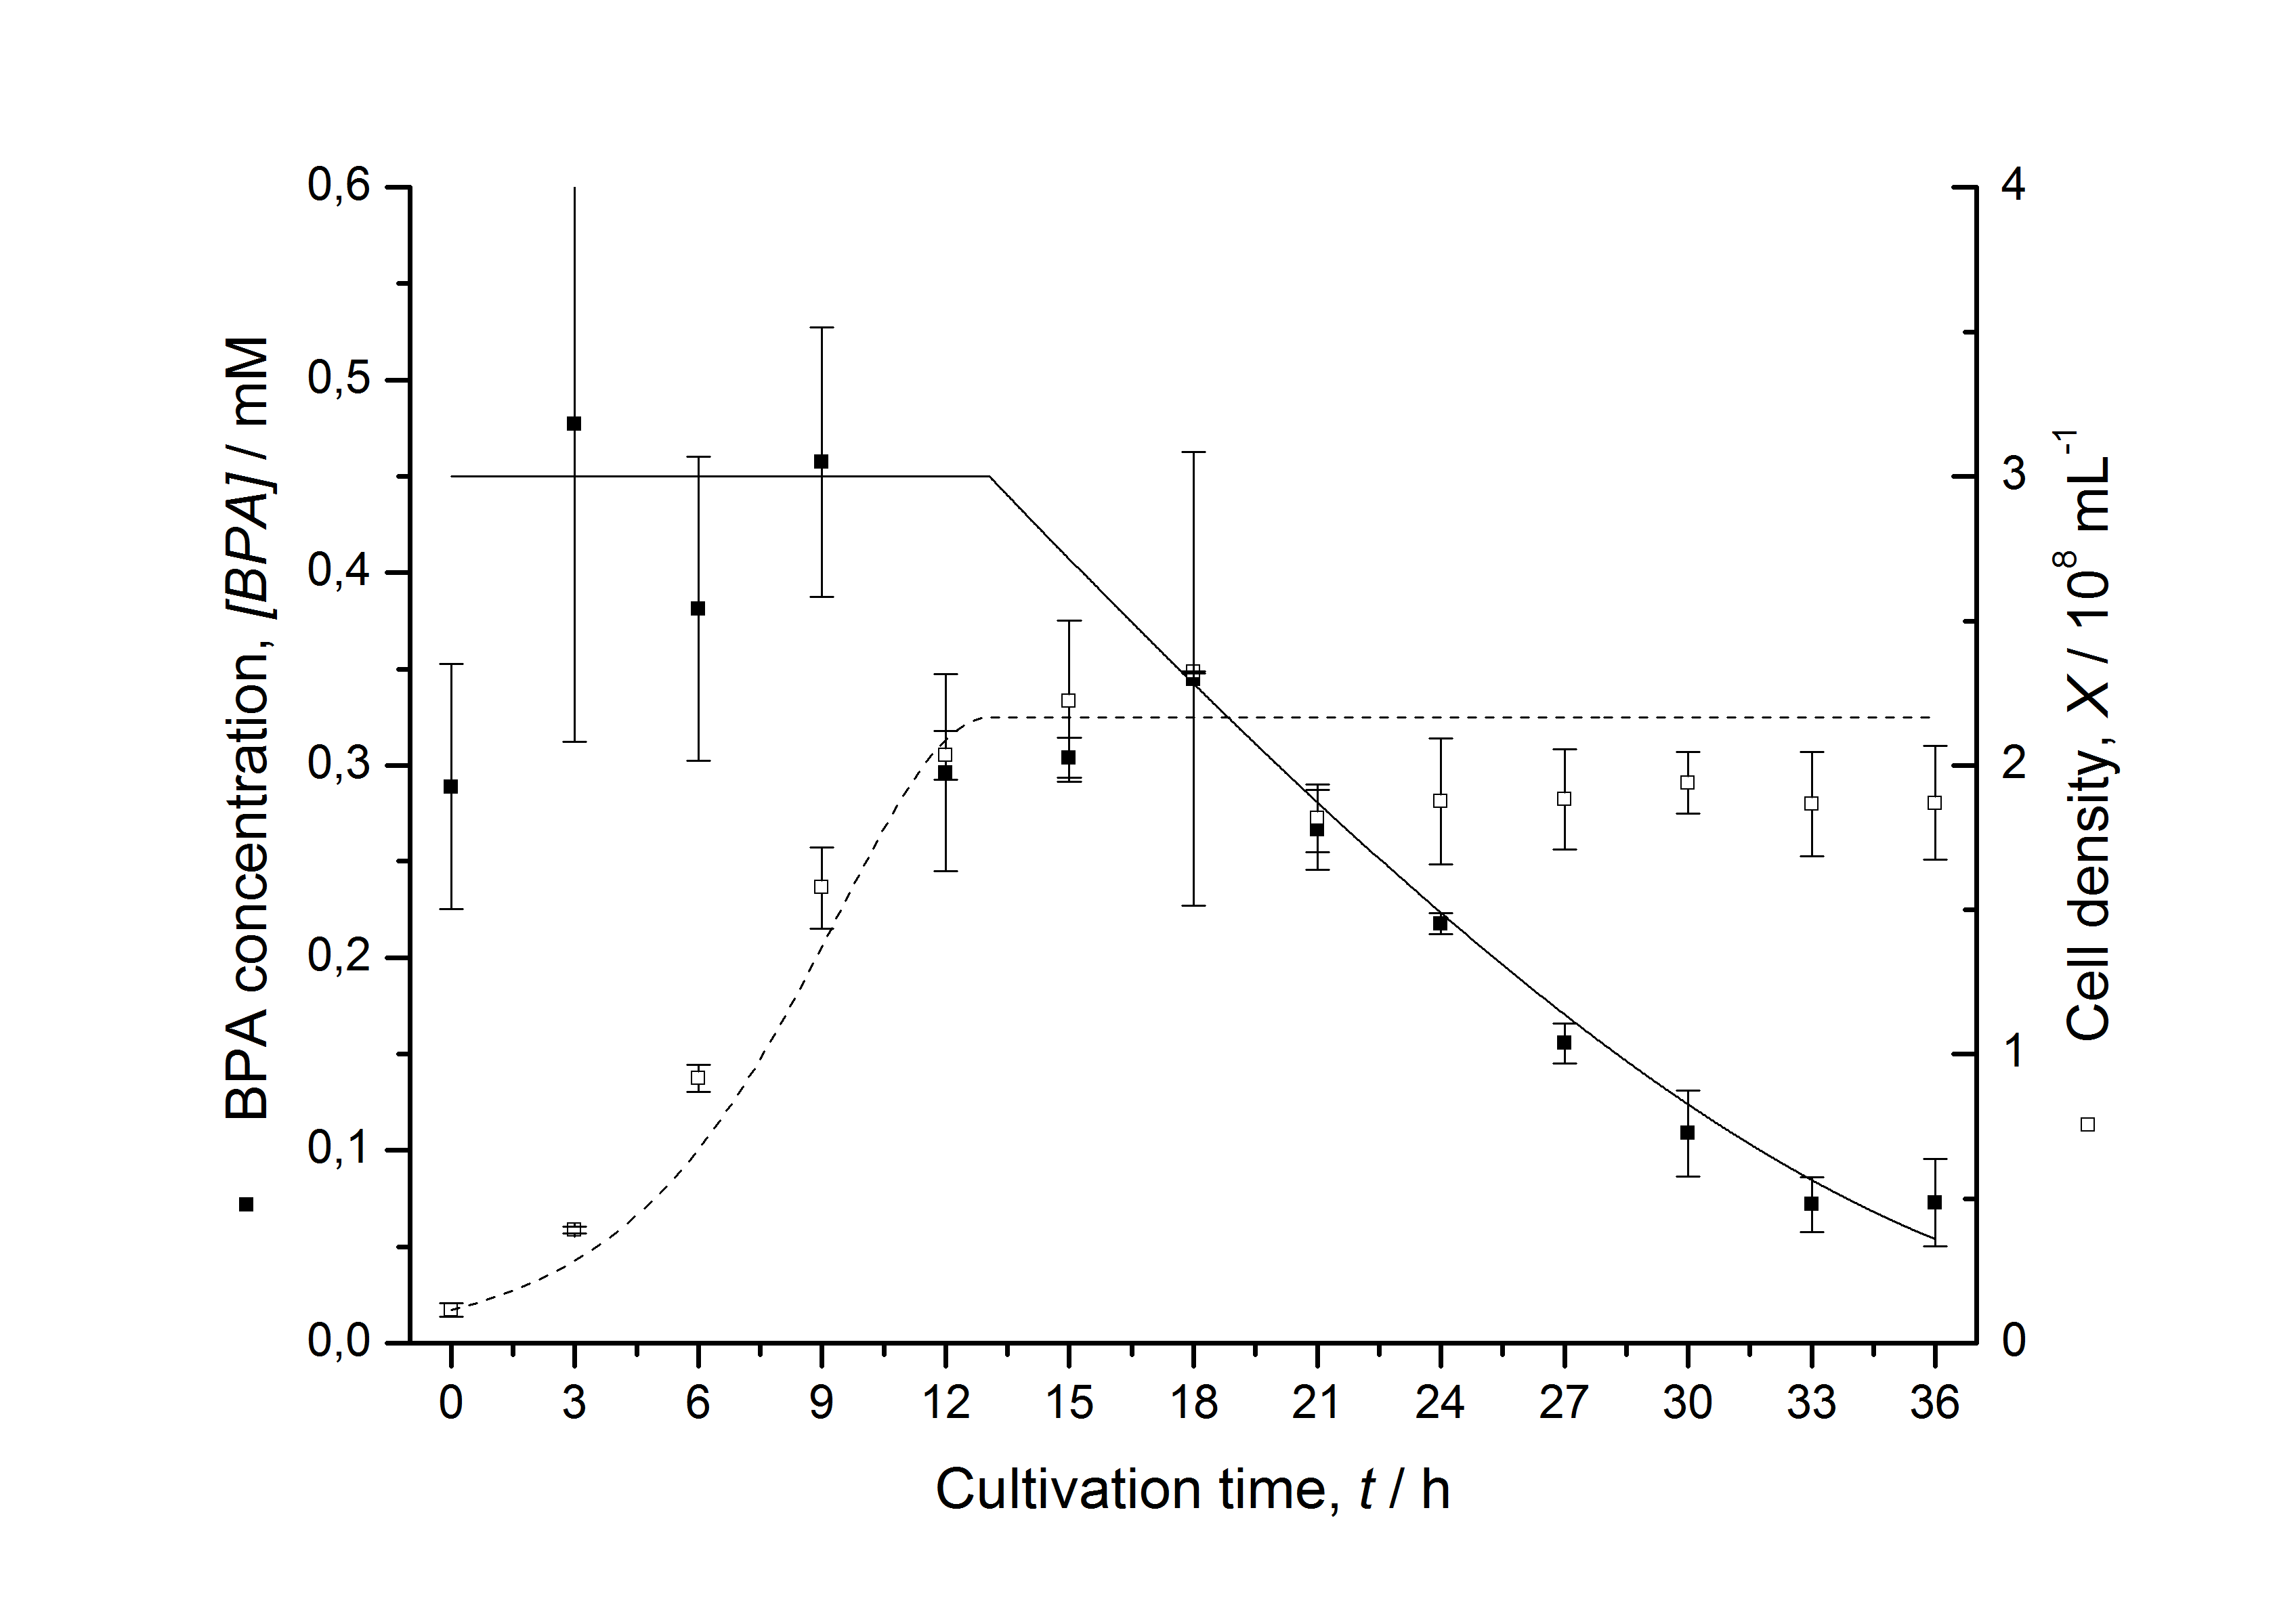
The cultivations and BPA degradation of E. coli KRX carrying a fusion protein consisting of ferredoxin-NADP+ oxidoreductase, ferredoxinbisd and cytochrome P450bisd differ from the cultivations with the other BPA degrading BioBricks. Thus, the model for these cultivations has to be adjusted to this behaviour. First of all, no diauxic growth is observed so the growth can be modelled more easily like
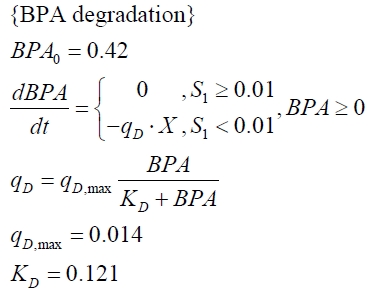
The BPA degradation starts when the imaginary substrate is depleted, like observed in the other cultivations with BPA degrading BioBricks. But it seems that the BPA degradation is getting slower with longer cultivation time. So it is modelled with a Monod-like term in which the specific BPA degradation rate is dependent from the BPA concentration:
with the maximal specific BPA degradation rate qD,max and the constant KD.
Figures 13 shows a comparison between modelled and measured data for cultivations with BPA degrading fusion protein E. coli. In Tab. 1 the parameters for the model are given, obtained by curve fitting the model to the data.
Comparison between modelled and measured data
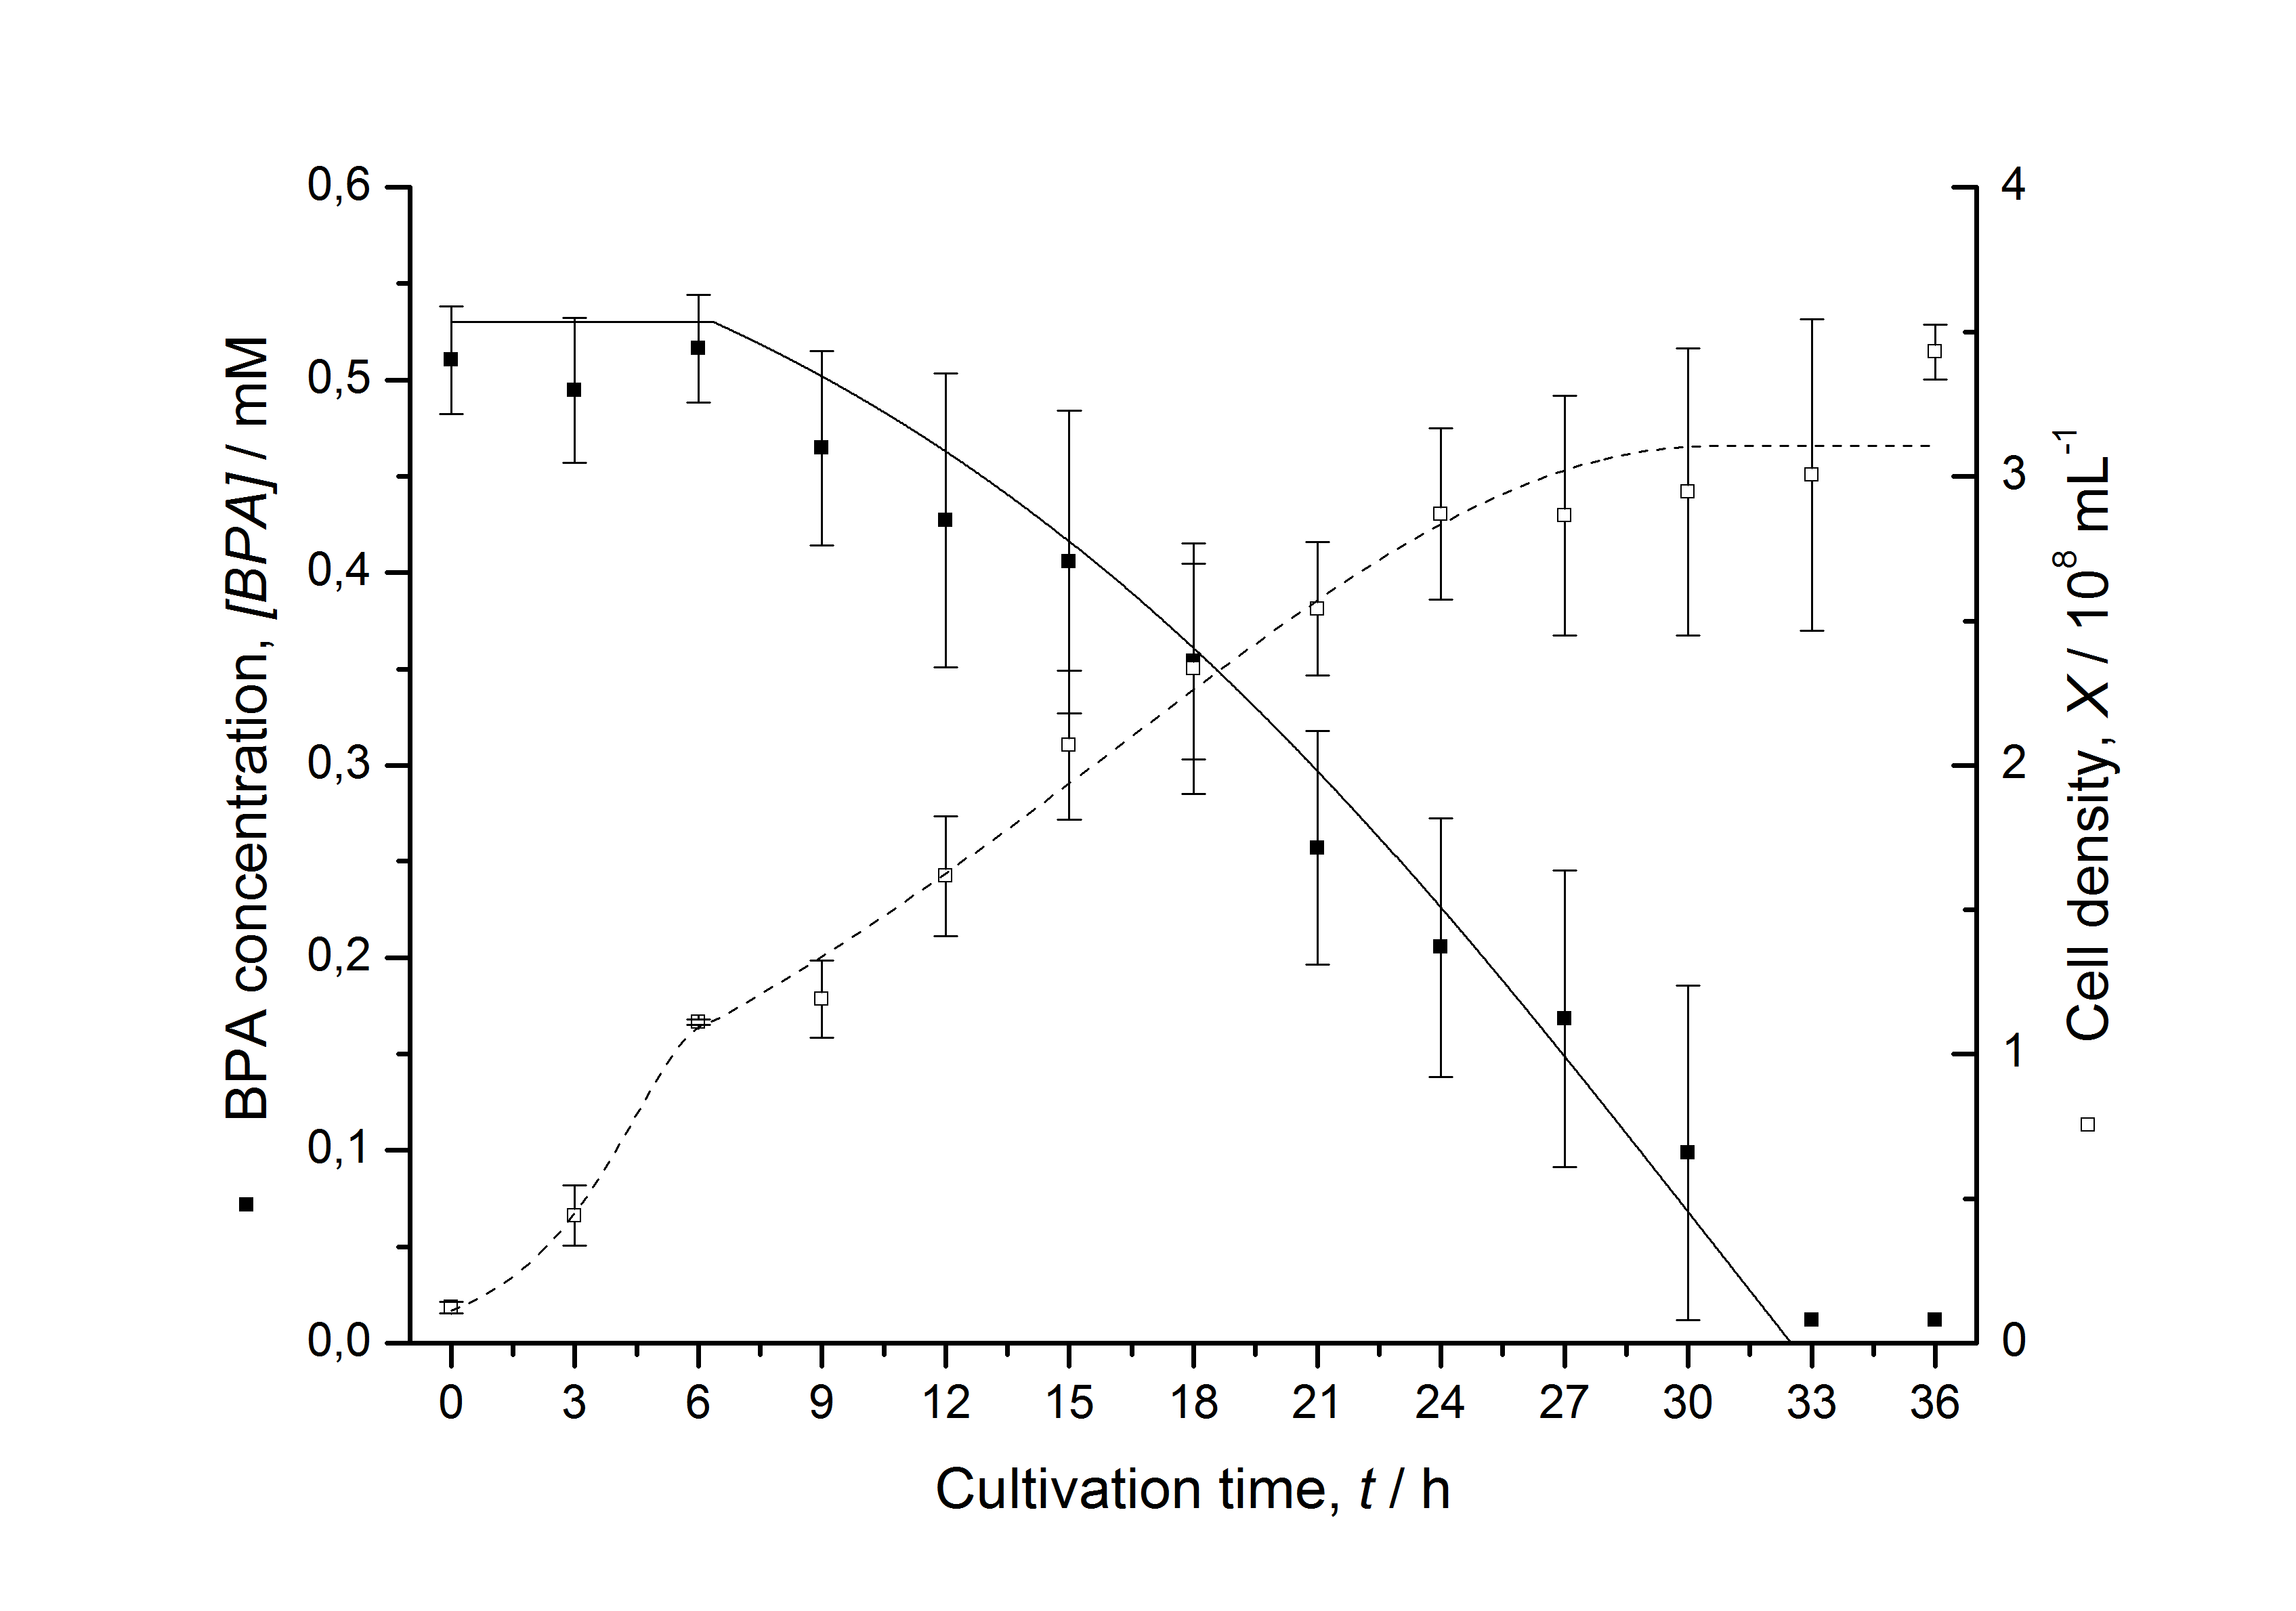
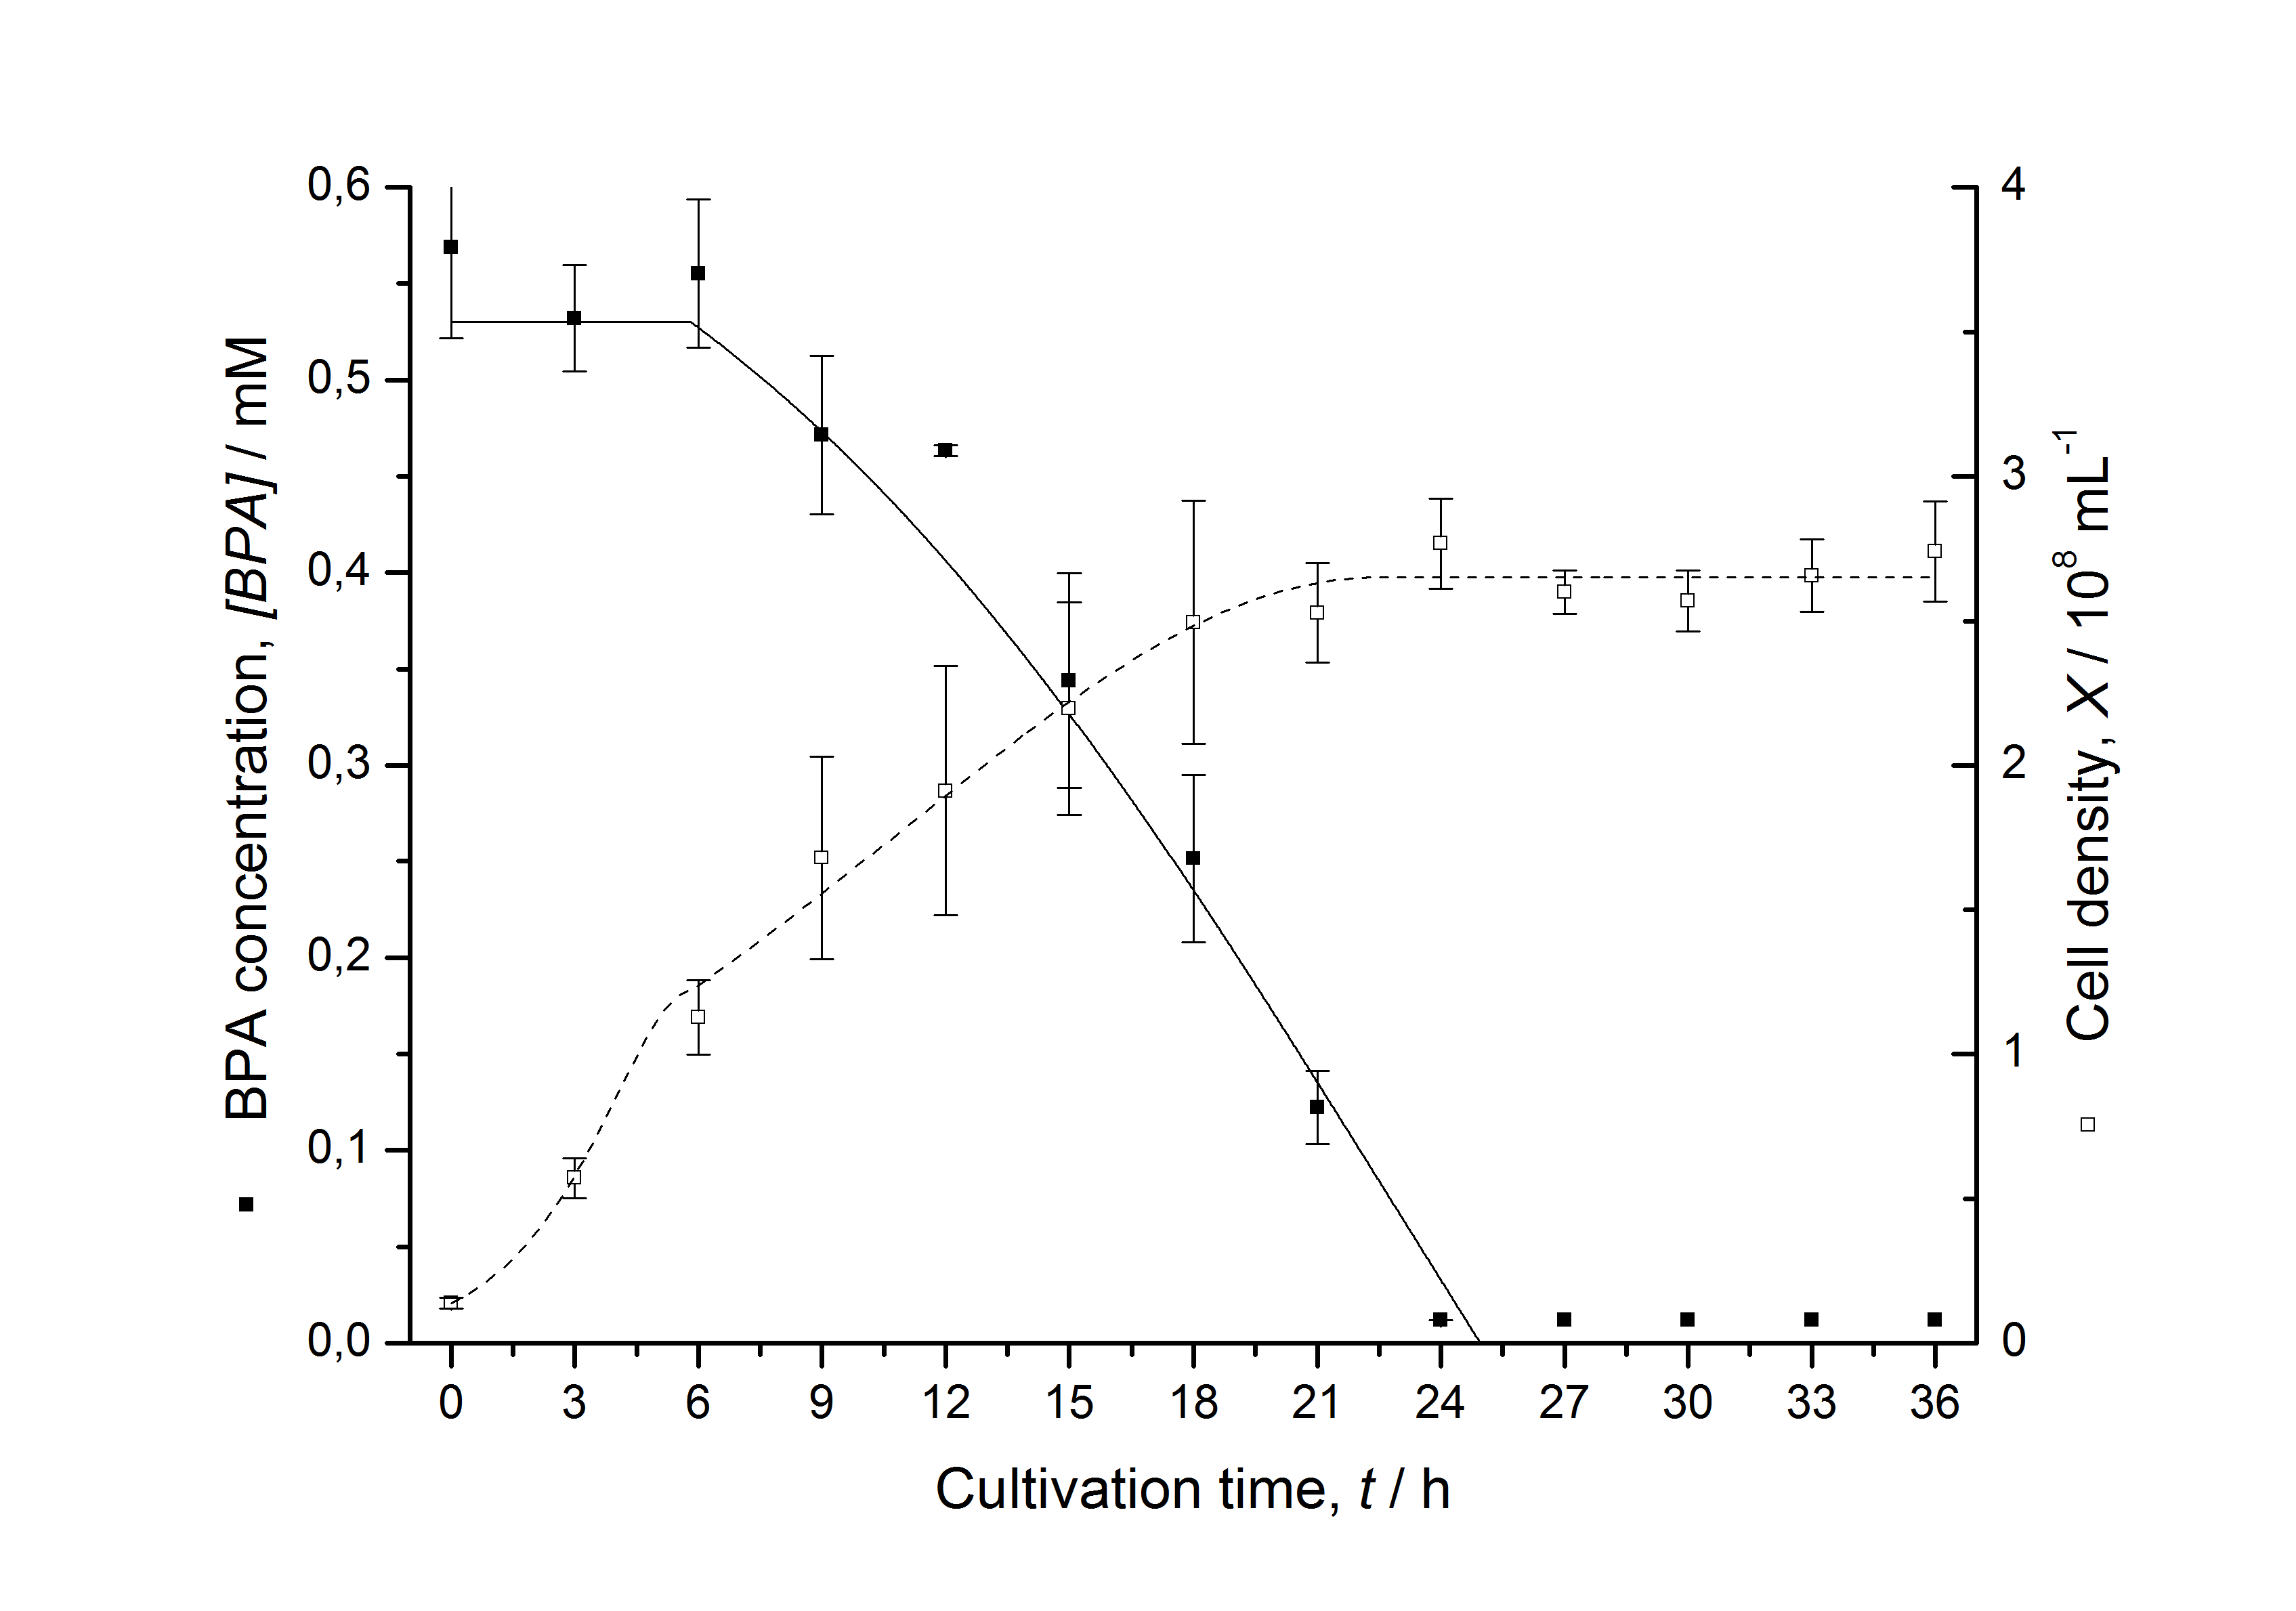
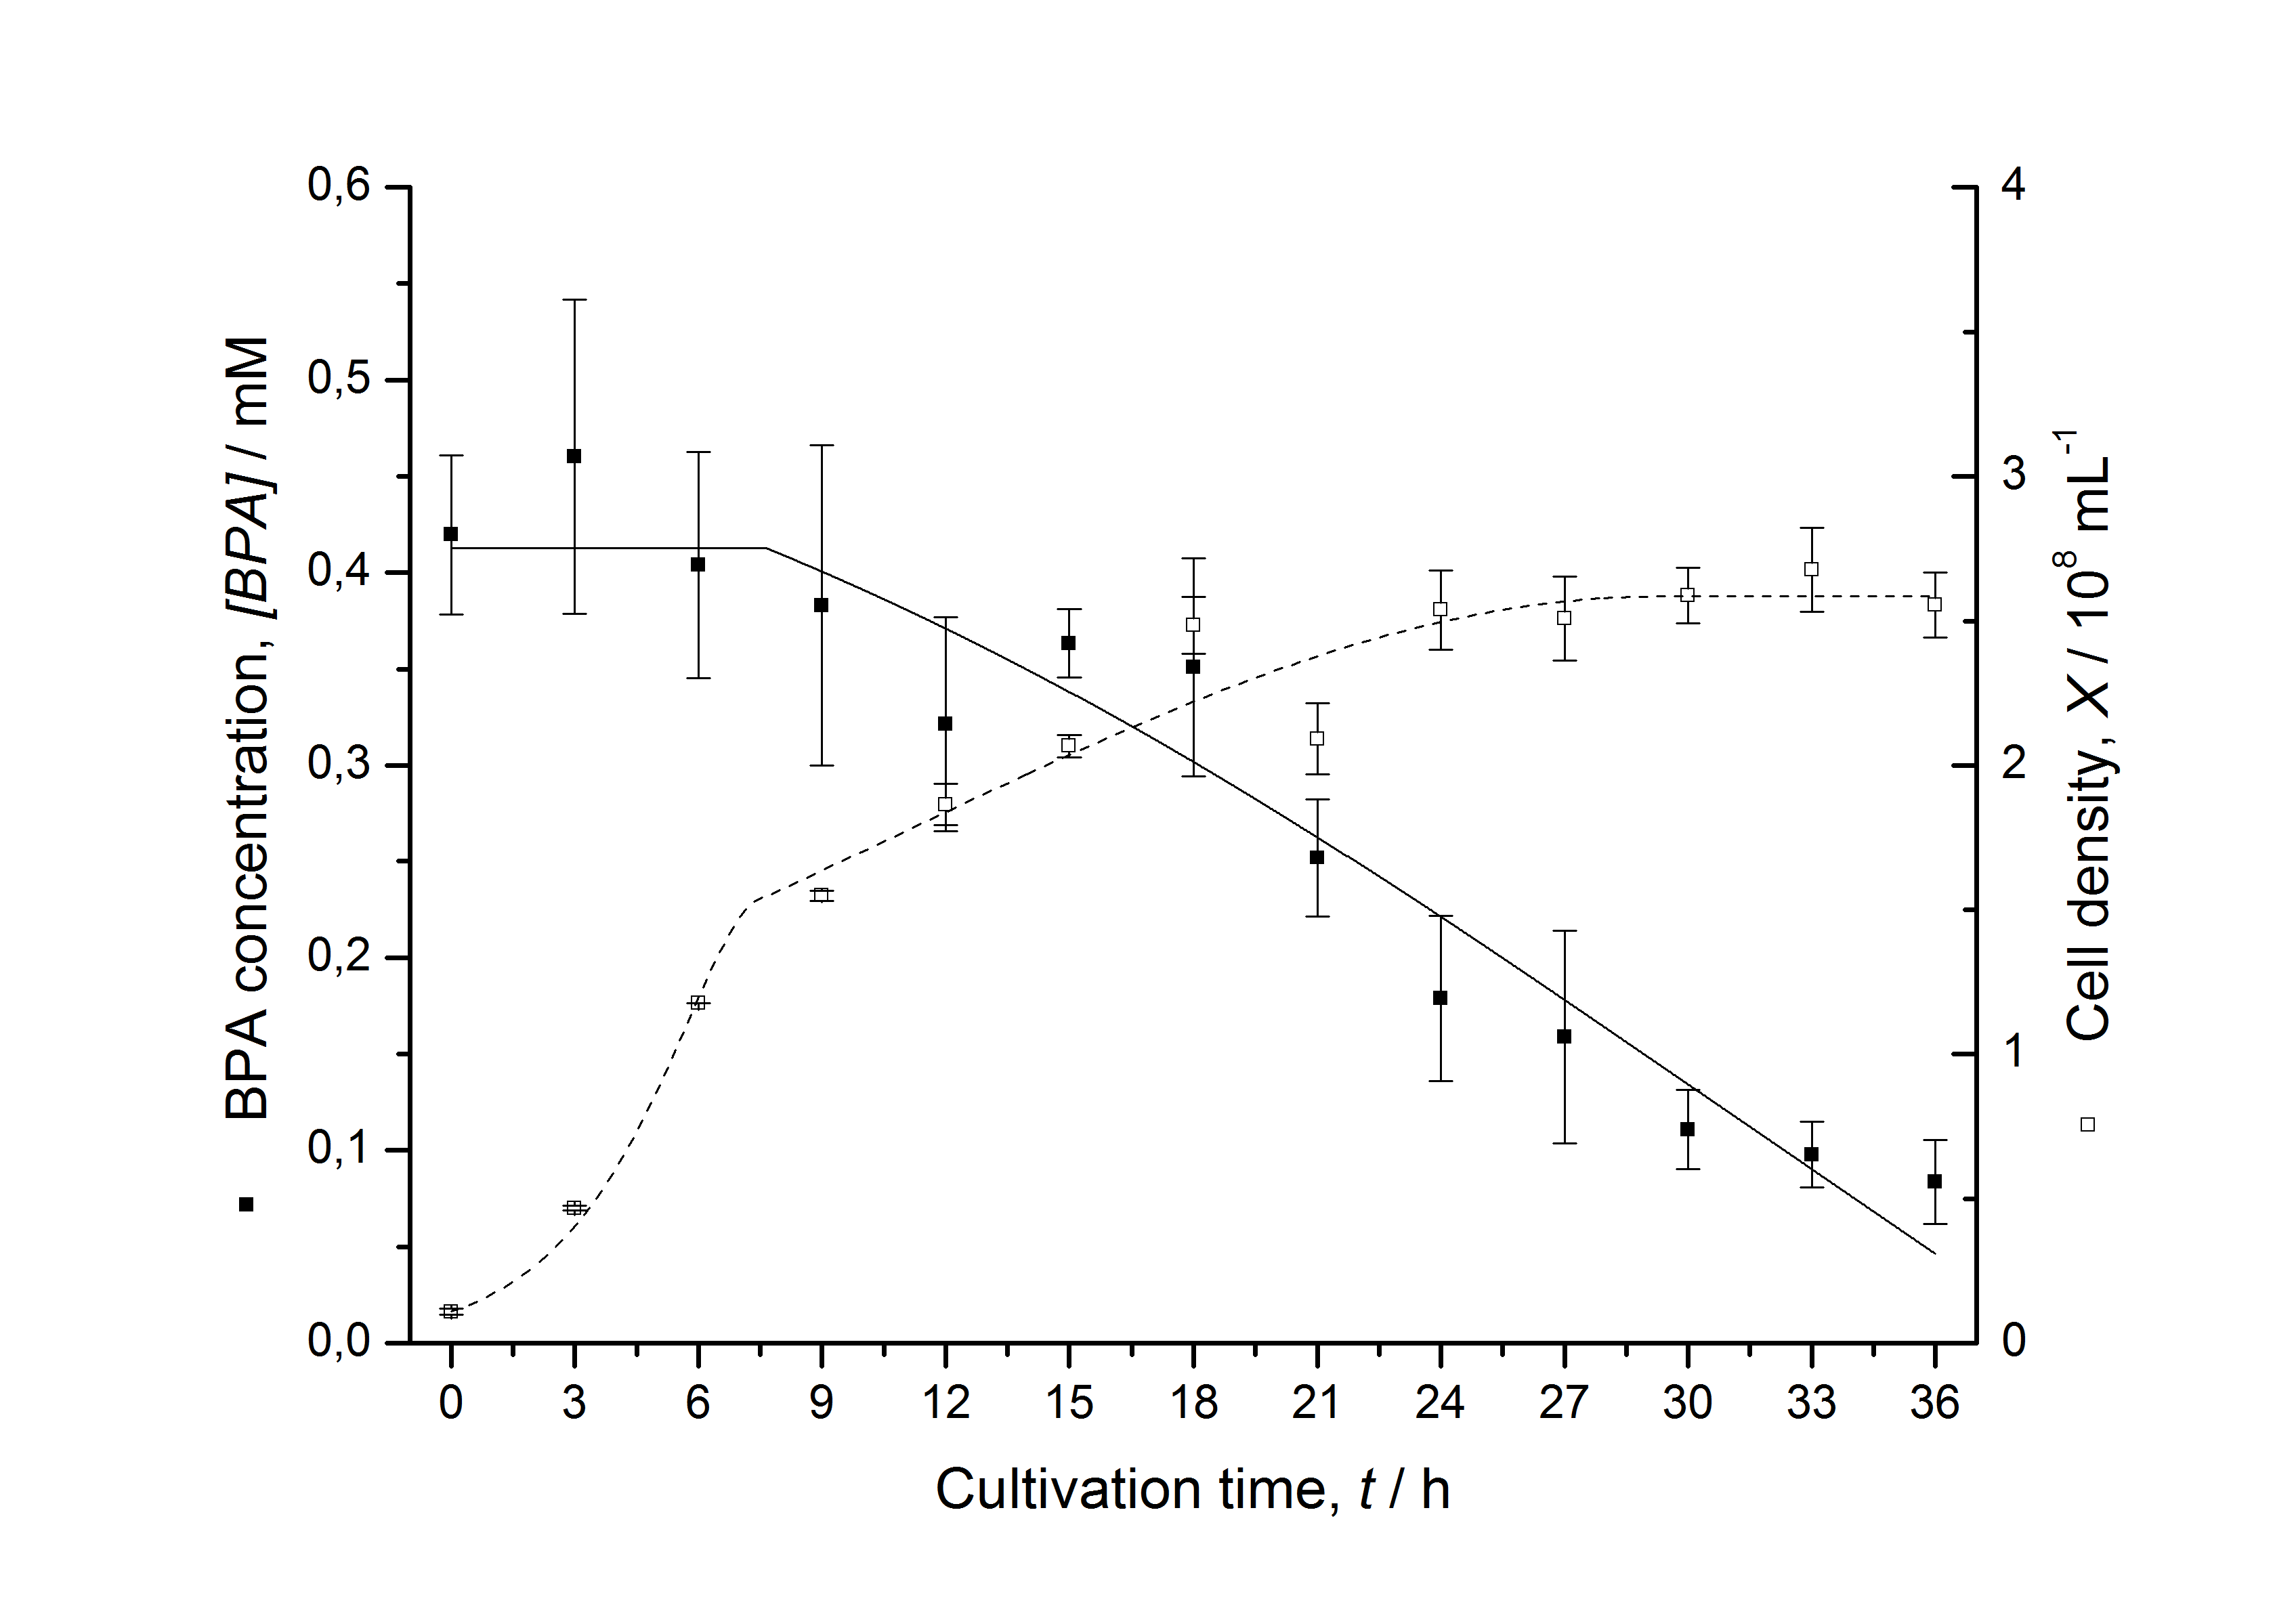
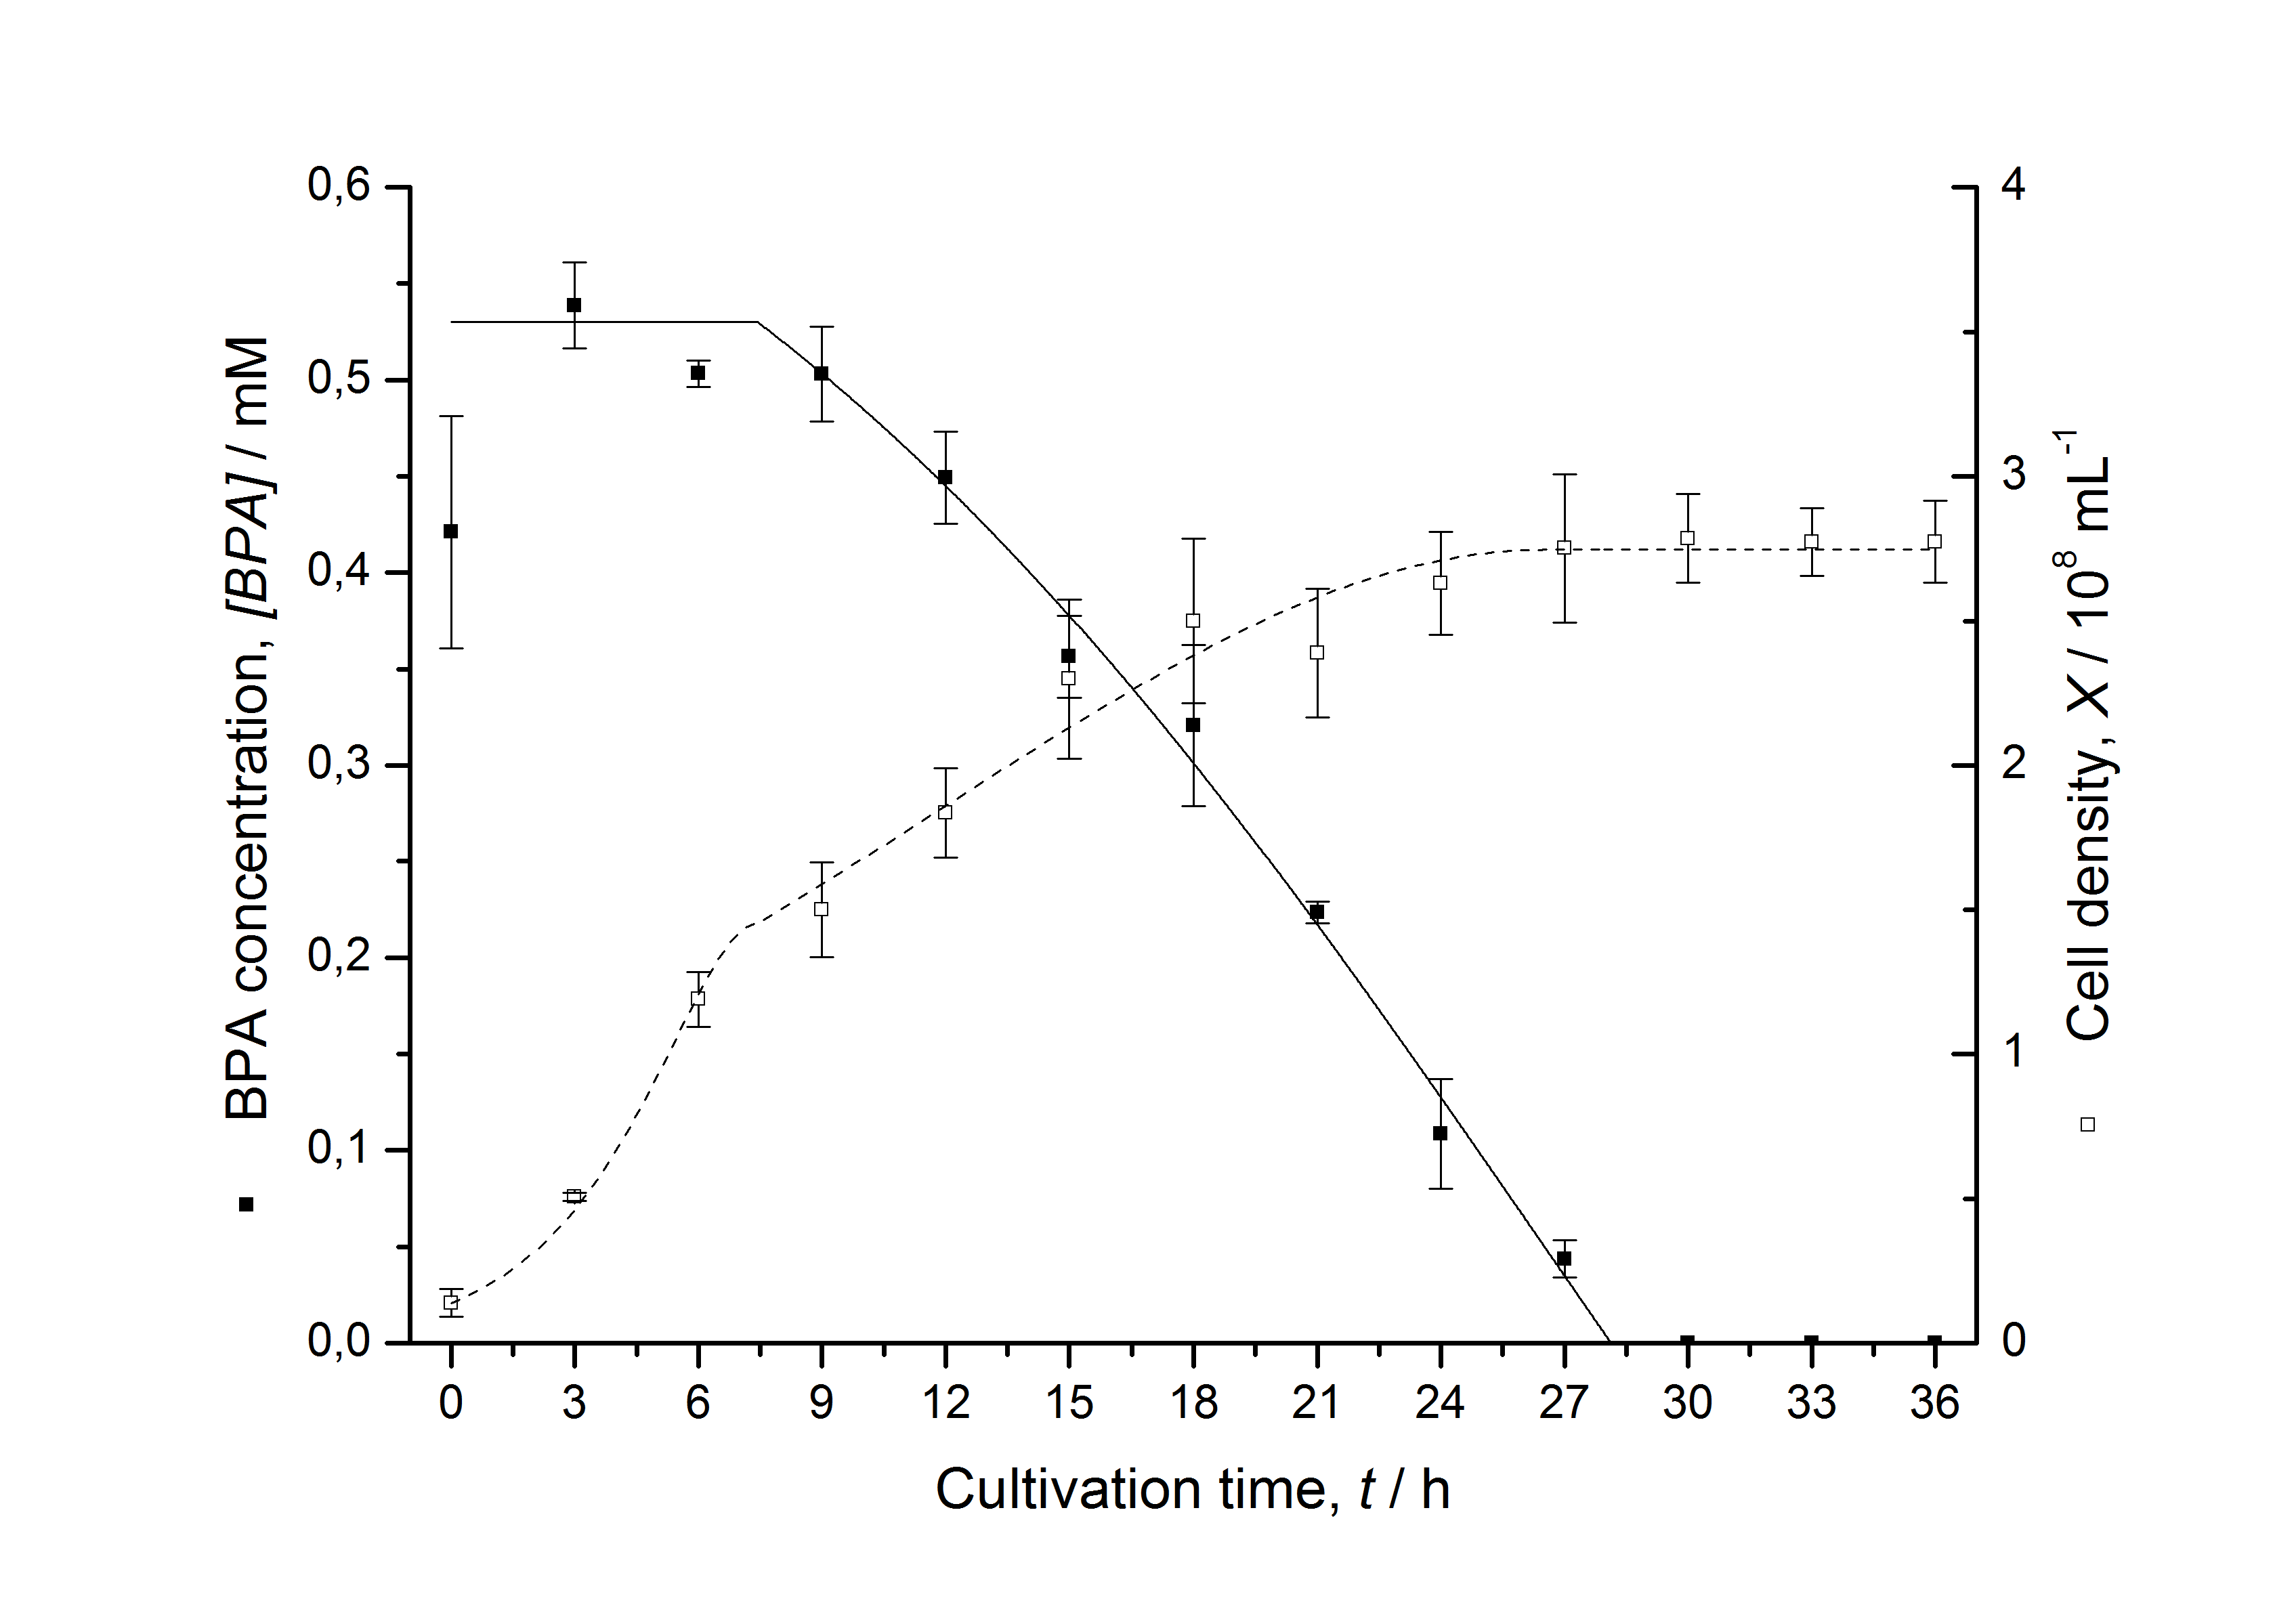
Tab. 1: Parameters of the model.
| Parameter | <partinfo>K525512</partinfo> | <partinfo>K525517</partinfo> | <partinfo>K525552</partinfo> | <partinfo>K525562</partinfo> | <partinfo>K525582</partinfo> |
|---|---|---|---|---|---|
| X0 | 0.112 108 mL-1 | 0.138 108 mL-1 | 0.109 108 mL-1 | 0.115 108 mL-1 | 0.139 108 mL-1 |
| µmax | 1.253 h-1 | 1.357 h-1 | 0.963 h-1 | 1.730 h-1 | 0.858 h-1 |
| KS,1 | 2.646 AU-1 | 1.92 AU-1 | 5.35 AU-1 | 13.87 AU-1 | 3.05 AU-1 |
| KS,2 | 265.1 AU-1 | 103.1 AU-1 | 82.6 AU-1 | - | 32.5 AU-1 |
| S1,0 | 1.688 AU | 1.166 AU | 4.679 AU | 3.003 AU | 2.838 AU |
| qS,1 | 0.478 AU 10-8 cell-1 | 0.319 AU 10-8 cell-1 | 0.883 AU 10-8 cell-1 | 0.240 AU 10-8 cell-1 | 0.544 AU 10-8 cell-1 |
| S2,0 | 16.091 AU | 6.574 AU | 3.873 AU | - | 2.402 AU |
| qS,2 | 0.295 AU 10-8 cell-1 | 0.191 AU 10-8 cell-1 | 0.082 AU 10-8 cell-1 | - | 0.056 AU 10-8 cell-1 |
| BPA0 | 0.53 mM | 0.53 mM | 0.41 mM | 0.45 mM | 0.53 mM |
| qD | 8.76 10-11 mM cell-1 | 1.29 10-10 mM cell-1 | 5.67 10-11 mM cell-1 | - | 1.13 10-10 mM cell-1 |
| qD,max | - | - | - | 1.32 10-10 mM cell-1 | - |
| KD | - | - | - | 0.121 mM-1 | - |
The specific BPA degradation rate per cell qD is about 50 % higher when using the fusion protein compared to the polycistronic bisdAB gene. This results in an average 9 hours faster, complete BPA degradation by E. coli carrying <partinfo>K525517</partinfo> compared to <partinfo>K525512</partinfo> as observed during our cultivations. The fusion protein between BisdA and BisdB improves the BPA degradation by E. coli. Introducing a polycistronic ferredoxin-NADP+ reductase gene into these systems does not lead to a higher specific BPA degradation rate. The rates are a bit lower, though. The effect that the BisdA | BisdB fusion protein is more efficient than BisdB when expressed polycistronically with BisdA can still be observed in this setup. The cultivations with the expression of the fusion protein FNR | BisdA | BisdB differ from the expression of the other BPA degrading BioBricks. The BPA degradation rate is concentration dependent which is typical for enzymatic reactions but was not observed in the other cultivations. In addition, the growth was faster and not diauxic. The maximal specific BPA degradation rate of this BioBrick is higher than the observed specific BPA degradation rates in the other cultivations. But due to the dependence of the BPA degradation from the BPA concentration the BPA degradation with this BioBrick is not as efficient and not complete. Anyway, the fact that this BioBrick is working is impressive.
 "
"


