Team:USTC-China/Project/modeling
From 2011.igem.org
<a href= "#results ">results</a> <a href= "#odes "> odes and equations</a> <a href= "#paras "> parameters and references</a> </p>
<a name="results" id=""></a>
Contents
|
[<a href="/wiki/index.php?title=Team:USTC-China/Project/modeling&action=edit§ion=1" title="Edit section: results">edit</a>] results
results
We have been working hard to model our system. Now see what we have done
Firstly, we would like to present some basic character of our system
In a single cell, the system acts like a fast switch upon AHL concentration, on the other hand, cheZ ouput is a slow switch of theophylline concentration.
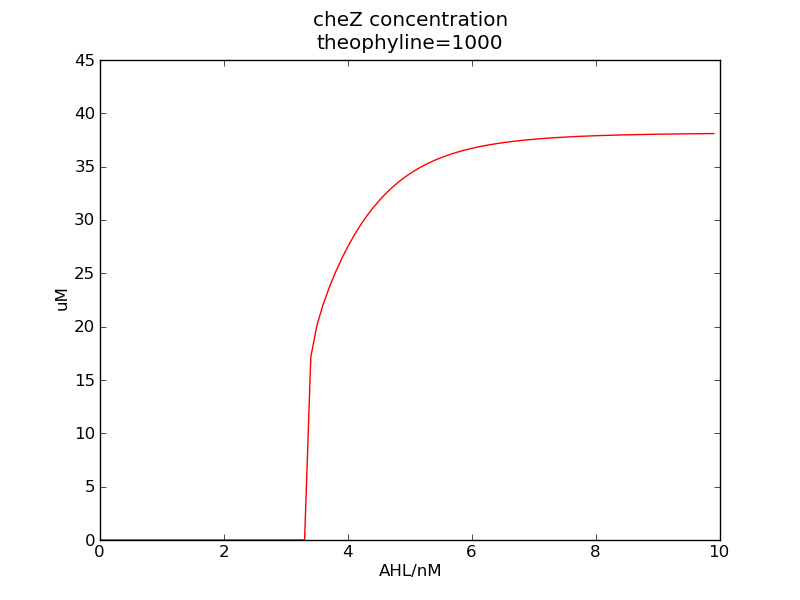
We can see that cheZ concentration rises rapidly when AHL concentration rises from 3nM to 4nM. For the switch is so fast that we can use quorum system in our design. CheZ output rises relatively rapid when theophylline concentration is around 210nM.
For the system without quorum part, If AHL concentration is low, regulate ci protein accumulates, the toggle switch is in the ci state, cheZ production is very low, so the cell can rarely move. And when AHL concentration is high, not enough regulate ci protein is produced, the toggle switch is in the ci434 state, cheZ production is high, so the cell can spend less time tumbling, and will move to the direction where cheZ concentration rises.
Following pictures show how steady-state cheZ concentrations change under conditions of different AHL and theophylline concentrations.
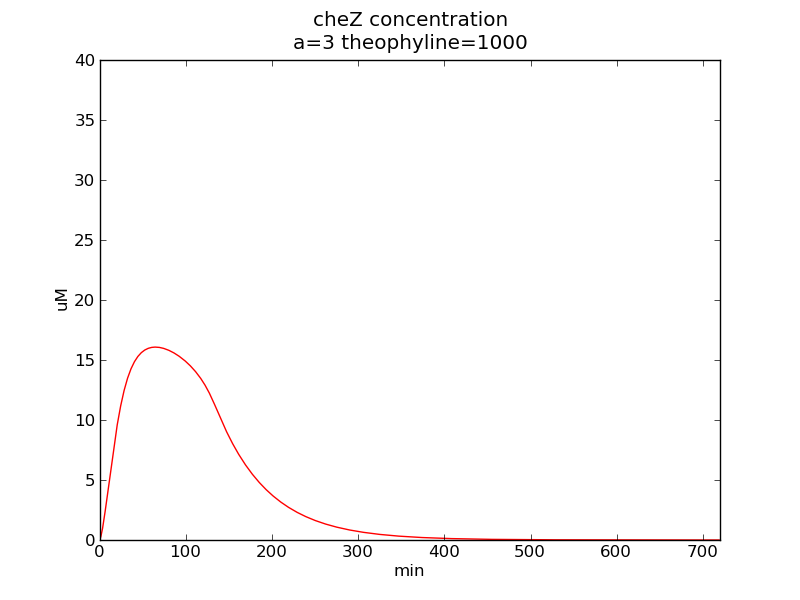
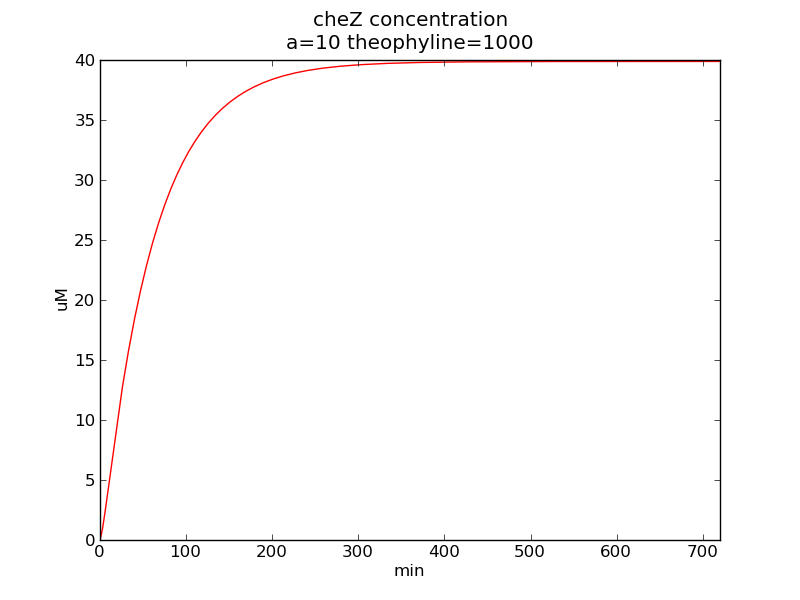
Following pictures show how cheZ concentrations change on time under conditions of different AHL and theophylline concentrations.
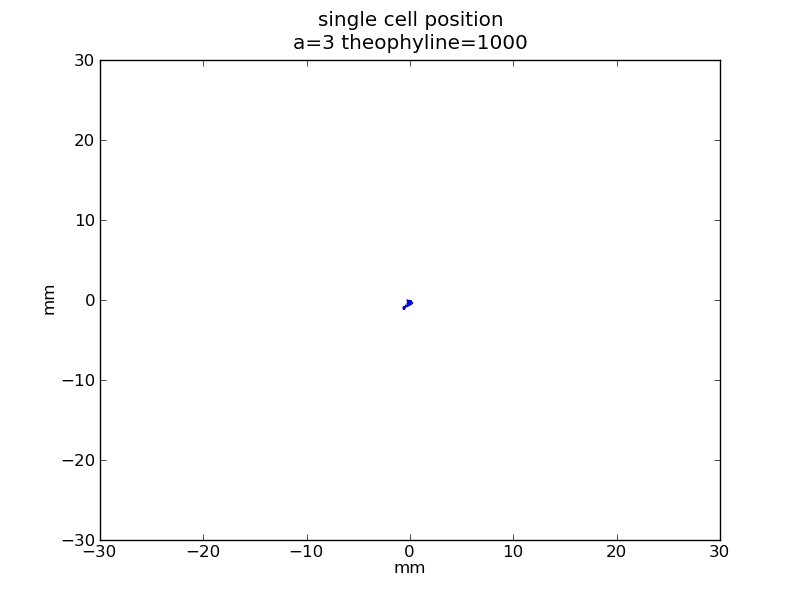
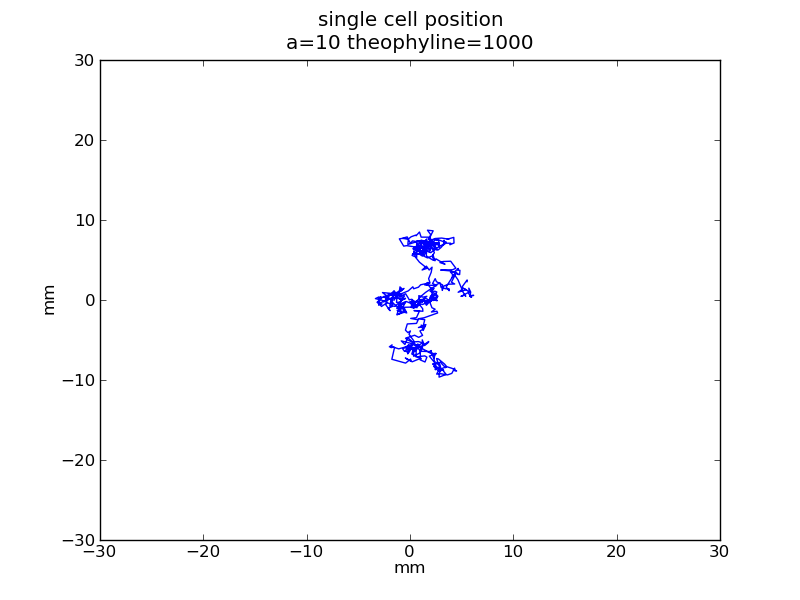
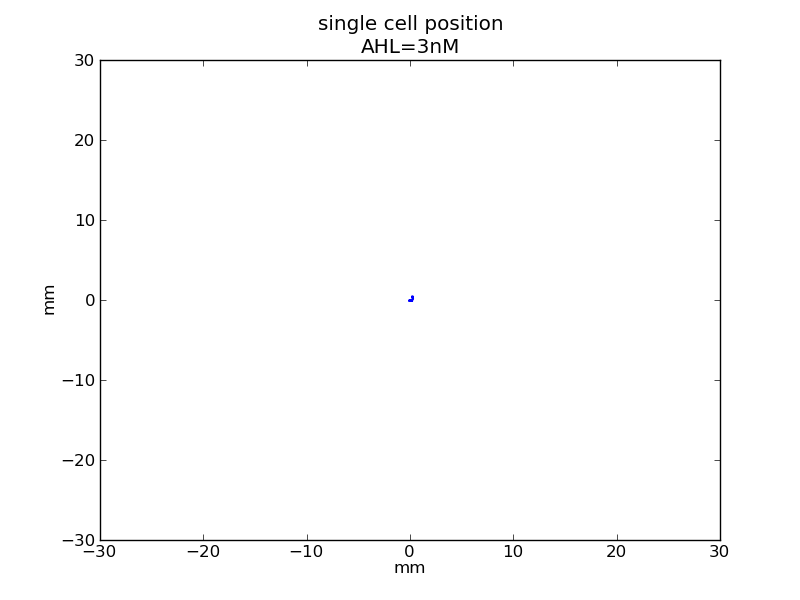
Following pictures show how a single cell moves on time under conditions of different AHL and theophylline concentrations in one single round of simulation.
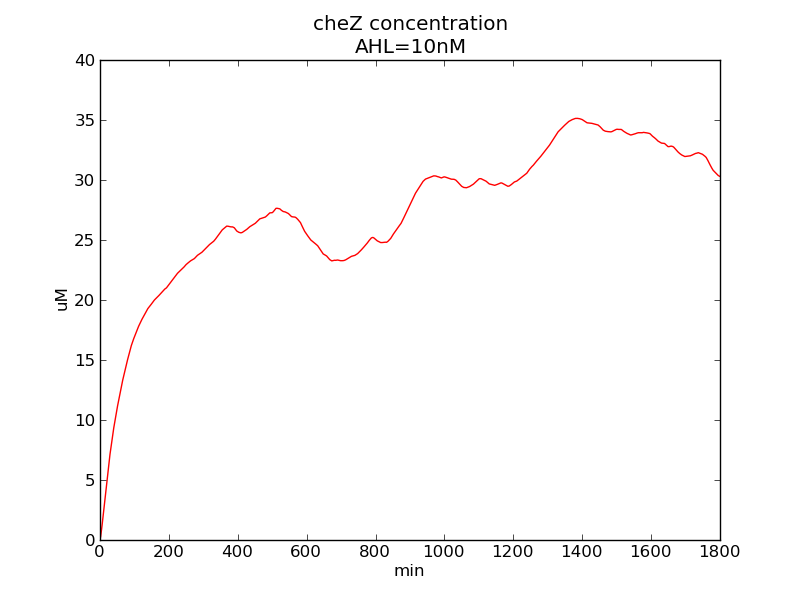
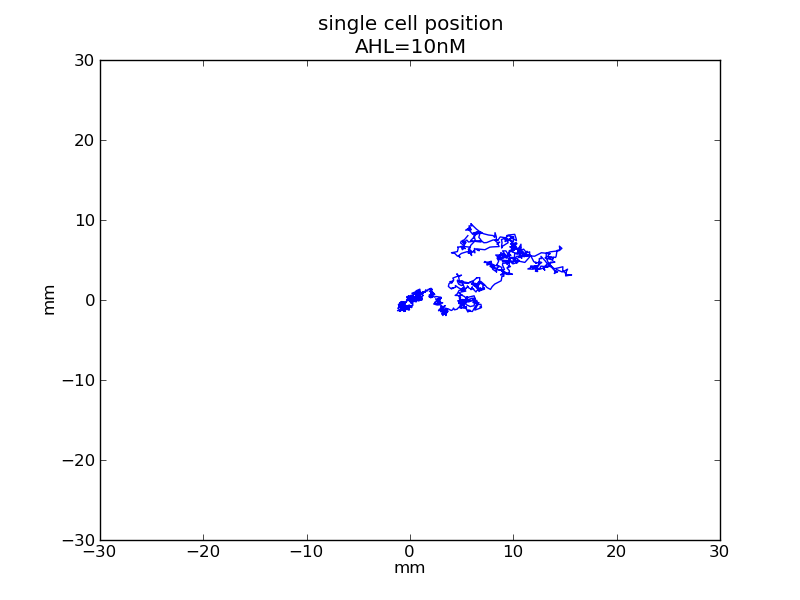
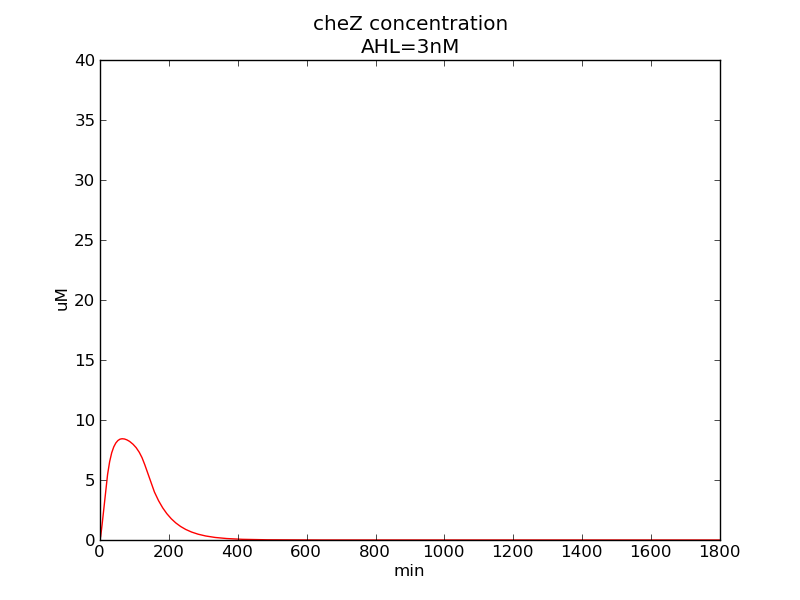
Following pictures show how a single cell moves and how cheZ concentration changes on time under conditions of different AHL and gradient of theophylline concentration (30,600) in one single round of simulation.
AHL = 10 nM
AHL = 3 nM
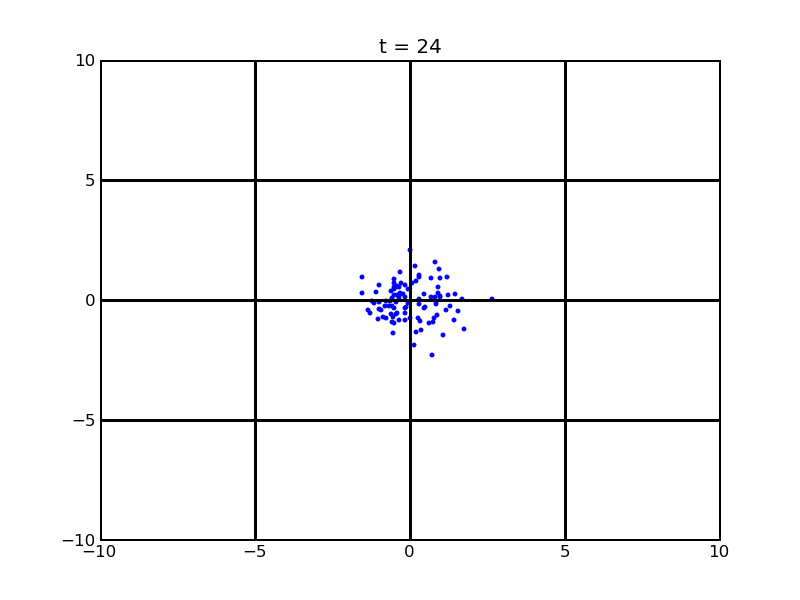
Secondly, we want to see the movement of 100 cells (or more) without quorum part under 10nM AHL and theophylline gradient (25,500)
Assume that 100 cells are around the center for 0.25mm distance at most. Following pictures shows the position of the 100 cells without quorum part under 10nM AHL and gradient of theophylline concentration (25,500) after t = 86400. And a little movie is shown
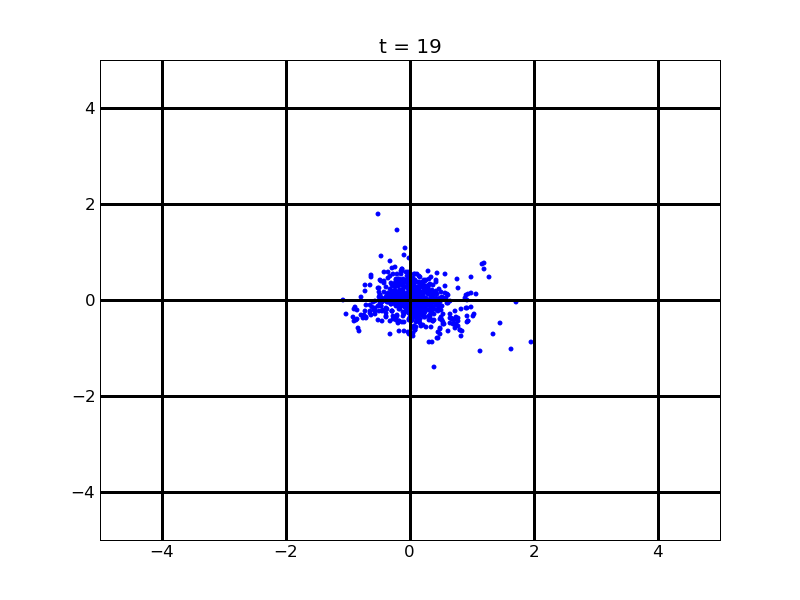
Thirdly, after the previous two modelling part, we believe that if we add quorum part into our system, the results will be acceptable. <p> For the whole system with quorum part, in the beginning, we assume that the concentrations of all related macromolecules are zero. Cells begin to divide, cell number is growing, and AHL is accumulating, when AHL concentration is high enough, toggle switch in some of the cells turns to the ci434 state, and these cells is moving out. After some time, AHL concentration in these cells will drop, and the toggle switch will most likely turn to the ci state, cells stop moving.
For this part we assume that initial cell number is 20, and numbers of the cells grow under the rate of k=0.97*exp(-t/5), the unit of time is hour.
For no gradient of theophylline
For theophylline gradient (25,500)
Future work
There are some points should be improved in our modeling.
1. Intrinsic Noises
The strength of the same promoter in different cells will be a little different. Also, their translation abilities will be a little different. So, intrinsic noises must be considered to better describe our system.
2. AHL diffusivity
In our current model, we have been trying hard to not find another more appropriate equation to describe AHL diffusivity. In our current model, the equation is so simplified that if one cell has more than 20 cells' distance below 1.5 um, the AHL concentration will be larger than AHL produced by one cell. Although, 20 cells for 1.5um will be difficult, for a large number of cells, the situation where AHL concentration larger than AHL produced may arise.
3. Application
For our project is not only about movement, but also about AIIS, so we think it necessary to take this part into our modelling.
results odes and equations parameters and references
odes and equations
Odes and equations
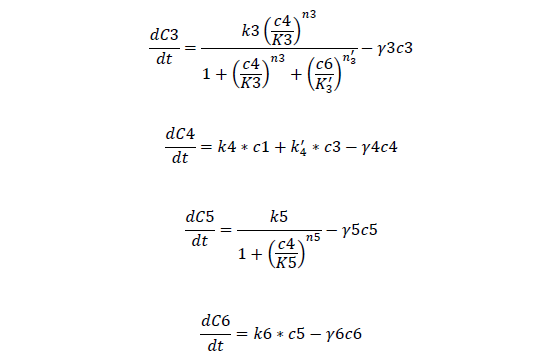
C1, regulate ci mRNA concentration
C2, regulate ci protein concentration
C3, bistable ci mRNA concentration
C4, total ci protein concentration
C5, bistable ci434 mRNA concentration
C6, bistable ci434 protein concentration
C7, cheZ mRNA concentration
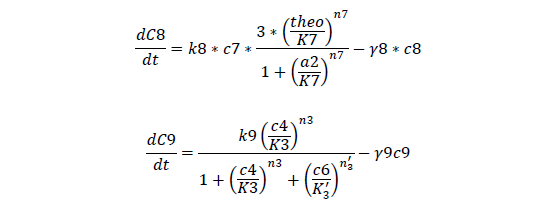
C8, cheZ protein concentration
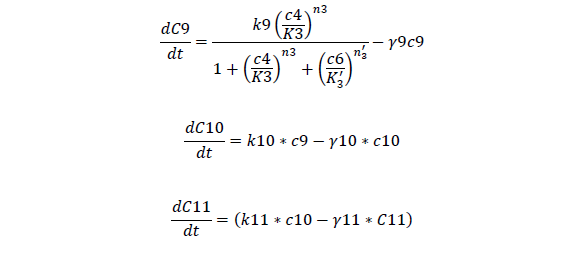
C9, I mRNA concentration
C10, I protein concentration
C11, AHL produced
A, AHL concentration
For regulatory ci mRNA and protein
For Bistable Part
For cheZ mRNA and protein
For Quorum Sensing Part
The real AHL concentration is no the AHL produced. Considering about fast diffusivity of AHL, we assume that external AHL concentration is zero, although it is not quite exact, but it can describe the character of AHL well. That is, for cell i, the compact of cell j is,
Tumbling frequency of a cell is determined by its cheYp concentration
CheYp concentration is related to cheZ concentration, and for the reaction is so fast, we assume that current cheZ concentration determines current cheYp concentration
We assume that cells move at the speed of 0.025um/s on our semisolid plate. For the movement of a single cell, if the cell tumbles, it will stay of the current second, and change its direction later, if not, the cell keeps on moving in one direction.
For the gradient of theophylline,
For cell number growth
results odes and equations parameters and references
parameters and references
Parameters
| Name | Value | Ref. |
| k1, max transcription rate of regulatory ci mRNA | 0.0933 nM/s | 1 |
| k2, translation rate of regulatory ci protein | 0.0072 /s | 1 |
| k3, max transcription rate of bistable ci mRNA | 0.0933 nM/s | 1 |
| k4, translation rate of regulatory ci protein | 0.0072 /s | 1 |
| k'4, translation rate of bistable ci protein | 0.048 /s | 1 |
| k5, max transcription rate of ci434 mRNA | 0.0987 nM/s | 1 |
| k6, translation rate of ci434 protein | 0.0845 /s | 1 |
| k7, max transcription rate of cheZ mRNA | 0.0834 nM/s | 1, 2 |
| k8, translation rate of cheZ protein | 0.1869 /s | 1, 2, 4, 7 |
| k9, max transcription rate of lasI mRNA | 0.014 nM/s | 3 |
| k10, translation rate of lasI protein | 0.016 /s | 3 |
| k11, AHL synthesis rate | 0.06 /s | 3 |
| K1, Kd between AHL and Plux promoter | 1.6 nM | 10 |
| K3, Kd between ci protein and bistable ci promoter | 40 nM | 1 |
| K'3, Kd between ci434 protein and bistable ci promoter | 50 nM | 1 |
| K5, Kd between ci protein and bistable ci434 promoter | 40 nM | 1 |
| K7, Kd between theophylline and RNA aptamer | 210 nM | 4 |
| n1, Hill co-effiency of AHL and Plux promter | 1.6 | 10 |
| n3, Hill co-effiency of ci protein and bistable ci promoter | 4 | 1 |
| n'3, Hill co-effiency of ci434 protein and bistable ci promoter | 2 | 1 |
| n5, Hill co-effiency of ci protein and ci434 promoter | 4 | 1 |
| n7, Hill co-effiency of theophylline and RNA aptamer | 3 | 7 |
| γ1, Degradation rate of regulatory ci mRNA | 0.00434 /s | 1 |
| γ2, Degradation rate of regulatory ci protein | 0.000935 /s | 1 |
| γ3, Degradation rate of bistbale ci mRNA | 0.00434 /s | 1 |
| γ4, Degradation rate of total ci protein | 0.000935 /s | 1 |
| γ5, Degradation rate of ci434 mRNA | 0.00434 /s | 1 |
| γ6, Degradation rate of ci434 protein | 0.000935 /s | 1 |
| γ7, Degradation rate of cheZ mRNA | 0.00434 /s | 1 |
| γ8, Degradation rate of cheZ protein | 0.00434 /s | 1 |
| γ9, Degradation rate of lasI mRNA | 0.006 /s | 3 |
| γ10, Degradation rate of lasI protein | 0.0001 /s | 3 |
| γ11, Degradation rate of AHL | 0.00038 /s | 3 |
| diffu_a, diffusion constant of AHL | 10^6 /mm^2 | assumption |
| diffu_t, diffusion constant of theophylline | 500, 600 /mm^2 | assumption |
| da, diffusivity constant of AHL | 0.23 /s | 3 |
| [SetYp], wild type ecoli cheYp concentration | 4.4 uM | 8 |
| ny, Hill co-effiency of cheYp and cell tumble rate | 5.5 | 9 |
| ky, cheYp phosphorylation rate | 3*10^7 /(M*S) | 8 |
| k-y, cheYp dephosphorylation rate | 5*10^5 /(M*S) | 8 |
| [Tp], concentration of wild type chemotaxis phosphorylated receptor Tar | 5*10^5 /(M*S) | 8 |
| v, cell moving speed | 0.025 mm/s | 2, assumption |
| k, cell number growth rate | 0.97 /h | 6 |
References
1. the wiki of iGEM09 Peking U team, https://2009.igem.org/Team:PKU_Beijing/Modeling;
2. the E. coli Statistics, http://gchelpdesk.ualberta.ca/CCDB/cgi-bin/STAT_NEW.cgi;
3. Systems analysis of a quorum sensing network: Design constraints imposed by the functional requirements, network topology and kinetic constants, doi:10.1016/j.biosystems.2005.04.006;
4. Molecular interactions and metal binding in the theophylline-binding core of an RNA aptamer; Conversion of the Vibrio fischeri Transcriptional activator, LuxR, to a repressor: Egland, Kristi A. and Greenberg, E. P. Journal of Bacteriology. Feb 2000, p. 805-811: http://jb.asm.org/cgi/content/abstract/182/3/805;
5. A Minimal Model of Metabolism-Based Chemotaxis, http://www.ploscompbiol.org/article/info:doi/10.1371/journal.pcbi.1001004
6. Programmed population control by cell–cell communication and regulated killing, doi:10.1038/nature02491
7. Guiding bacteria with small molecules and RNA, Shana Topp and Justin P. Gallivan. http://pubs.acs.org/doi/abs/10.1021/ja0692480.
8. A model of excitation and adaptation in bacterial chemotaxis, Peter A. Spiro, John S. Parkinson, and Hans G. Othmer. http://www.pnas.org/content/94/14/7263.full.
9. Origins of Individual Swimming Behavior in Bacteria, doi:10.1016/S0006-3495(98)77777-X.
10. Conversion of the Vibrio fischeri Transcriptional activator, LuxR, to a repressor: Egland, Kristi A. and Greenberg, E. P. Journal of Bacteriology. Feb 2000, p. 805-811: http://jb.asm.org/cgi/content/abstract/182/3/805.
results odes and equations parameters and references
 "
"
