Team:Peking S/project/blogic/extension
From 2011.igem.org
| Line 19: | Line 19: | ||
| - | <center>[[File:feedback.png| | + | <center>[[File:feedback.png|300px]]</center> |
''Figure 1: A genetic sequential logic circuit design with feedback loop. The basic structure is an AND gate, while one input is generated from the output via a NOT gate.'' | ''Figure 1: A genetic sequential logic circuit design with feedback loop. The basic structure is an AND gate, while one input is generated from the output via a NOT gate.'' | ||
| Line 46: | Line 46: | ||
We have firstly investigated the time dependence behavior of the feedback loop with previous output 0 (in other words, feedback input 0) and input 1, which would result in fluorescence expression. | We have firstly investigated the time dependence behavior of the feedback loop with previous output 0 (in other words, feedback input 0) and input 1, which would result in fluorescence expression. | ||
| - | <center>[[File:time1.png| | + | <center>[[File:time1.png|500px]]</center> |
''Figure 3: Time dependence of response before negative feedback reached, with blue squares experimental data. Fluorescence was defined as GFP/OD to represent the fluorescence intensity of individual cells. Fluorescence values and their error bars are calculated as mean +/- s.d. from three mutually independent experiments. a.u., arbitrary units.'' | ''Figure 3: Time dependence of response before negative feedback reached, with blue squares experimental data. Fluorescence was defined as GFP/OD to represent the fluorescence intensity of individual cells. Fluorescence values and their error bars are calculated as mean +/- s.d. from three mutually independent experiments. a.u., arbitrary units.'' | ||
| Line 54: | Line 54: | ||
Dose-Response of previously-closed feedback loop has been presented in Figure 4. | Dose-Response of previously-closed feedback loop has been presented in Figure 4. | ||
| - | <center>[[File:DoseResponsedd.png| | + | <center>[[File:DoseResponsedd.png|500px]]</center> |
''Figure 4: Dose-Response curve of AND gate before negative feedback reached. Blue squares are experimental data and red line is the fitting result. The concentrations of arabinose are 1e-7, 3e-7, 1e-6, 3e-6, 1e-5, 3e-5, 1e-4, 3e-4, 1e-3, 3e-3 and 1e-2, respectively. Fluorescence values and their error bars are calculated as mean +/- s.d. from three mutually independent experiments. a.u., arbitrary units.'' | ''Figure 4: Dose-Response curve of AND gate before negative feedback reached. Blue squares are experimental data and red line is the fitting result. The concentrations of arabinose are 1e-7, 3e-7, 1e-6, 3e-6, 1e-5, 3e-5, 1e-4, 3e-4, 1e-3, 3e-3 and 1e-2, respectively. Fluorescence values and their error bars are calculated as mean +/- s.d. from three mutually independent experiments. a.u., arbitrary units.'' | ||
Revision as of 23:44, 5 October 2011
Template:Https://2011.igem.org/Team:Peking S/bannerhidden Template:Https://2011.igem.org/Team:Peking S/back2
Template:Https://2011.igem.org/Team:Peking S/bannerhidden

Boolean Logic
Boolean Logic Synthetic Microbial Consortia|
Extension of the Boolean Logic
Extension of the Boolean Logic
It can be anticipated that the absence of feedback mechanisms in Boolean or Non-Boolean gene networks could present a major hurdle for signal correction and modulation in synthetic microbial consortia. Feedback is a mechanism looped back to control a system within itself. Specifically, in systems containing an input and output, feeding back part of the output so as to partially oppose the input is negative feedback, which we make use of in our system. Previous Boolean logic synthetic microbial consortia do not possess any feedback, which limits their potential towards more complex behavior. We have designed a genetic sequential logic circuit with a Boolean-logic based feedback loop as illustrated in Figure 1, which has digitalized performances depending on the previous state of the system.

Figure 1: A genetic sequential logic circuit design with feedback loop. The basic structure is an AND gate, while one input is generated from the output via a NOT gate.


Figure 2: Plasmid design for AND gate with a negative feedback loop. The basic structure of AND gate is on pSB4K5, with plux_inv and pBAD controlling T7ptag and supD, respectively. plux_inv denotes the lux repressible promoter, developed in our quorum sensing inverters. The output portion of our feedback loop locates on pSB1A3, with a T7 promoter leading luxI and gfp, where luxI generates AHL to send back signals as a feedback, and gfp is synthesized to illustrate the strength of output. When the system senses no arabinose, the AND gate is always OFF because of lack of supD, and no GFP would be generated. Nevertheless, an intriguing feature in the feedback circuit is that when our system is induced by arabinose. If previous output is 1, namely gfp is synthesized, so luxI would also be synthesized, subsequently generating AHL among the cells. Then plux_inv would be inhibited by AHL, and the AND gate was switched to OFF state. On the other hand, if previous output is 0, neither gfp nor luxI is synthesized, so that plux_inv is on, and with the presence of arabinose, the output would be shifted to 1 from 0, since AND gate would be ON.
In the previous part of our project, we took a ‘building promoters from ground up’ approach to develop a method to synthesize quorum-sensing repressors. In design, we utilized one of the quorum-sensing repressors to implement feedback signal in order to synchronize the population. Figure 2 illustrates our construction of the plasmids for feedback loop. T7ptag and supD forms the AND gate [1], controlled by plux_inv and pBAD, respectively. Output of our system was illustrated by GFP fluorescence, and the lux system served as feedback pathway.
Function of our feedback loop is presented in Table 2.
Table 2. Sequential logic of AND gate with a negative feedback.
Experimental results
Without the inducement of arabinose, the output is always 0, resulting no fluorescence. On the other hand, the output would switch between ON and OFF sequentially dependent on the odd and even times of arabinose inducement , as reflected in Table 1: if previous output is 0, current output would be 1, and vice versa.
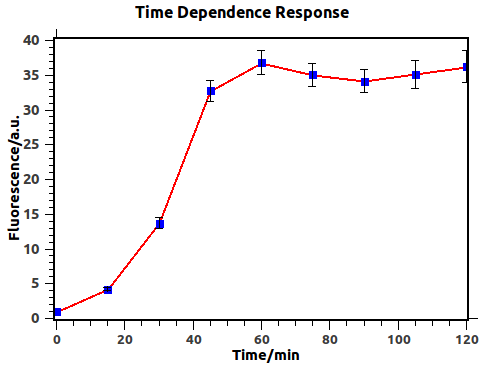
We have firstly investigated the time dependence behavior of the feedback loop with previous output 0 (in other words, feedback input 0) and input 1, which would result in fluorescence expression.

Figure 3: Time dependence of response before negative feedback reached, with blue squares experimental data. Fluorescence was defined as GFP/OD to represent the fluorescence intensity of individual cells. Fluorescence values and their error bars are calculated as mean +/- s.d. from three mutually independent experiments. a.u., arbitrary units.
Figure 3 illustrates explicitly that output would reach a steady state after about 1h, thus indicating that we should induce for more than 1h in obtaining Dose-Response curve.
Dose-Response of previously-closed feedback loop has been presented in Figure 4.

Figure 4: Dose-Response curve of AND gate before negative feedback reached. Blue squares are experimental data and red line is the fitting result. The concentrations of arabinose are 1e-7, 3e-7, 1e-6, 3e-6, 1e-5, 3e-5, 1e-4, 3e-4, 1e-3, 3e-3 and 1e-2, respectively. Fluorescence values and their error bars are calculated as mean +/- s.d. from three mutually independent experiments. a.u., arbitrary units.
The transfer function of the feedback loop when previous output is 0 would be similar to the form of an AND gate, given that the feedback loop would perform after a certain time delay. Anderson, J. C. et al. have derived [1]
where I1 and I2 are the activity of the plux_inv and pBAD promoters, and a, b are fixed parameters in the system. In the time scale of our experiment, plux_inv could be regarded as a constitutive promoter and consequently I1 was a constant. So our formula can be simplified as,
comparing with (1), we have ka=a/I1, kb=b. Additionally, I2 has been replaced by I, since there has been only one input.
By utilizing formula (2), we derived the red fitting curve in Figure 4, which matched the raw data in experiment.
Sequential logic behavior of feedback loop
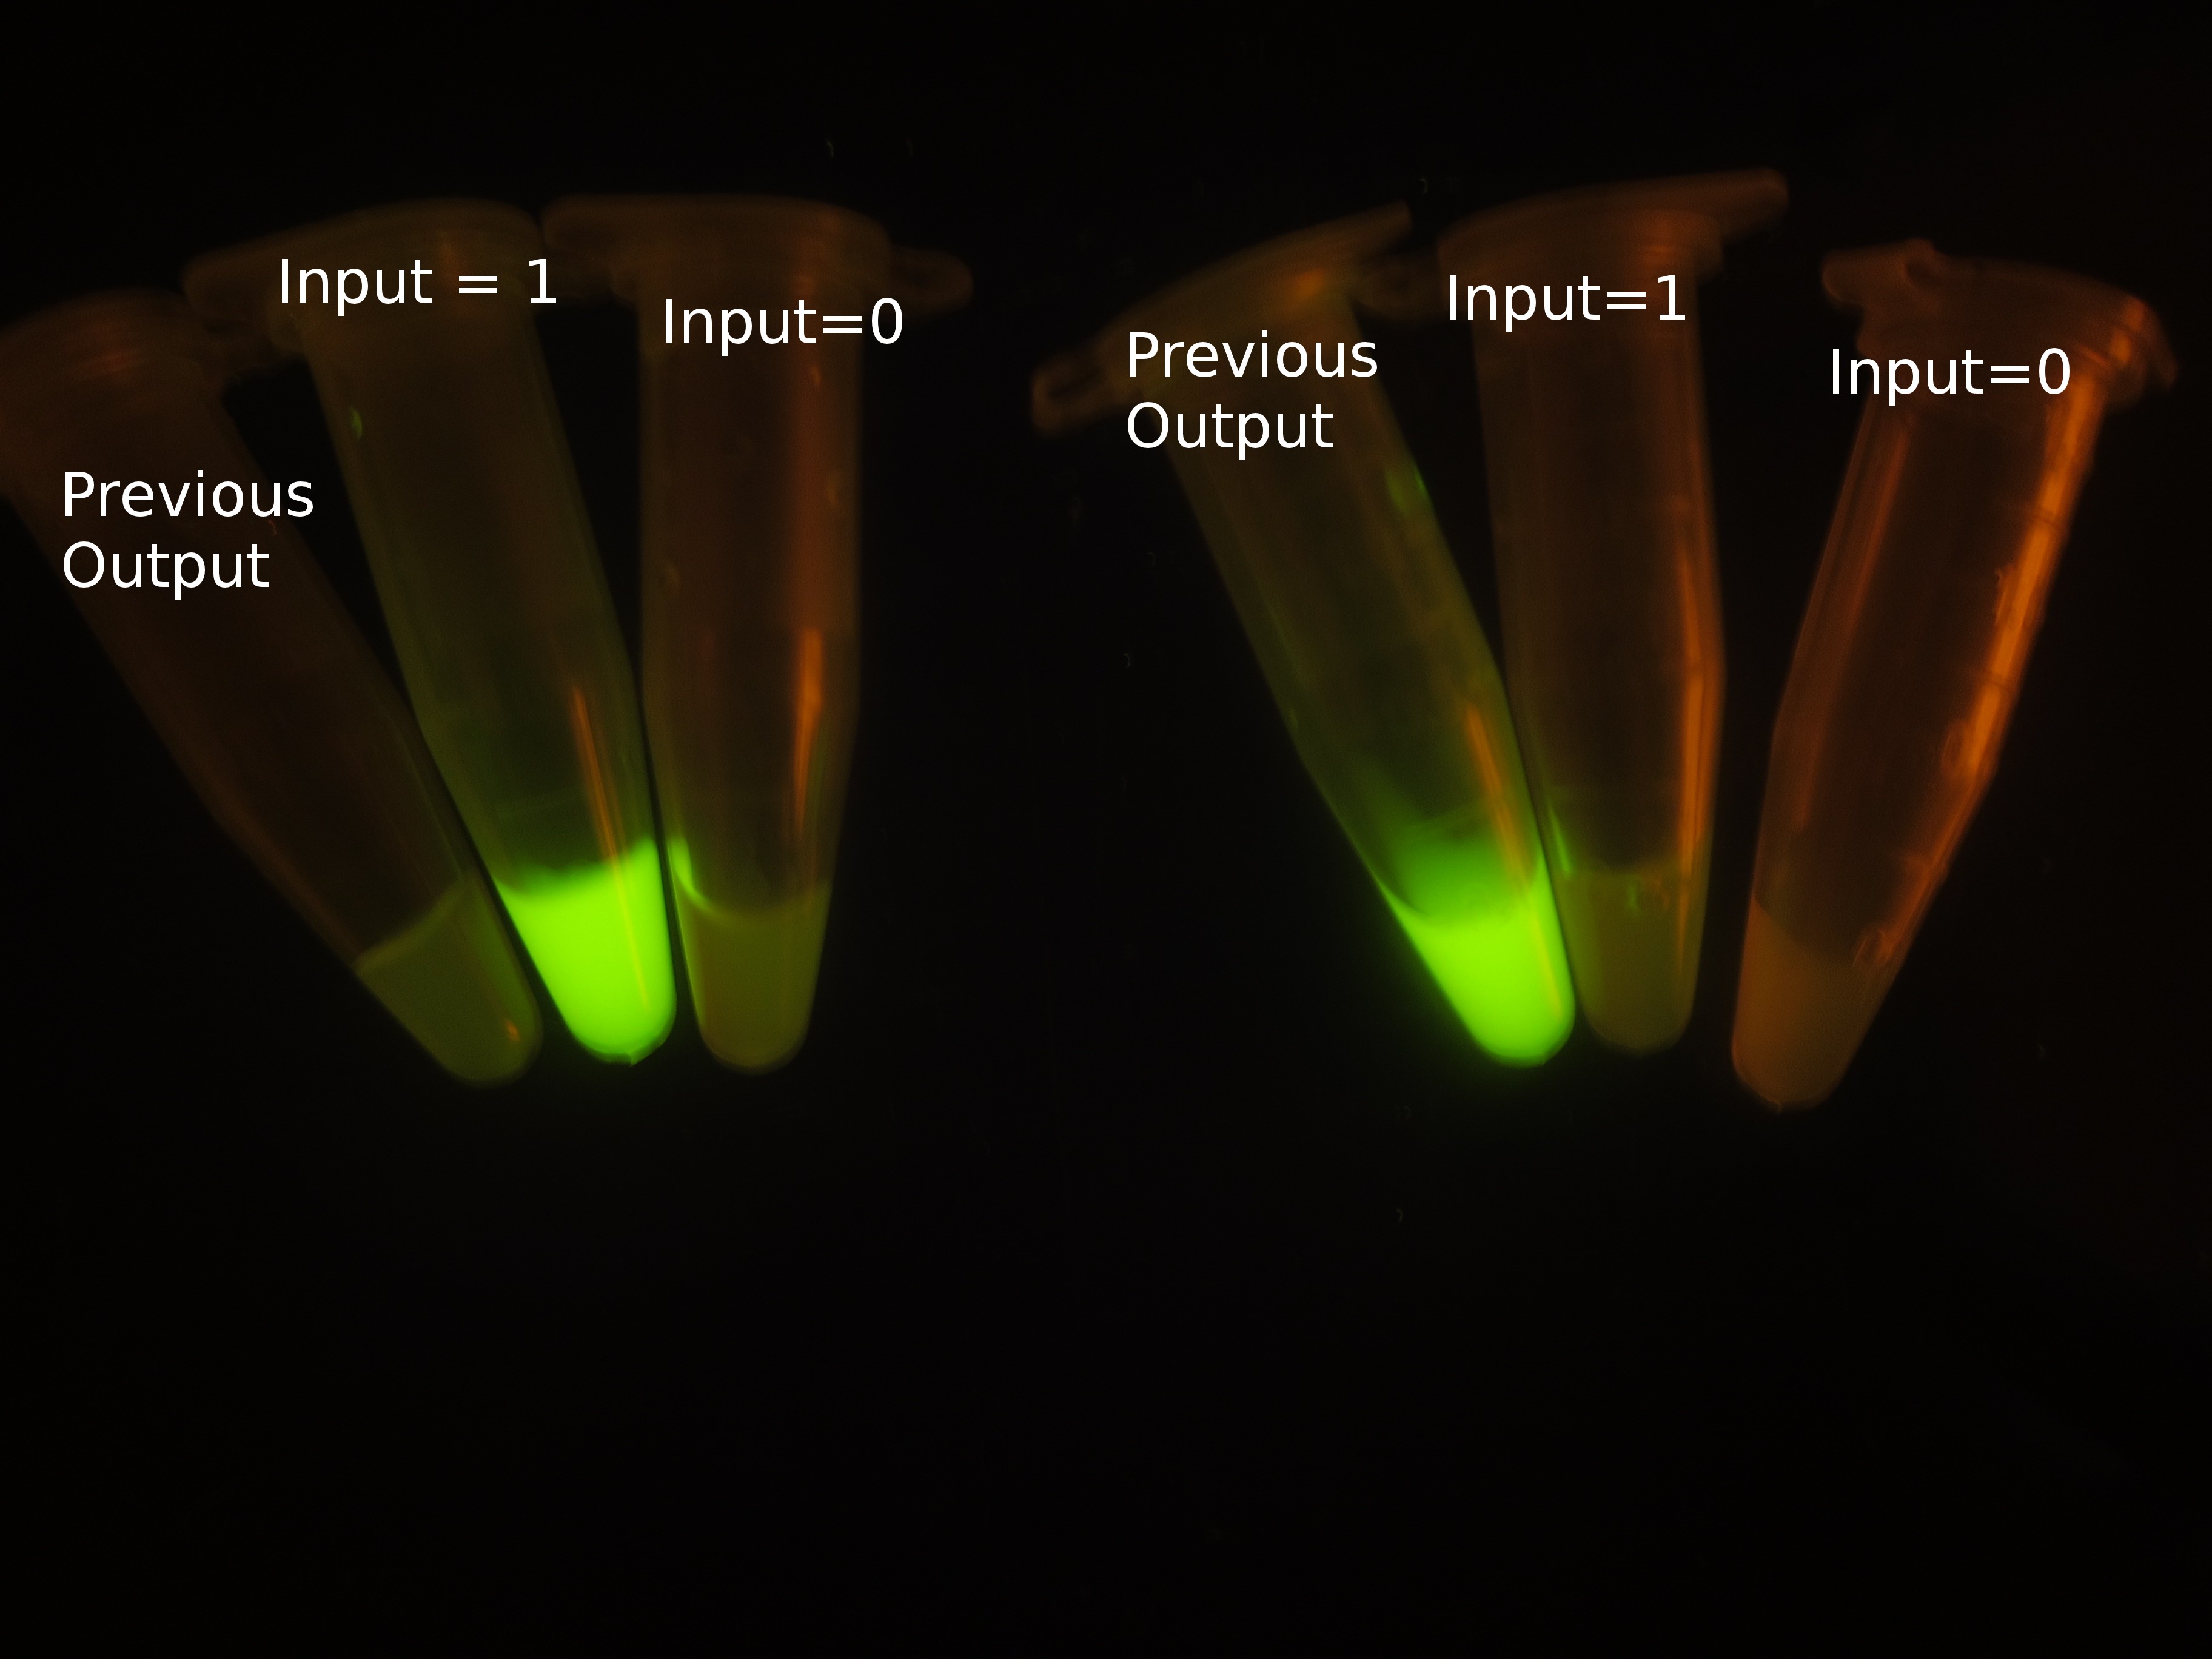
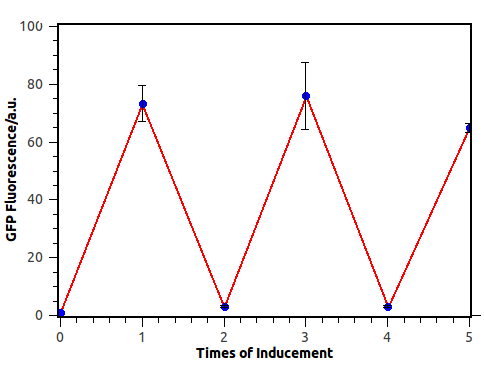
The most intriguing feature of our feedback loop is that the output would switch between ON and OFF sequentially dependent on the odd and even times of arabinose inducement. Consequently, we have performed experiments to prove its sequential logic behavior (Figure 5), especially for the repeated switch between ON and OFF (Figure 6).


Figure 5. Sequential logic behavior of feedback loop. (left). Two sets of experiments have been conducted, with previous output 0 (left set) and 1 (right set). In each set, the left one represents previous output before inducement, while the right two tubes show the result after another cycle of inducement. (right). GFP fluorescence of each result. Fluorescence values and their error bars are calculated as mean +/- s.d. from three mutually independent experiments. a.u., arbitrary units.


Figure 6. Output switch according to the times of inducement. (left). Each tube is the result of certain cycles inducement by 1e-3M arabinose. From left to right, they have been induced 0 to 5 times each. (right). GFP fluorescence of each result. Fluorescence values and their error bars are calculated as mean +/- s.d. from three mutually independent experiments. a.u., arbitrary units.
Experimental methods
Measuring logic sequential behavior and Dose-Response curve:
Cells harboring appropriate plasmids were incubated in 5ml of LB antibiotic medium (37℃, 250 r.p.m. shaking) in culture tubes without the presence of AHL (inducer of plux_inv) for 12h. The cultures were then diluted 1000-fold into fresh LB medium with a concentration of AHL at 1e-6M, maintaining their output on the OFF state (no fluorescence would be generated), and incubated again in a shaker till the OD600 value reached 0.4-0.6. After washed twice by fresh LB medium without AHL, cells were induced by arabinose. For the time sequential behavior, three paralleled groups of cells were induced by 1e-3M arabinose for 15min, 30min, 45min, 60min, 75min, 90min, 105min and 120min, respectively. To generate Dose-Response curve, another three paralleled groups of cells were induced by arabinose in various concentrations from 1e-7M to 1e-2M for 2h in shaker. After inducement, each tube of cell was pelleted by 4min centrifugation at 4000 r.p.m., and resuspended by 200ul PBS to test the expression of GFP.
Demonstrating digitalized performance of feedback loop:
The preliminary preparations for inducible cells were identical with above protocols until OD600 value reached 0.4-0.6 in the presence of AHL at a concentration of 1e-6M. These cells were in an initial state with output 0. Afterwards, some cells were diluted 10-fold into fresh LB medium with 1e-3M arabinose and incubated for another 3-4h, engendering cells with initial state 1. Prepared cells with initial state 0 or 1 were diluted 10-fold into fresh LB medium with or without presence of 1e-3M arabinose to generate four different states of our system, as indicated in Table 2. Each tube of cell was pelleted after 3-4h inducement to observe the expression of GFP. For longer time scales, the cells after inducement were diluted repeatedly into fresh LB medium for another cycle of inducement.
References
[1] Anderson, J. C., Voigt, C. A. & Arkin, A. P. Environmental signal integration by a modular AND gate. Mol. Syst. Biol. 3, 133 (2007).
[2] Tamsir, A., Tabor, J. J. & Voigt , C. A. Robust multicellular computing using genetically encoded NOR gates and che mical ‘wires’ . Nature. 469, 212-215(2011).
[3] Li, B. & You, L. Division of logic labour. Nature. 469, 171-172(2011).
[4] Danino, T., Palomino, O. M., Tsimring, L. & Hasty, J. A synchronized quorum of genetic clocks. Nature. 463, 326-330(2010).
[5] Regot, S. et al. Nature 469, 207–211 (2011).
 "
"


