Team:NYMU-Taipei/results/immunological-solution1
From 2011.igem.org
| Line 2: | Line 2: | ||
{{:Team:NYMU-Taipei/Templates/results/Header}} | {{:Team:NYMU-Taipei/Templates/results/Header}} | ||
| + | |||
| + | |||
| + | |||
| + | ==<font size=5><font color=crimson>'''tetR+RBS+GFP '''</font></font>== | ||
| + | |||
[[Image:30.JPG]][[Image:31.JPG]][[Image:32.JPG]] | [[Image:30.JPG]][[Image:31.JPG]][[Image:32.JPG]] | ||
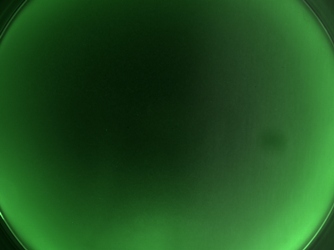
| - | '''These are measurements of construct tetR+RBS+GFP under fluorescence microscope. The left, above graph is control group of E.coli strain DH5a. The right, above is tetR+RBS+GFP in plasmid c3 in E.coli , while the below is plate without any bacilli. All graphs are measured in fixed exposure time. Construct of tetR+RBS+GFP which emits light is thought to be a leak phenomenon of plasmid, for RE digest has proved the sequence length right, and further sequencing work is under operation.''' | + | |
| + | <font size=3>'''These are measurements of construct tetR+RBS+GFP under fluorescence microscope. The left, above graph is control group of E.coli strain DH5a. The right, above is tetR+RBS+GFP in plasmid c3 in E.coli , while the below is plate without any bacilli. All graphs are measured in fixed exposure time. Construct of tetR+RBS+GFP which emits light is thought to be a leak phenomenon of plasmid, for RE digest has proved the sequence length right, and further sequencing work is under operation.''' | ||
| + | |||
| + | |||
| + | |||
| + | [[Image:33.JPG]] | ||
| + | |||
| + | |||
| + | |||
| + | '''The expression of GFP is measured precisely under excitation wavelength from 475nm to 501nm, given the absorption wavelength 511nm. In our measurement, wavelength over 493nm yields high background, resulting in values of control group surging far beyond normal condition. Thus, 493nm is suggested as the best excitation wavelength, as it presents the highest emission light and the lowest of control group. ''' | ||
Revision as of 17:30, 5 October 2011


tetR+RBS+GFP
These are measurements of construct tetR+RBS+GFP under fluorescence microscope. The left, above graph is control group of E.coli strain DH5a. The right, above is tetR+RBS+GFP in plasmid c3 in E.coli , while the below is plate without any bacilli. All graphs are measured in fixed exposure time. Construct of tetR+RBS+GFP which emits light is thought to be a leak phenomenon of plasmid, for RE digest has proved the sequence length right, and further sequencing work is under operation.
The expression of GFP is measured precisely under excitation wavelength from 475nm to 501nm, given the absorption wavelength 511nm. In our measurement, wavelength over 493nm yields high background, resulting in values of control group surging far beyond normal condition. Thus, 493nm is suggested as the best excitation wavelength, as it presents the highest emission light and the lowest of control group.
 "
"


