Team:UC Davis/Attributions
From 2011.igem.org
Aheuckroth (Talk | contribs) |
Aheuckroth (Talk | contribs) |
||
| Line 45: | Line 45: | ||
The mathematical model used to obtain parameters to fit to our data was developed by graduate advisor <a href='https://2011.igem.org/Team:UC_Davis/Team#Linh'>Linh Huynh</a>. Thanks, Linh!<br><br> | The mathematical model used to obtain parameters to fit to our data was developed by graduate advisor <a href='https://2011.igem.org/Team:UC_Davis/Team#Linh'>Linh Huynh</a>. Thanks, Linh!<br><br> | ||
| - | The Cell Designer graphics on our <a href="https://2011.igem.org/Team:UC_Davis/Project_Selection#whyPromoters">project selection</a> page were created by | + | The Cell Designer graphics on our <a href="https://2011.igem.org/Team:UC_Davis/Project_Selection#whyPromoters">project selection</a> page were created by <a href='https://2011.igem.org/Team:UC_Davis/Team#Marc'>Marc Facciotti</a>. Thanks, Marc! |
</div> | </div> | ||
Revision as of 03:48, 29 September 2011
Start a Family
Got a favorite BioBrick? Check our our process for expanding basic parts into part families.Criteria
View our judging criteria for iGEM 2011 here.
Attributions: What Did We Do?
Wet Work
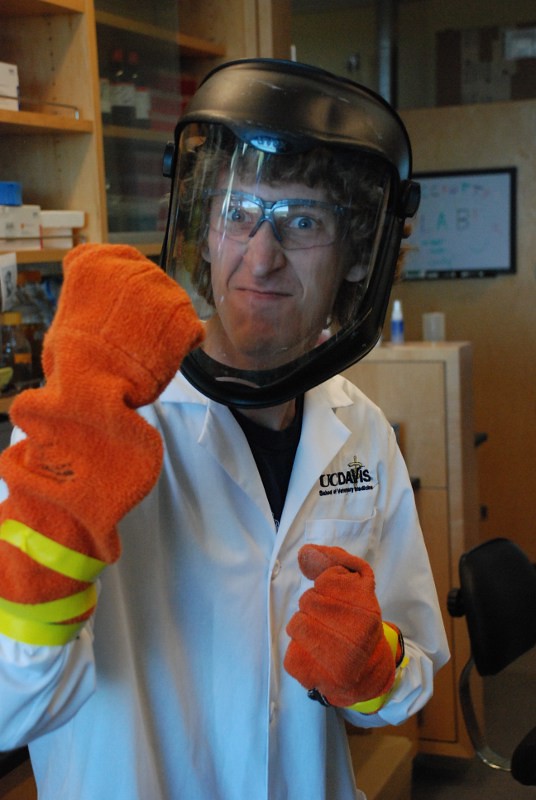 Undergraduates from the team performed all wet lab work, from plasmid mini-preps to PCRs to gel extractions.
We filled our own pipette tip boxes, prepared our own TAE buffer and poured our own agarose gels. We even rode our bikes to the laboratory supply center to buy our own 96-well plates for liquid culture analysis.
We based our protocols on existing Facciotti lab procedures and information on OpenWetWare.org.
We revised and improved the mutagenic PCR protocol from this paper to function well with standard BioBrick primers and to produce mutations at a suitable rate for our project.
Data Analysis and Imaging
 The information and graphics on our data and project pages comes from analysis performed by undergraduate team members.
Keegan wrote scripts in Octave which were used to parse raw data from our plate reader for mutant screening, promoter activity assays and fluorescence emission scans. Similar scripts were also used to output our 2D and 3D graphs.
He also employed the Flot.js and Three.js libraries to create the 2D and 3D characterization plots seen on the data pages. To do this, he had to code a 3D plotting routine, an interpolation scheme for smooth coloring of 3D surface graphs, and the display widget that is used to present our data.
The mathematical model used to obtain parameters to fit to our data was developed by graduate advisor Linh Huynh. Thanks, Linh!
The Cell Designer graphics on our project selection page were created by Marc Facciotti. Thanks, Marc!
Wiki and Graphic Design
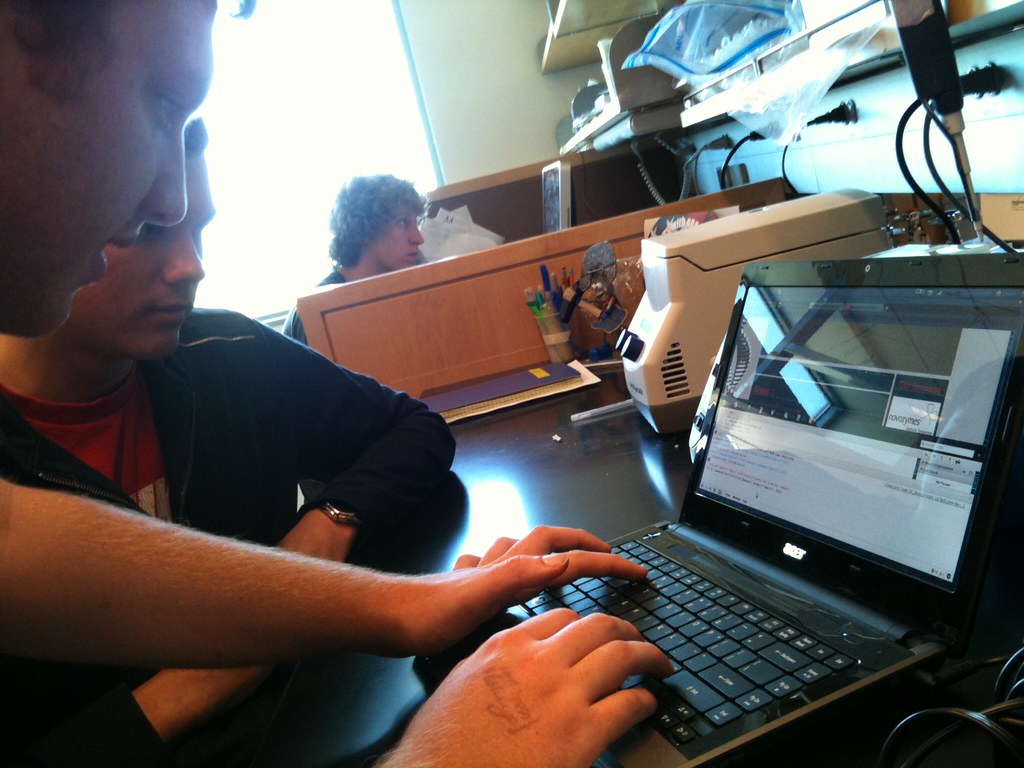 We designed and built this website from the ground up.
The layout was a group effort, with templates designed by Tim. Much of the wiki formatting was removed using CSS code from the 2009 TU Delft iGEM team.
Tim was the primary designing powerhouse behind the wiki and contributed largely to the Notebook section, particularly the gallery. He also implemented the Lightbox 2 code from this site to allow photo viewing from our Flickr account.
Keegan implemented the JQuery javascript library, CSS and HTML code to format our pages, animate the custom menu bar, and enable automatic in-line linking of all instances of BioBrick parts on our site to their corresponding pages on the parts registry.
Nick added the bulk of the Notebook pages and created registry entries for our parts on the registry.
Photographs and Animations
 All of the photographs on this site were taken by members of our team.
Tim borrowed a DSLR to take nearly all of the photographs of plates, lab equipment, and lab personnel. Aaron also took some shots with the DSLR, and all team members used the cameras on their phones to document progress and take snapshots.
Tim and Keegan created the 3D animations on the LacI, TetR, and λ cI pages by exporting 3D data on protein models from PyMol into Blender and exporting animation frames which were then compiled into .avi files and hosted on Vimeo.
Fundraising
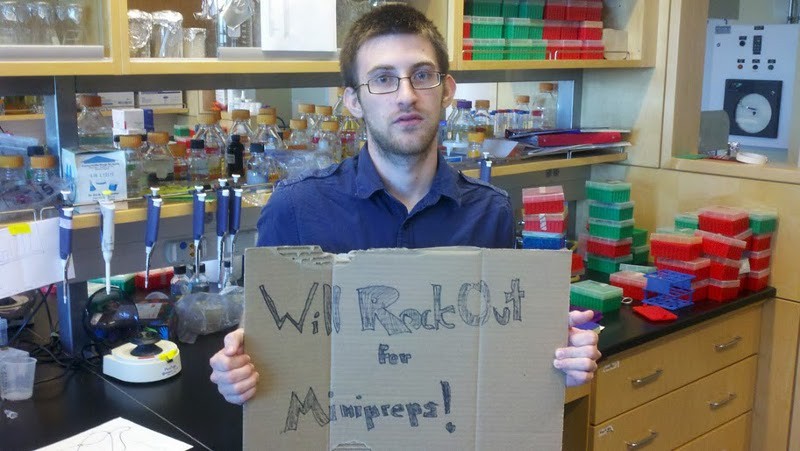 The majority of our fundraising was performed by undergraduate team members.
Aaron raised nearly $10,000 by writing letters to local companies and prominent faculty, and by preparing promotional material like our 2011 Summer Update brochure.
Tim also raised a few thousand dollars from several UC Davis departments.
Open-Source Mindedness
We chose software tools that are powerful, open-source and, most importantly, free to use. This doesn't just save us money -- it promotes cooperation between teams regardless of their levels of funding. This is in keeping with the spirit of BioBricks, the Parts Registry, and the iGEM competition.
GIMP
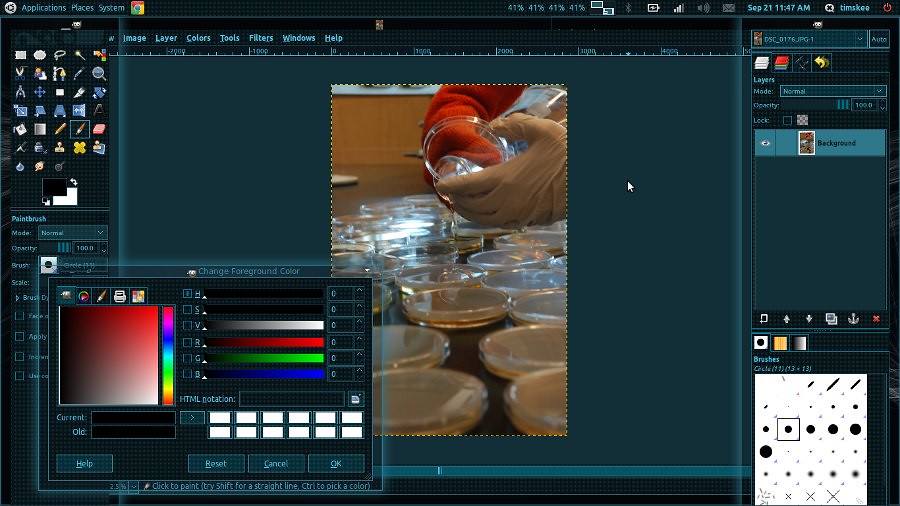 We used Gimp (GNU Image Manipulation Program) for all of our image editing. This program has a majority of the same features as Adobe Photoshop while being free and lightweight. GIMP even has some functions which haven't appeared in its more expensive counterparts!
You can visit the GIMP webiste here.
Blender
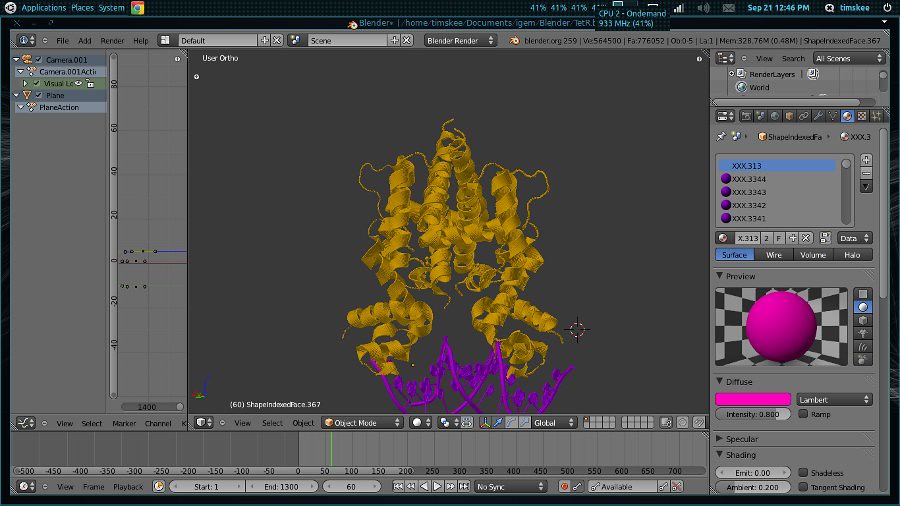 Blender is an extremely powerful 3D modeling and animation program. We did all of our 3D modelling and animation using blender. All of the protein structures on our wiki were exported from PyMOL into Blender where we animated and rendered them.
You can visit the Blender website here.
Octave
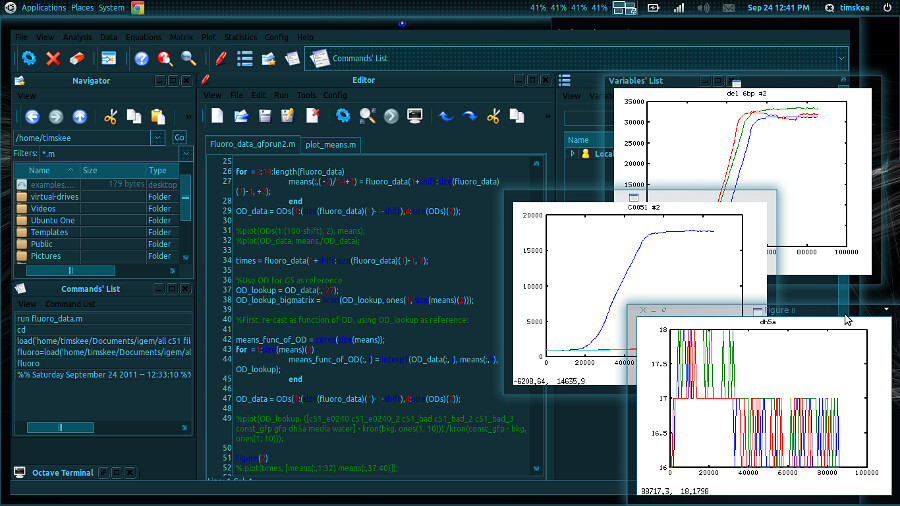 Octave is a language designed for numerical computations similar to MATLAB. We did all of our data analysis using Octave. This open-source program made sorting through thousands of lines of fluorescence data quick and easy using some simple scripts.
You can visit the Octave website here.
Inkscape
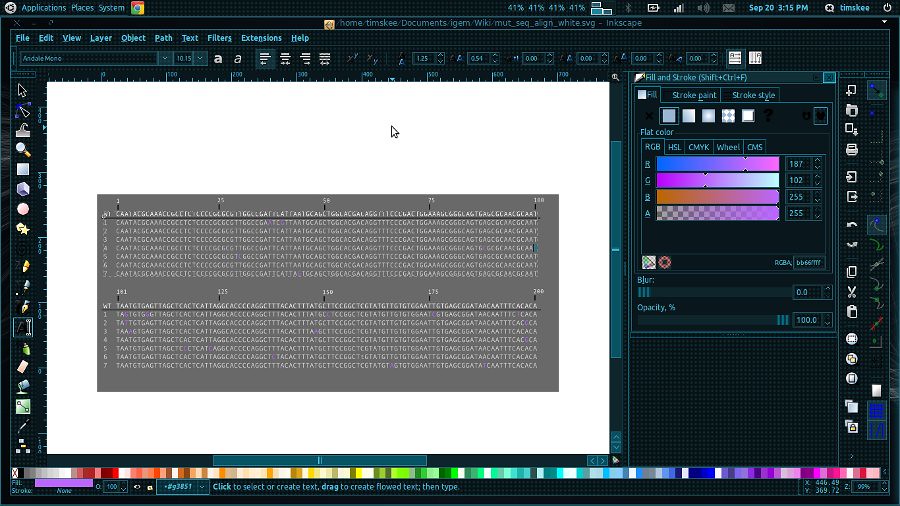 InkScape is a vector graphics editor. We used it to produce some of the images for this wiki, including our construct diagrams on the Project page.
You can visit the InkScape website here.
References
We based our error-prone PCR protocol on this paper:Cirino, Patrick C., Kimberly M. Mayer, and Daisuko Umeno. "Generating Mutant Libraries Using Error-Prone PCR."
Methods in Molecular Biology 231.3-9 (2003). Web.
It can be accessed here.
 "
"


