Team:Paris Bettencourt/Experiments/pHyperSpank
From 2011.igem.org
Danyel.lee90 (Talk | contribs) |
|||
| Line 14: | Line 14: | ||
<html> | <html> | ||
<h2>Results</h2> | <h2>Results</h2> | ||
| + | |||
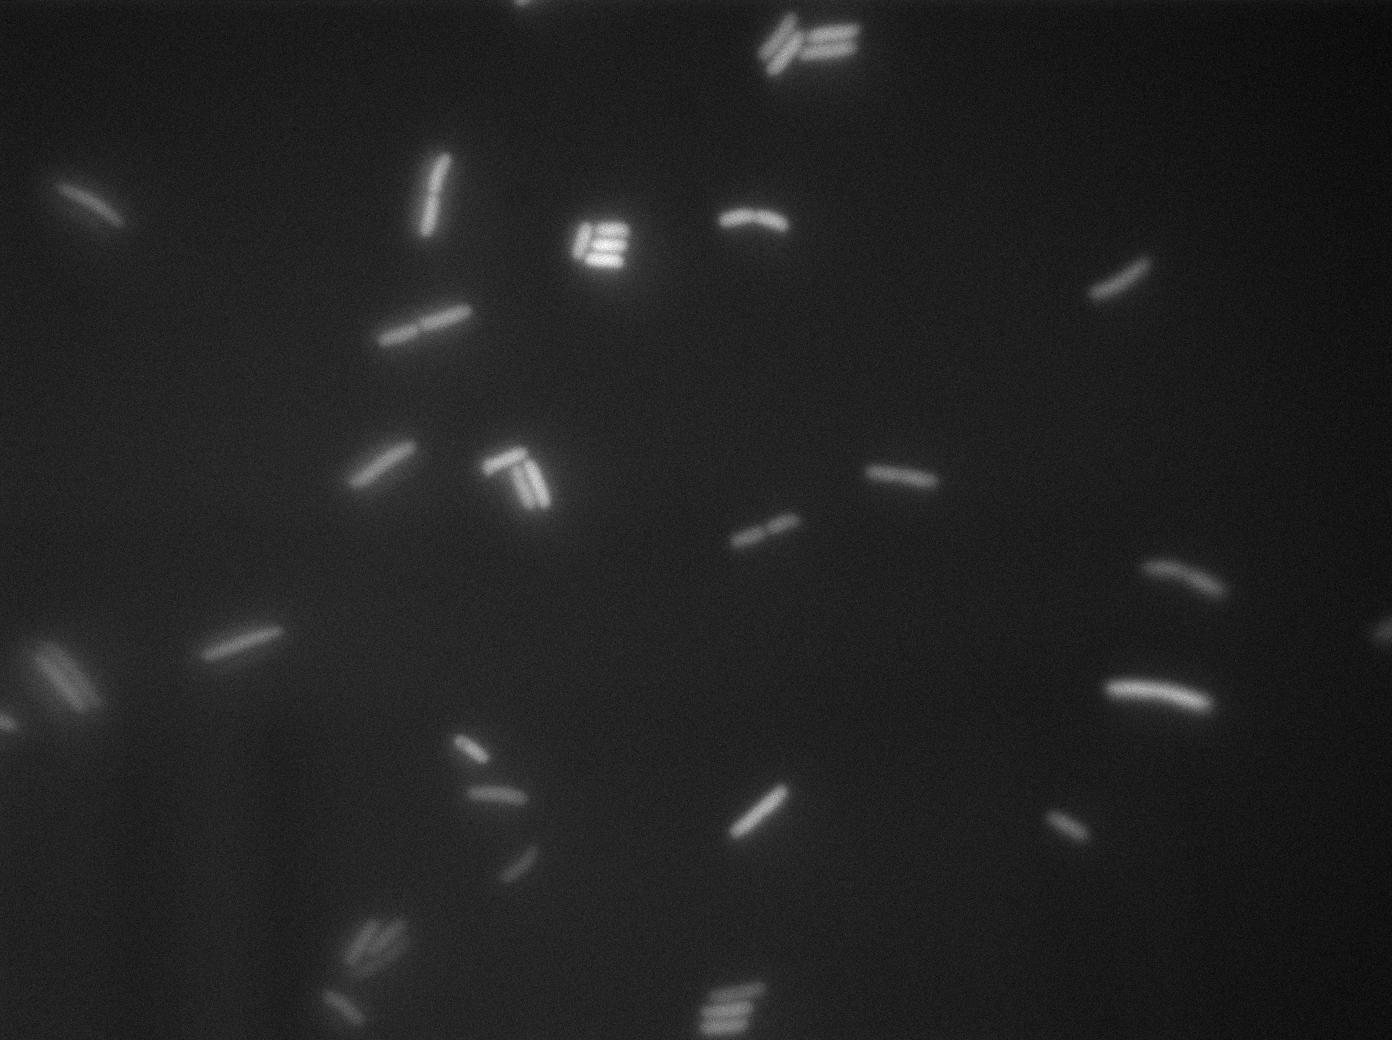
| + | <p>The new biobrick pHS (K606040) was cloned in front of an RFP terminator. The fluorescence was seen under the microscope with strains induced and not induced but IPTG</p> | ||
</html> | </html> | ||
| Line 35: | Line 37: | ||
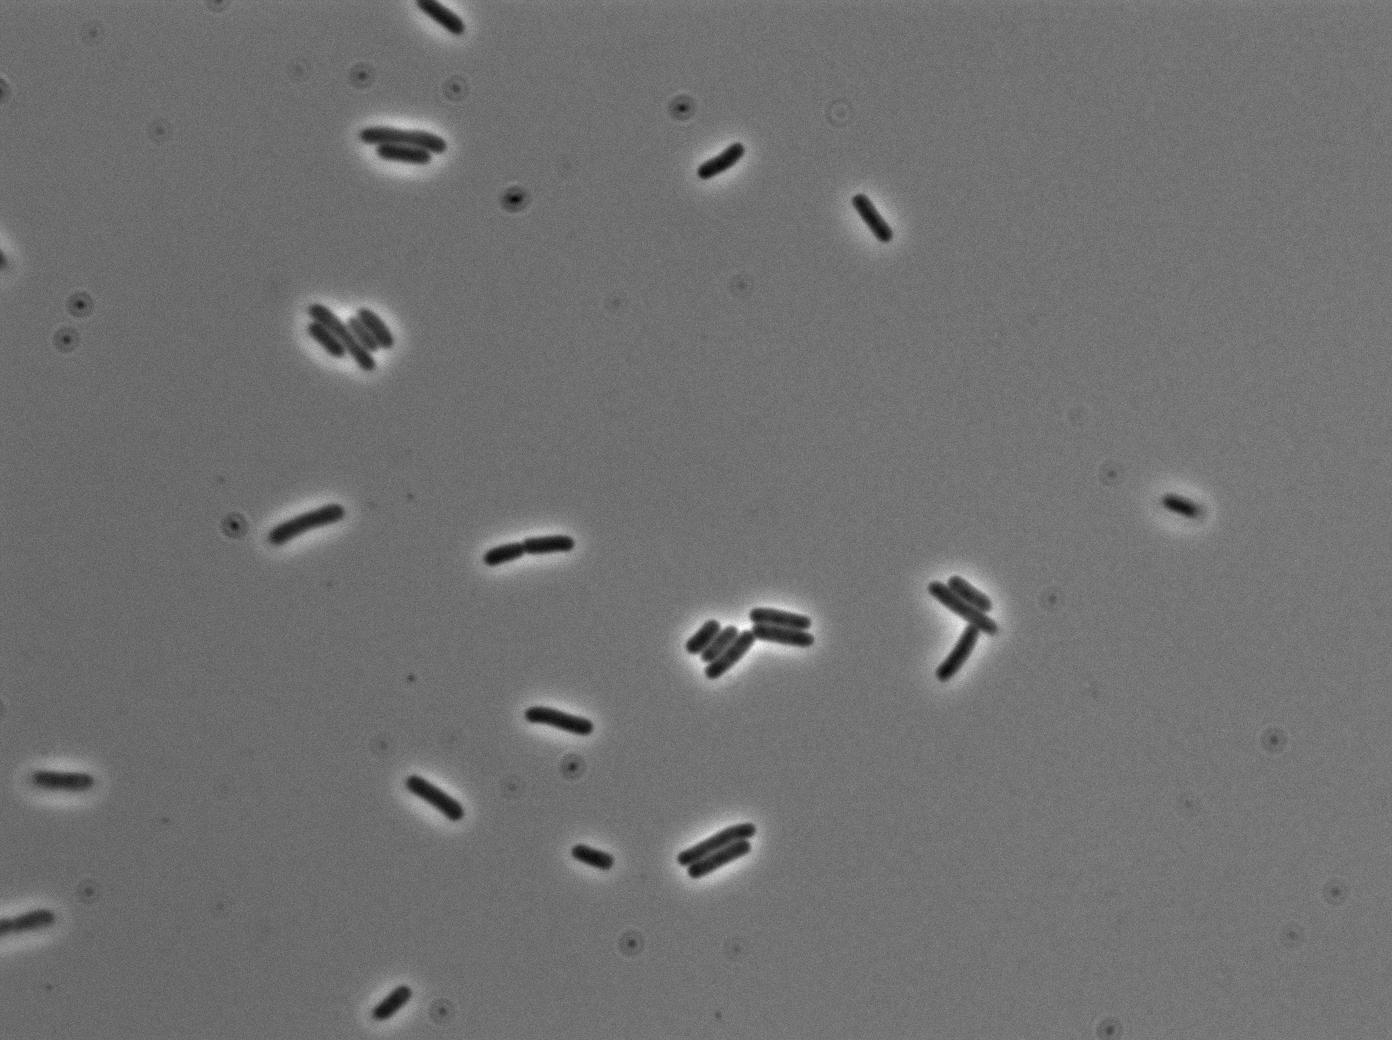
|[[File:plusfluo2.jpg|450px|thumb|center|E.coli negative control at 37°C (rfp image)]] | |[[File:plusfluo2.jpg|450px|thumb|center|E.coli negative control at 37°C (rfp image)]] | ||
|} | |} | ||
| + | |||
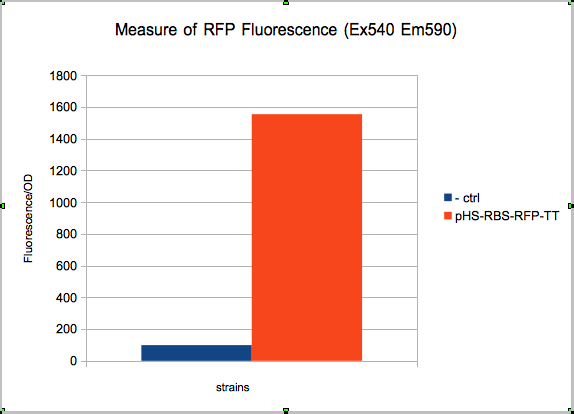
| + | The absolute value of the net fluorescence over OD for induced and non indeuced cells was measured in the TECAN i-control, and plotted below. | ||
[[File:spectrophotometry.jpg|center]] | [[File:spectrophotometry.jpg|center]] | ||
Revision as of 03:58, 22 September 2011

pHyperSpank characterisation
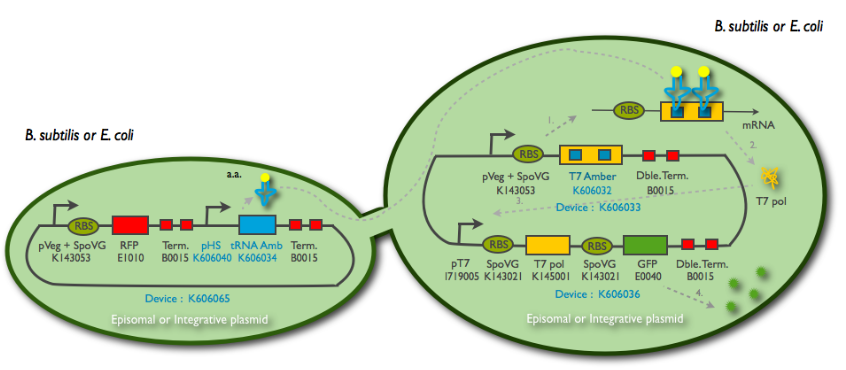
The Hyperspank promoter was designed to be compatible for B. subtilis. It is shorter thant the classic one, but is also recognised by E. coli polymerases.
We cloned it first behind the amber tRNA that would induce a GFP amber on an other plasmid. Then to characterise it we cloned it behind an RFP, into TURBO cells that are LacIq to allow the promoter to be the less leacky possible.
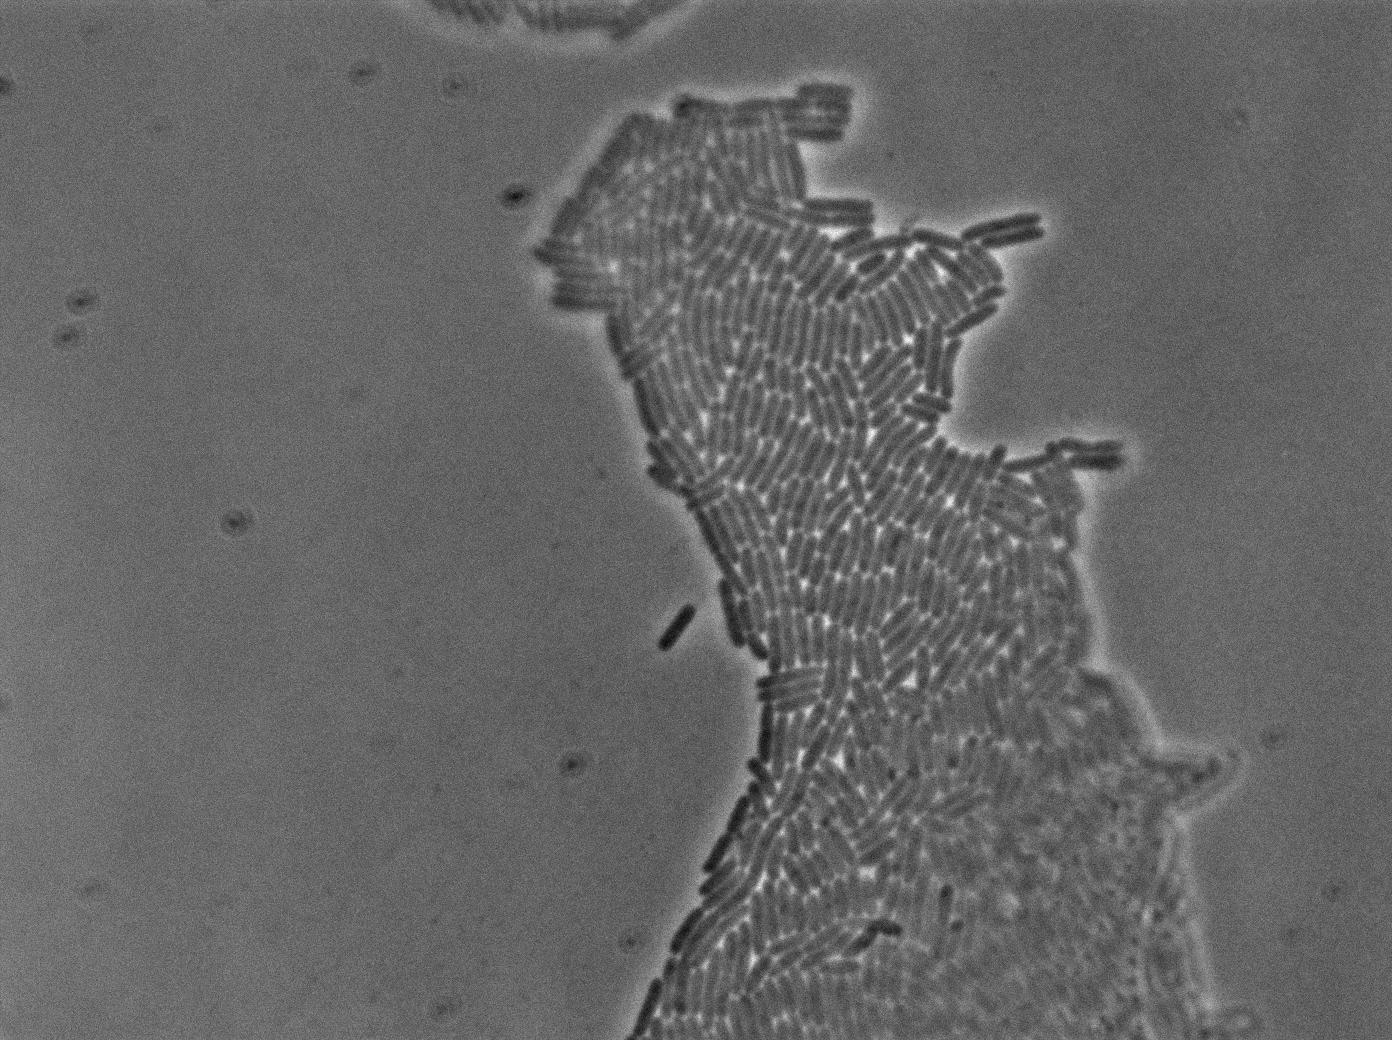
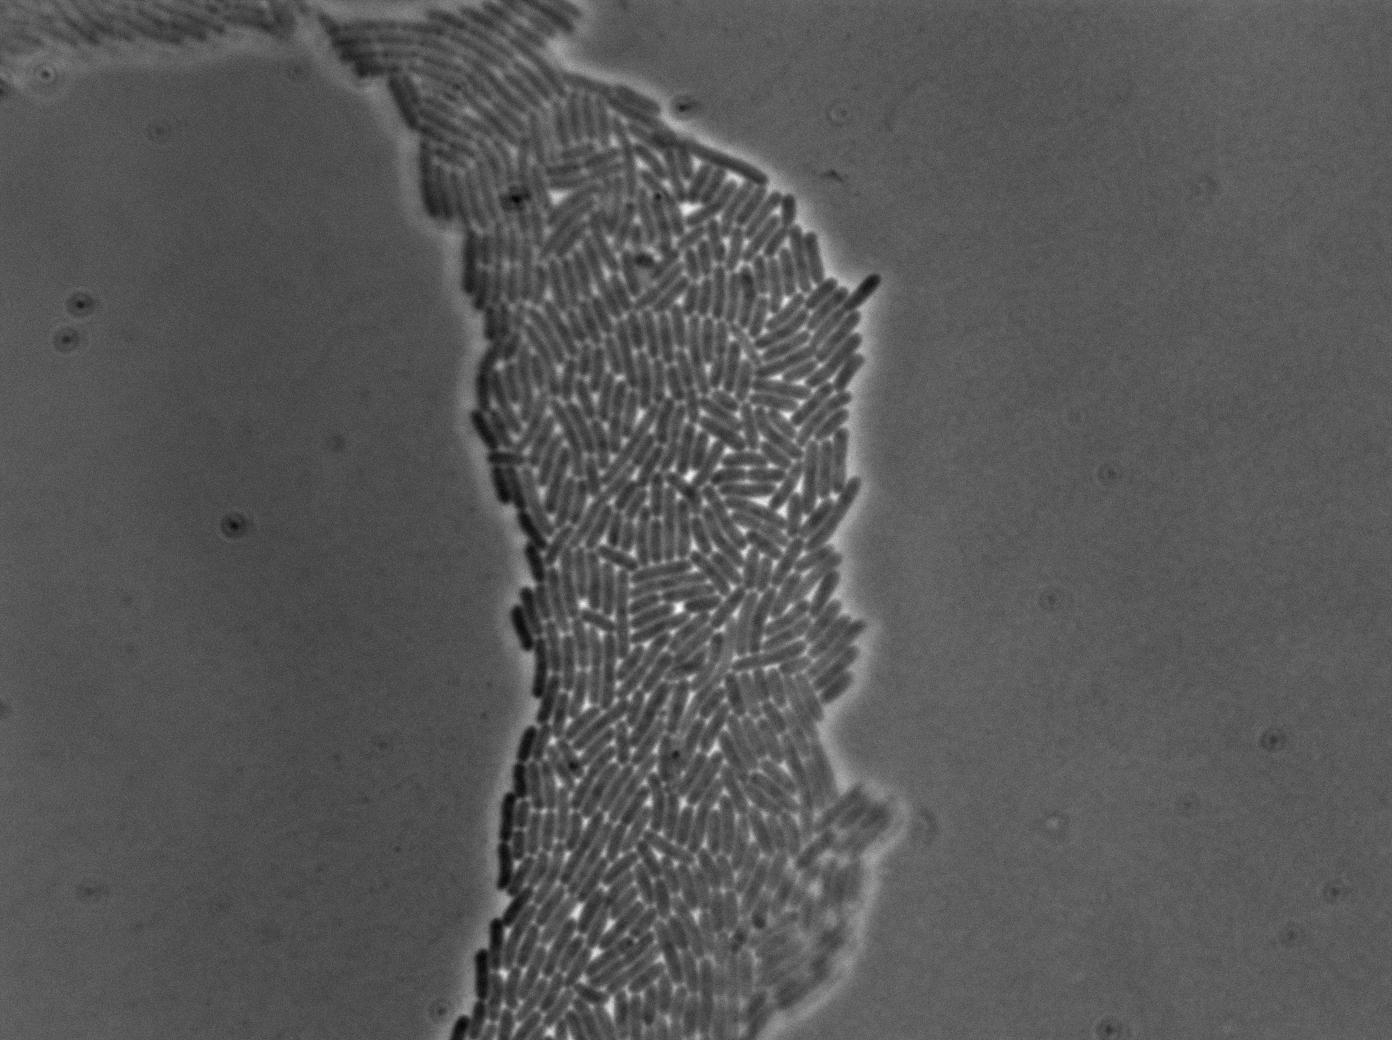
The pictures below are the results of an IPTG induction.
Results
The new biobrick pHS (K606040) was cloned in front of an RFP terminator. The fluorescence was seen under the microscope with strains induced and not induced but IPTG
| E. coli containing Hyperspank +RBS+RFP with and whithout IPTG at 37°C | |
| E. coli containing Hyperspank +RBS+RFP with and whithout IPTG at 37°C | |
The absolute value of the net fluorescence over OD for induced and non indeuced cells was measured in the TECAN i-control, and plotted below.
 "
"

