Team:EPF-Lausanne/Our Project/TetR mutants/MITOMI data
From 2011.igem.org
(→Mutant TetRs) |
(→Mutant TetRs) |
||
| Line 215: | Line 215: | ||
<html> <a href=http://partsregistry.org/Part:BBa_K613017>BBa_K613017</a></html> | <html> <a href=http://partsregistry.org/Part:BBa_K613017>BBa_K613017</a></html> | ||
| + | |||
| + | ===In vitro characterization=== | ||
| + | |||
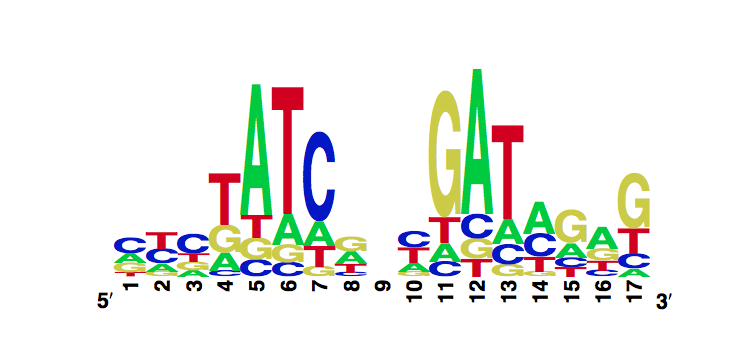
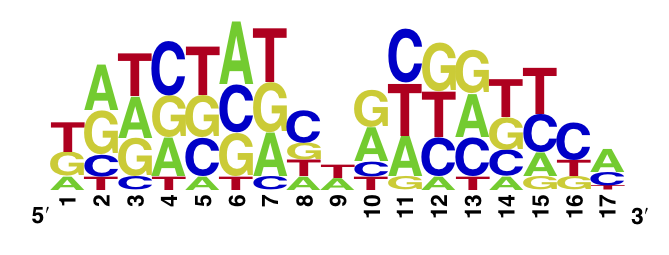
| + | Using the <html> <a href="https://2011.igem.org/Team:EPF-Lausanne/Our_Project/TetR_mutants/MITOMI_data">MITOMI</a></html> technique we determined the DNA binding landscape of the TetR Y42F mutant. To do so, first we designed and generated the library of double stranded DNA sequences that cover all possible single base substitution within the tetO operator sequence. Based on that library we measured the dissociation constants of the mutant to variable tetO-like sequences and determined the specificity of the mutant to the tet operator sequence (expressed as a PWM). For the Y42F mutant we observed the decrease of the specificity compared to the wild-type tetR sequence. | ||
| + | |||
| + | WebLogo we obtained for the Y42F mutant: | ||
| + | |||
| + | [[File:EPFL2011_WebLogo_Y42F.png|700px]] | ||
| + | |||
| + | |||
| + | '''Reference:'''<p> | ||
| + | Workman CT, Yin Y, Corcoran DL, Ideker T, Stormo GD, Benos PV. | ||
| + | enoLOGOS: a versatile web tool for energy normalized sequence logos. | ||
| + | Nucleic Acids Res. 2005 Jul 1;33:W389-92.</p> | ||
| + | |||
| + | |||
| + | ====Position Weight Matrix==== | ||
| + | {| {{table}} | ||
| + | | align="center" style="background:#f0f0f0;"|'''PO''' | ||
| + | | align="center" style="background:#f0f0f0;"|'''A''' | ||
| + | | align="center" style="background:#f0f0f0;"|'''T''' | ||
| + | | align="center" style="background:#f0f0f0;"|'''C''' | ||
| + | | align="center" style="background:#f0f0f0;"|'''G''' | ||
| + | |- | ||
| + | | 1||0.385241||0.85619||0||0.693793 | ||
| + | |- | ||
| + | | 2||1.30965||0.385241||0.629213||1.2542 | ||
| + | |- | ||
| + | | 3||1.18851||1.22909||0.385241||1.09825 | ||
| + | |- | ||
| + | | 4||1.1084||0.385241||1.57045||1.20206 | ||
| + | |- | ||
| + | | 5||0.385241||1.3955||1.10171||1.2069 | ||
| + | |- | ||
| + | | 6||1.80251||0.385241||1.37974||1.23728 | ||
| + | |- | ||
| + | | 7||1.25285||1.54821||0.385241||1.43937 | ||
| + | |- | ||
| + | | 8||0.385241||0.475161||0.93954||0.488479 | ||
| + | |- | ||
| + | | 9||0.341937||0.385241||0||0.053757 | ||
| + | |- | ||
| + | | 10||0.973293||0.385241||0.426141||1.06563 | ||
| + | |- | ||
| + | | 11||1.1587||1.50073||1.5542||0.385241 | ||
| + | |- | ||
| + | | 12||0.385241||1.30762||1.11351||1.39762 | ||
| + | |- | ||
| + | | 13||1.23638||0.385241||1.11282||1.24361 | ||
| + | |- | ||
| + | | 14||0.385241||1.09074||0.75983||0.933921 | ||
| + | |- | ||
| + | | 15||0.679315||1.33124||1.09937||0.385241 | ||
| + | |- | ||
| + | | 16||0||0.467396||1.08277||0.385241 | ||
| + | |- | ||
| + | | 17||0.664957||0.130021||0.385241||0 | ||
| + | |||
| + | |} | ||
| + | |||
| + | Each row represents the changes in binding energy, ΔΔG, compared to the reference sequence upon the substitution to the indicated nucleotide at certain position within the target DNA element. Values are indicated in kcal/mol. | ||
| + | |||
==Y42F K108E== | ==Y42F K108E== | ||
Revision as of 02:10, 22 September 2011
MITOMI Data
In vitro Main | Why TetR? | Mutant TetRs | MITOMI Data | In-vivo & In-vitro outlineTo find out more about the MITOMI method of characterization, please click here.
The raw data from the successful experiments can be found here.
Contents |
Wildtype TetR
Mutant TetRs
V36F
In vitro characterization
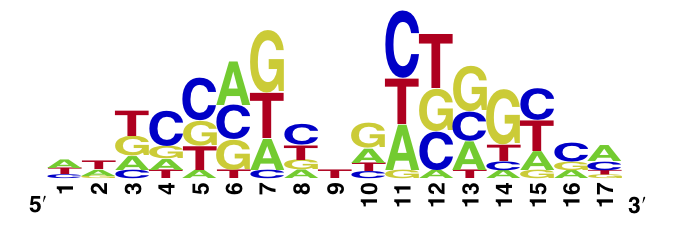
Using the MITOMI technique we determined the DNA binding landscape of the TetR V36F mutant. To do so, first we designed and generated the library of double stranded DNA sequences that cover all possible single base substitution within the tetO operator sequence. Based on that library we measured the dissociation constants of the mutant to variable tetO-like sequences and determined the specificity of the mutant to the tet operator sequence (expressed as a PWM).
WebLogo we obtained for the V36F mutant:
Workman CT, Yin Y, Corcoran DL, Ideker T, Stormo GD, Benos PV. enoLOGOS: a versatile web tool for energy normalized sequence logos. Nucleic Acids Res. 2005 Jul 1;33:W389-92.
Position Weight Matrix
| PO | A | T | C | G |
| 1 | 0.164072 | 0.519334 | 0 | 0.22966 |
| 2 | 0.642569 | 0.164072 | 0.188965 | 0.943314 |
| 3 | 1.04481 | 0.558693 | 0.164072 | 0.848264 |
| 4 | 0.959646 | 0.164072 | 2.17536 | 0.718959 |
| 5 | 0.164072 | 1.19894 | 1.79469 | 1.56685 |
| 6 | 1.46463 | 0.164072 | 1.74384 | 1.54845 |
| 7 | 0.966397 | 1.07557 | 0.164072 | 1.72883 |
| 8 | 0.164072 | 0.504312 | 0.755195 | 0.148902 |
| 9 | 0.0876645 | 0.164072 | 0 | 0.0156484 |
| 10 | 0.289722 | 0.164072 | 0.00707563 | 0.843474 |
| 11 | 1.77568 | 1.3447 | 2.34804 | 0.164072 |
| 12 | 0.164072 | 1.72354 | 1.62782 | 1.49176 |
| 13 | 0.877518 | 0.164072 | 1.30879 | 1.9052 |
| 14 | 0.164072 | 0.544642 | 0.3387 | 1.7537 |
| 15 | 0.540091 | 0.8821 | 1.0861 | 0.164072 |
| 16 | 0 | 0.280358 | 0.442769 | 0.164072 |
| 17 | 0.31238 | 0 | 0.164072 | 0 |
Each row represents the changes in binding energy, ΔΔG (kcal/mol), compared to the reference sequence upon the substitution to the indicated nucleotide at certain position within the target DNA element. Values are indicated in kcal/mol.
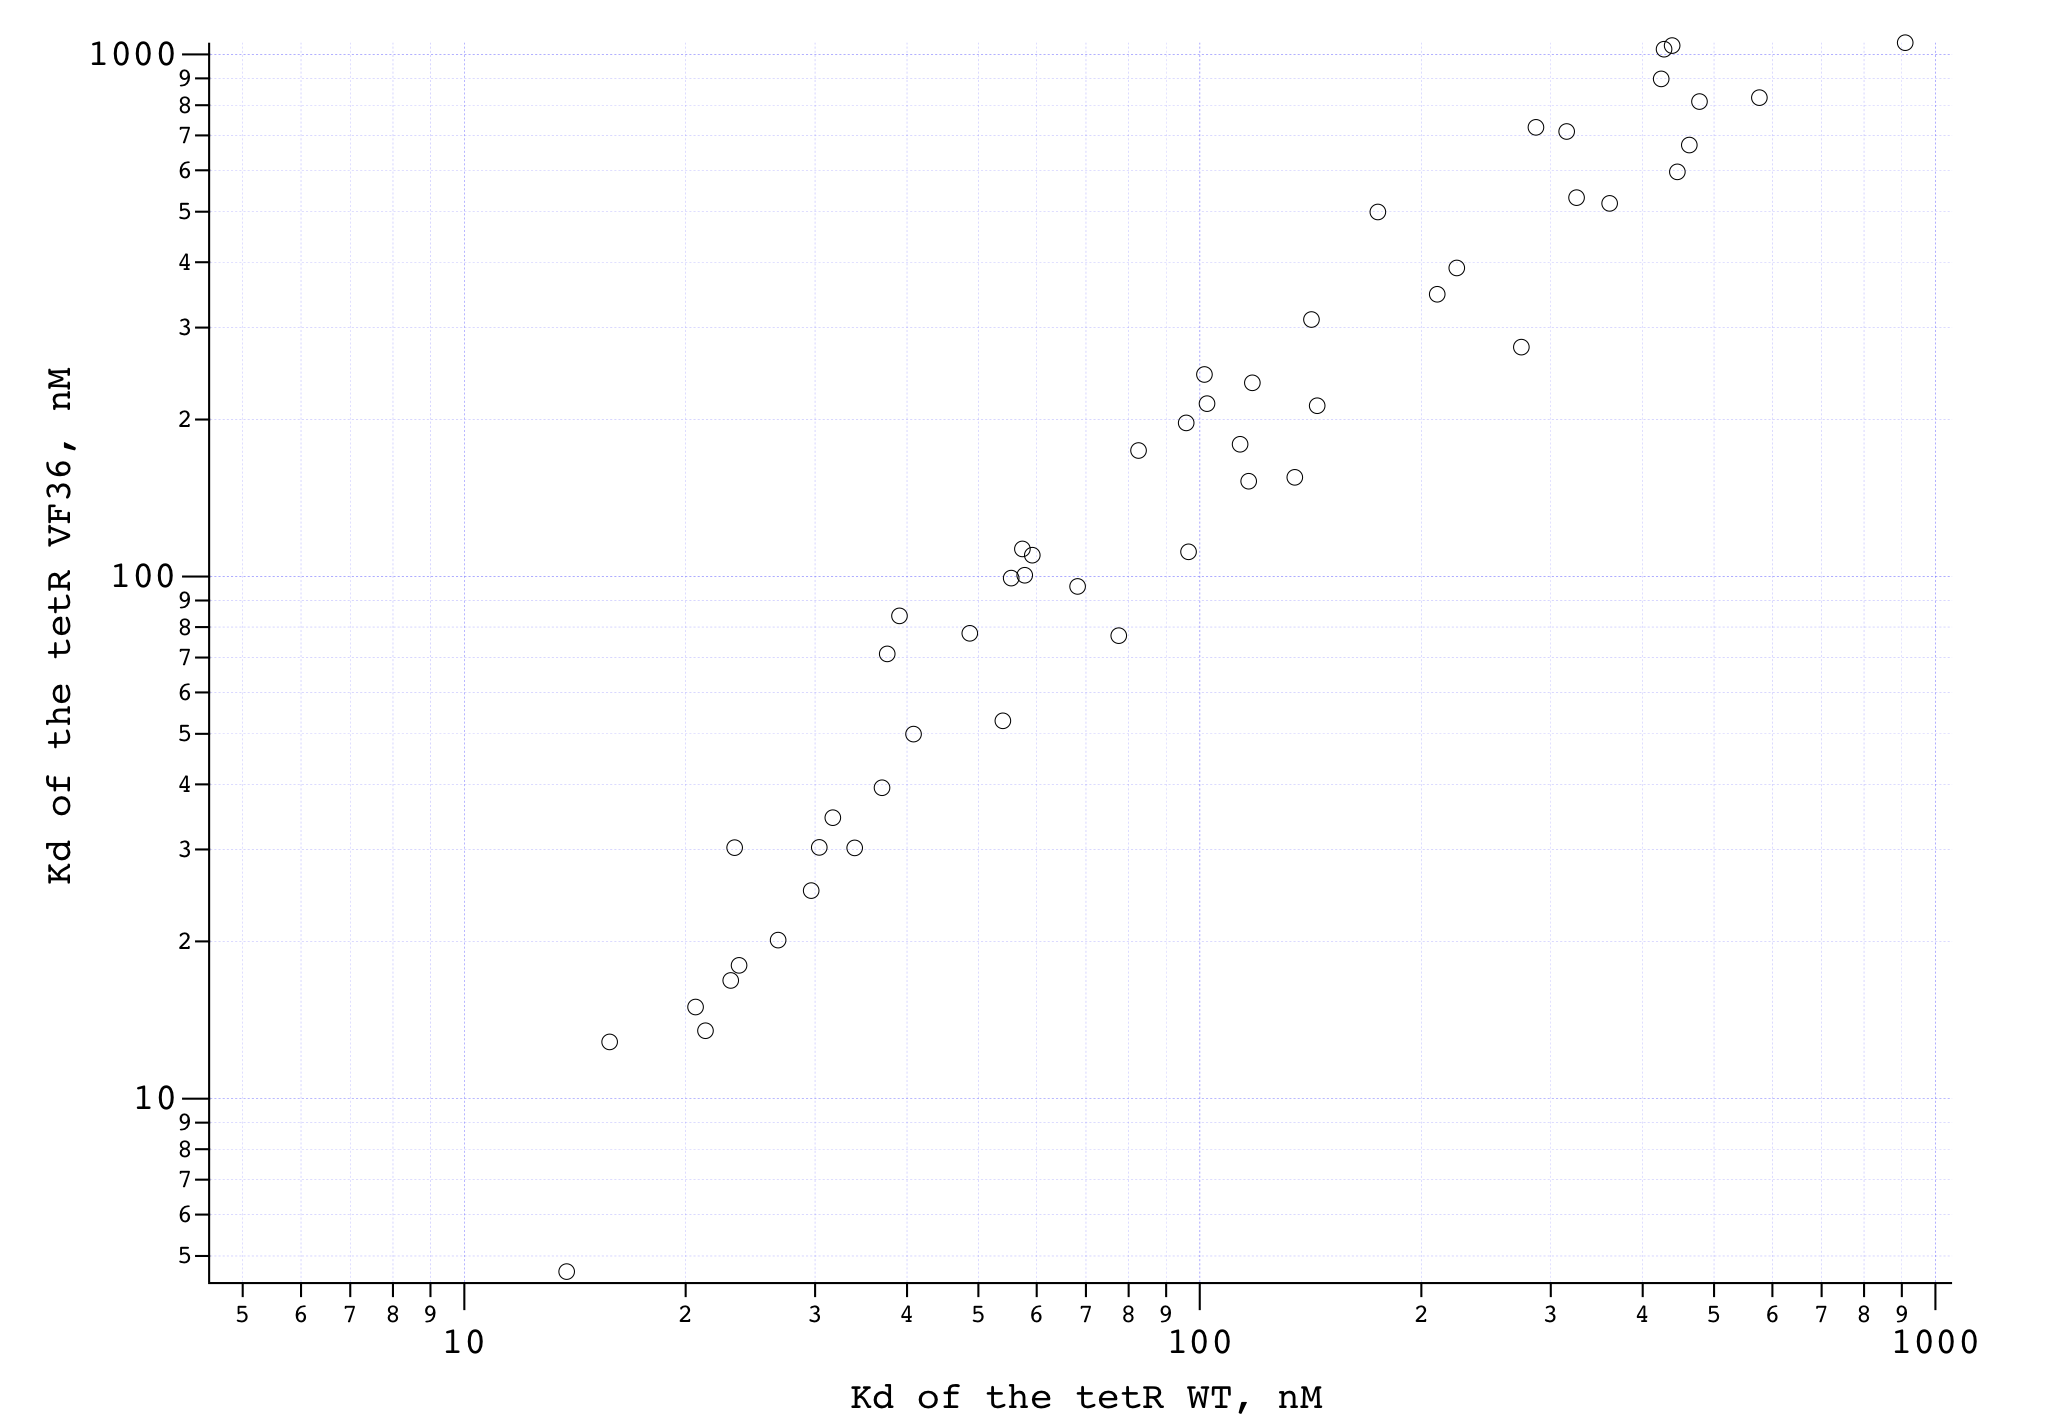
We compared the measured DNA binding affinities of the V36F mutant to the affinities obtained for the wt-TetR and found that V36F mutant interacts with the tetO as strong as the wild-type variant.
V36F W43S
E37A W43S T141A
In vitro characterization
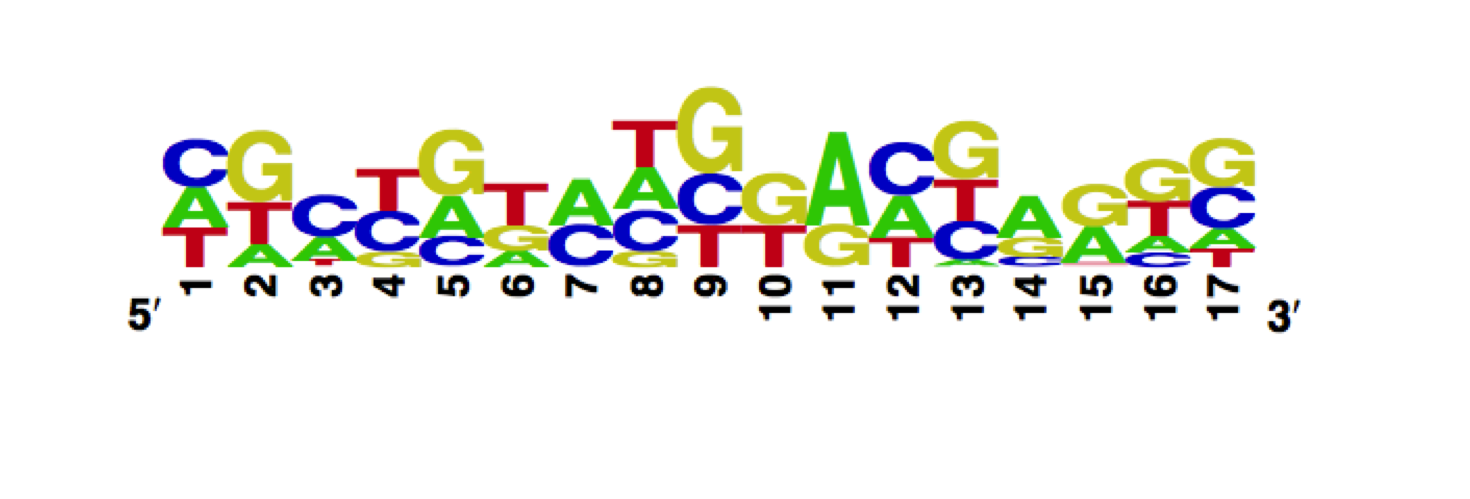
Using the MITOMI technique we determined the DNA binding landscape of the TetR E37A W43S T141A mutant. To do so, first we designed and generated the library of double stranded DNA sequences that cover all possible single base substitution within the tetO operator sequence. Based on that library we measured the dissociation constants of the mutant to variable tetO-like sequences and determined the specificity of the mutant to the tet operator sequence (expressed as a PWM).
WebLogo we obtained for the E37A W43S T141A mutant:
Workman CT, Yin Y, Corcoran DL, Ideker T, Stormo GD, Benos PV. enoLOGOS: a versatile web tool for energy normalized sequence logos. Nucleic Acids Res. 2005 Jul 1;33:W389-92.
Position Weight Matrix
| PO | A | T | C | G |
| 1 | 0.298921 | 0.228558 | 0.136478 | 0.0565634 |
| 2 | 0.217725 | 0.298921 | 0.0365532 | 0.101569 |
| 3 | 0.486164 | 0.884721 | 0.298921 | 0.689301 |
| 4 | 0.381337 | 0.298921 | 1.2275 | 0.443129 |
| 5 | 0.298921 | 0.829256 | 1.48516 | 0.861923 |
| 6 | 1.52008 | 0.298921 | 1.20145 | 1.04388 |
| 7 | 1.08347 | 1.57658 | 0.298921 | 2.1751 |
| 8 | 0.298921 | 0.506289 | 0.723699 | 0.34977 |
| 9 | 0.0627581 | 0.298921 | 0 | 0.0173955 |
| 10 | 0.49991 | 0.298921 | 0.250601 | 0.869584 |
| 11 | 1.58199 | 1.5844 | 2.35356 | 0.298921 |
| 12 | 0.298921 | 1.88623 | 1.34104 | 1.46941 |
| 13 | 1.00088 | 0.298921 | 1.01931 | 1.57583 |
| 14 | 0.298921 | 0.56873 | 0.306484 | 1.91995 |
| 15 | 0.65822 | 1.06676 | 1.10609 | 0.298921 |
| 16 | 0.290169 | 0.067613 | 0.660542 | 0.298921 |
| 17 | 0.557743 | 0.160129 | 0.298921 | 0.134017 |
Each row represents the changes in binding energy, ΔΔG, compared to the reference sequence upon the substitution to the indicated nucleotide at certain position within the target DNA element. Values are indicated in kcal/mol.
P39K
In vitro characterization
Using the MITOMI technique we determined the DNA binding landscape of the TetR V36F mutant. To do so, first we designed and generated the library of double stranded DNA sequences that cover all possible single base substitution within the tetO operator sequence. Based on that library we measured the dissociation constants of the mutant to variable tetO-like sequences and determined the specificity of the mutant to the tet operator sequence (expressed as a PWM).
WebLogo we obtained for the P39K mutant:
Workman CT, Yin Y, Corcoran DL, Ideker T, Stormo GD, Benos PV. enoLOGOS: a versatile web tool for energy normalized sequence logos. Nucleic Acids Res. 2005 Jul 1;33:W389-92.
Position Weight Matrix
| PO | A | T | C | G |
| 1 | 0.259286 | 0.242355 | 0.296487 | 0 |
| 2 | 0.13749 | 0.259286 | 0 | 0.444867 |
| 3 | 0.149356 | 0.0391642 | 0.259286 | 0 |
| 4 | 0.000432676 | 0.259286 | 0.250803 | 0.09369 |
| 5 | 0.259286 | 0 | 0.183728 | 0.411598 |
| 6 | 0.104299 | 0.259286 | 0 | 0.157345 |
| 7 | 0.287302 | 0.0195324 | 0.259286 | 0.0244544 |
| 8 | 0.259286 | 0.286228 | 0.256377 | 0.0991247 |
| 9 | 0 | 0.259286 | 0.317281 | 0.536557 |
| 10 | 0 | 0.259286 | 0 | 0.31848 |
| 11 | 0.582859 | 0 | 0 | 0.259286 |
| 12 | 0.259286 | 0.184012 | 0.330234 | 0 |
| 13 | 0.0462643 | 0.259286 | 0.242912 | 0.357439 |
| 14 | 0.259286 | 0.011556 | 0.0598842 | 0.120511 |
| 15 | 0.228422 | 0.0270438 | 0.00125937 | 0.259286 |
| 16 | 0.102476 | 0.214565 | 0.0872813 | 0.259286 |
| 17 | 0.127319 | 0.112242 | 0.259286 | 0.299159 |
Each row represents the changes in binding energy, ΔΔG, compared to the reference sequence upon the substitution to the indicated nucleotide at certain position within the target DNA element. Values are indicated in kcal/mol.
Y42F
In vitro characterization
Using the MITOMI technique we determined the DNA binding landscape of the TetR Y42F mutant. To do so, first we designed and generated the library of double stranded DNA sequences that cover all possible single base substitution within the tetO operator sequence. Based on that library we measured the dissociation constants of the mutant to variable tetO-like sequences and determined the specificity of the mutant to the tet operator sequence (expressed as a PWM). For the Y42F mutant we observed the decrease of the specificity compared to the wild-type tetR sequence.
WebLogo we obtained for the Y42F mutant:
Workman CT, Yin Y, Corcoran DL, Ideker T, Stormo GD, Benos PV. enoLOGOS: a versatile web tool for energy normalized sequence logos. Nucleic Acids Res. 2005 Jul 1;33:W389-92.
Position Weight Matrix
| PO | A | T | C | G |
| 1 | 0.385241 | 0.85619 | 0 | 0.693793 |
| 2 | 1.30965 | 0.385241 | 0.629213 | 1.2542 |
| 3 | 1.18851 | 1.22909 | 0.385241 | 1.09825 |
| 4 | 1.1084 | 0.385241 | 1.57045 | 1.20206 |
| 5 | 0.385241 | 1.3955 | 1.10171 | 1.2069 |
| 6 | 1.80251 | 0.385241 | 1.37974 | 1.23728 |
| 7 | 1.25285 | 1.54821 | 0.385241 | 1.43937 |
| 8 | 0.385241 | 0.475161 | 0.93954 | 0.488479 |
| 9 | 0.341937 | 0.385241 | 0 | 0.053757 |
| 10 | 0.973293 | 0.385241 | 0.426141 | 1.06563 |
| 11 | 1.1587 | 1.50073 | 1.5542 | 0.385241 |
| 12 | 0.385241 | 1.30762 | 1.11351 | 1.39762 |
| 13 | 1.23638 | 0.385241 | 1.11282 | 1.24361 |
| 14 | 0.385241 | 1.09074 | 0.75983 | 0.933921 |
| 15 | 0.679315 | 1.33124 | 1.09937 | 0.385241 |
| 16 | 0 | 0.467396 | 1.08277 | 0.385241 |
| 17 | 0.664957 | 0.130021 | 0.385241 | 0 |
Each row represents the changes in binding energy, ΔΔG, compared to the reference sequence upon the substitution to the indicated nucleotide at certain position within the target DNA element. Values are indicated in kcal/mol.
Y42F K108E
P39Q Y42M
P39Q Y42M L197S
P39Q Y42M L52P
E37A P39K
E37A P39Q Y42F
 "
"
