Team:British Columbia/Model2
From 2011.igem.org
| Line 43: | Line 43: | ||
To evaluate the effectiveness of the synthetic yeast dispersal strategy, one way is to capture beetles in the environment (again either by using a trap box or collecting an infested tree) and determine what percentage carries the synthetic yeast after different periods of time since the start of the program. | To evaluate the effectiveness of the synthetic yeast dispersal strategy, one way is to capture beetles in the environment (again either by using a trap box or collecting an infested tree) and determine what percentage carries the synthetic yeast after different periods of time since the start of the program. | ||
| - | <html><center> | + | <html><center><h3>Model Description</h3></center></html> |
| - | <h3>Predictions</h3></center></html> | + | |
| + | A MPB population of size <i>N</i> is described as a collection of <i>n</i> subpopulations. At year <i>t</i>, subpopulation <i>i</i> is centered at <i>c<sup>i</sup>=(x<sup>i</sup>,y<sup>i</sup>)</i> and is normally distributed along the West-East axis (<i>x</i>) with the standard deviation and along the North-South axis (<i>y</i>) with . The subpopulation expansion rate is defined as the rate of change in the mean subpopulation standard deviation. Two subpopulation expansion rates are defined to reflect two-dimensional expansion: one for the West-East axis (<i>s<sub>x</sub></i>) and the other for the North-South axis (<i>s<sub>y</sub></i>). Suppose that subpopulations expand linearly with time, we can estimate the subpopulation expansion rate along each axis using standard linear regression. The slope is interpreted as the subpopulation expansion rate. Thus, we can conveniently extrapolate the standard deviation of subpopulation <i>i</i> at time <i>t+k</i> along each axis: | ||
| + | |||
| + | (1) | ||
| + | |||
| + | (2) | ||
| + | |||
| + | The growth of the MPB population is assumed to follow a linear model. Then, the growth rate (<i>v</i>) is simply the slope of the regression equation that predicts MPB population size over time. The above parameters can be estimated from available Geographical Information System (GIS) data that indicate the distribution of MPB across BC. Below, we describe the statistical methods used to estimate those parameters. | ||
| + | |||
| + | <html><center><h3>Predictions</h3></center></html> | ||
We simulated the expansion of the MPB population from year 2011 to 2020 using the estimates obtained from the clustering analysis. For cost estimation and prediction of emergence of subpopulations, refer to our Model Methodology above. | We simulated the expansion of the MPB population from year 2011 to 2020 using the estimates obtained from the clustering analysis. For cost estimation and prediction of emergence of subpopulations, refer to our Model Methodology above. | ||
Revision as of 01:13, 28 October 2011

Modeling the mountain pine beetle epidemic using a probabilistic clustering approach
The Beetle's Strategy
The mountain pine beetle lives in symbiosis with the bluestain fungus which can break down monoterpenes produced by the tree to deter insect attacks. Their relationship allows the beetle to avoid the toxic effects of the monoterpenes, while the fungus is carried inside the tree where it can grow and colonize. The beetles lay their larvae that consume the fungus for nutrients. Once the larvae grow into adult beetles, they carry the fungus and infect other trees. Meanwhile, the trees turn red and die because the fungus blocks transport of water and nutrients through the tree. Over the last decade, the pine beetle epidemic has spread rapidly through North American pine forests, causing mass destruction to forest health and reliant ecosystems.
Our Theoretical Strategy: iSynthase Yeast
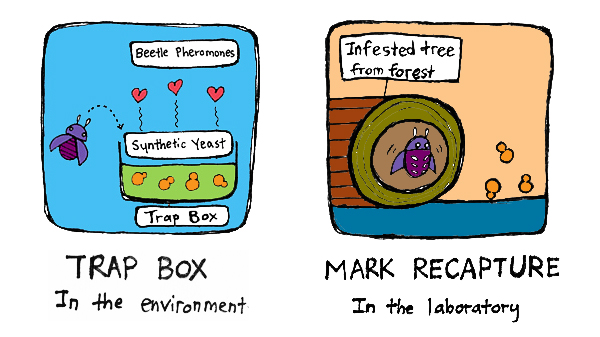
To establish high levels of anti-beetle monoterpenes in the trees, we propose the introduction of our monoterpene-producing yeast into the environment. For this, we have two strategies: the iSynthase Trap Box and the Mark-Release-Recapture strategy. Both involve exposing beetles to the synthetic yeast and releasing them to the environment to disperse the yeast along with the pine beetle infestation.
Previous studies have shown inhibition of bluestain fungus growth upon interaction with certain concentrations of monoterpenes. Assuming that our yeast does inhibit the growth of bluestain fungus due to the monoterpenes produced, this will also subdue the mountain pine beetle population that depends on the blue-stain fungus. We predict that the spread of our yeast will be similar to the pine-beetle infestation, with the hope that it will spread from beetle to beetle. Therefore, the spread of our yeast product will fall once pine-beetle population declines.
The iSynthase Trap Box strategy places trap boxes at strategic locations in the forest to attract beetles with pheromones. These beetles enter the box and leave with the synthetic yeast.
The Mark-Release-Recapture strategy involves collecting trees infested with beetles, rearing these in the lab and exposing them to our synthetic yeast, before releasing them back into the environment at strategic locations.
In both cases, the dispersal of beetles back into the environment comes with some risk. Beetles need to use their reserved energy to make several survival decisions including (i) does this forest contain susceptible tree species? (ii) are there other beetles to collaborate with? (iii) does the potential host tree have too much light and warmth? (iv) is this host tree over-populated? (v) what is the defensive capacity of the tree?
To evaluate the effectiveness of the synthetic yeast dispersal strategy, one way is to capture beetles in the environment (again either by using a trap box or collecting an infested tree) and determine what percentage carries the synthetic yeast after different periods of time since the start of the program.
Model Description
A MPB population of size N is described as a collection of n subpopulations. At year t, subpopulation i is centered at ci=(xi,yi) and is normally distributed along the West-East axis (x) with the standard deviation and along the North-South axis (y) with . The subpopulation expansion rate is defined as the rate of change in the mean subpopulation standard deviation. Two subpopulation expansion rates are defined to reflect two-dimensional expansion: one for the West-East axis (sx) and the other for the North-South axis (sy). Suppose that subpopulations expand linearly with time, we can estimate the subpopulation expansion rate along each axis using standard linear regression. The slope is interpreted as the subpopulation expansion rate. Thus, we can conveniently extrapolate the standard deviation of subpopulation i at time t+k along each axis:
(1)
(2)
The growth of the MPB population is assumed to follow a linear model. Then, the growth rate (v) is simply the slope of the regression equation that predicts MPB population size over time. The above parameters can be estimated from available Geographical Information System (GIS) data that indicate the distribution of MPB across BC. Below, we describe the statistical methods used to estimate those parameters.
Predictions
We simulated the expansion of the MPB population from year 2011 to 2020 using the estimates obtained from the clustering analysis. For cost estimation and prediction of emergence of subpopulations, refer to our Model Methodology above.
 "
"


