Team:TzuChiU Formosa/Modeling
From 2011.igem.org
| Line 53: | Line 53: | ||
Below is the gene we improved. Their productivity is compare with our positive control gene. | Below is the gene we improved. Their productivity is compare with our positive control gene. | ||
| - | 1.BBa_K571004 + acsAB | + | <br>1.BBa_K571004 + acsAB |
| - | 2.BBa_K571004 + acsCD | + | <br>2.BBa_K571004 + acsCD |
| - | 3.acsAB | + | <br>3.acsAB |
| - | 4.acsCD | + | <br>4.acsCD |
| - | < | + | <br> |
| - | + | https://static.igem.org/mediawiki/2011/f/f9/TCU_MD2.jpg | |
| + | https://static.igem.org/mediawiki/2011/9/94/TCU_MD1.jpg | ||
<br> | <br> | ||
<br> | <br> | ||
Revision as of 03:57, 6 October 2011


Gluconacetobacter hansenii which carries the acsABCD protein has the ability to produce cellulose is our main character in our project. Our project is to transform acsABCD genes into E. coli to monitor the production of cellulose production. We collect the protein produced by the transformed E.coli and Gluconacetobacter hansenii in different time point to monitor the expression of acsABCD gene products and the production of cellulose.
E.coli : Gluconacetobacter hansenii = 163.502Unit : 154.965Unit The ratio is 1.055 While the productivity of Gluconacetobacter hansenii is 1.0032g/3 days. Therefore, we can know that E.Coli has the ability to produce cellulose. In other words, the productivity is 1.0082g/ml.
Method 1 : SDS-PAGE
Observe the performance of acs ABCD protein during PAGE to predict the productivity of cellulose, run 2 SDS-PAGE respectively, one according to the reaction time and another according to the presence of promoter.
The protein purification from E.Coli with acsAB and with acsCD is use to run the SDS-PAGE in order to compare the expression of every protein sample. The expression is then use to predict and calculate the amount of protein produced by the Gluconacetobacter hansenii.
The protein purification from E.Coli with acsAB and with acsCD is use to run the SDS-PAGE in order to compare the expression of every protein sample. The expression is then use to predict and calculate the amount of protein produced by the Gluconacetobacter hansenii.
Gluconacetobacter hansenii has been cultured in the HS medium for 3 days, the growth curve is recorded. On the 3rd day, the cellulose is collected and dried to weigh the nett weight. The highest record of the cellulose collected is 1.0032g by 50cc of Gluconacetobacter hansenii. Finally, 1c.c. of the bacterial medium is extract as positive control. While the E.coli without any extra genes will be the negative control.
The growth curve from both pathways is recorded.
Below is the gene we improved. Their productivity is compare with our positive control gene.
1.BBa_K571004 + acsAB
2.BBa_K571004 + acsCD
3.acsAB
4.acsCD


-difference of reaction time
0hr, 4hrs, 8hrs, 10hrs, and 12hrs of bacterial culture were collected. Compare the high-performance phase of the acs ABCD protein, calculate the productivity of cellulose.
-difference of promoter
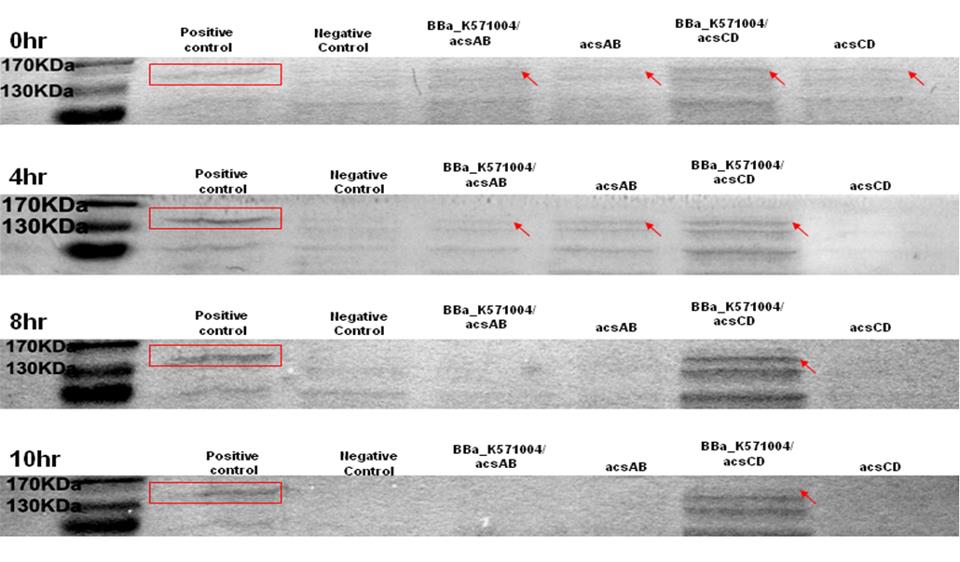
Run 2 SDS-PAGE. One with promoter R0011, one without promoter. The difference of the protein produced is used to predict productivity of cellulose. At 0 hr, the E. coli which carries promoter ([http://partsregistry.org/wiki/index.php?title=Part:BBa_K571004 BBa_k571004]) + acsAB or promoter ([http://partsregistry.org/wiki/index.php?title=Part:BBa_K571004 BBa_k571004]) + acsCD all performed well. At 4hrs, the gene expression is shown as well, especially the gene which carries promoter+acsCD. The gene which carries promoter+acsCD expressed constantly until 10hrs.
The relative molecular mass of acsAB is about 168KDa, while the relative molecular mass of acsCD is about 155KDa. Therefore, we predict that the protein expression should be somewhere between this 2 bands. Therefore, we can conclude that the primer we designed is functional.
1. Compare the positive control with acsAB gene and acsCD gene
2. Calculate the amount of protein produced
3. Predict the productivity of cellulose
Method 2 : Benedict’s test
The bacterial culture which have been induced were collected and the bacteria is to remove, the end product is added with cellulase until the cellulose is fully decomposed. Benedict solution caused the formation of brick red precipitate, the concentration of cellulose is then tested with OD645.
Cellulase is used to break down the cellulose into monosaccharide. Cellulose is a glucose polymer connected through a beta (1-4) glycosidic linkages. Benedict’s test is carried out to test the presence of reducing sugar, such as. The reducing sugar reduces copper(II) ions in these test solutions to copper(I), which then forms a brick red copper(I) oxide precipitate. The color would range from green to brick red respectively depends on the amount of reducing sugar present in the solution. It can detect the concentration of the reducing sugar under the absorbance condition OD645.
Cellulose (beta-1,4 glucan) is the most plentiful biopolymer in nature and is an crucial raw material for many industries. It is synthesized as extracellular fibrils by cellulose synthase not only in plants but also in some bacteria.
Bacteria with cellulose synthase gene use Isopropyl-β- D -1-thiogalactopyranoside (IPTG) as the inducer stimulating the production of protein. In our system, IPTG act as the inducer of the R0011 promoter, which then activate the operon. The activated acs operon encodes the cellulose synthase to synthesize cellulose. The reaction lasts two hours and every two hour we would need to collect the purified cellulose. The nett weight is recorded and the mechanism of cellulose activity on pure cellulose substrates is identified. Lastly, the Benedict’s solution is added to find out the absorbance (optical density [O.D.]) value, in order to calculate the amount of monosaccharide that cellulose can produce.
 "
"


