Team:XMU-China/Model
From 2011.igem.org
(Difference between revisions)
| Line 5: | Line 5: | ||
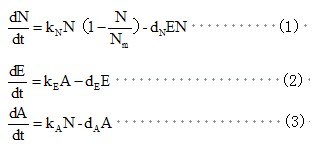
We assume that:(1) without the circuit,changes in viable cell density(N,/ml)follow logistic kinetics;(2)for population-circuit growth, the cell death rate is proportional to the intracellular concentration of the kill protein(E, nM) ;(3)the production rate of E is proportional to AHL concentration(A, nM) ; (4)AHL production rate is proportional to N;(5)degradation of the kill protein and AHL follows first-order kinetics. | We assume that:(1) without the circuit,changes in viable cell density(N,/ml)follow logistic kinetics;(2)for population-circuit growth, the cell death rate is proportional to the intracellular concentration of the kill protein(E, nM) ;(3)the production rate of E is proportional to AHL concentration(A, nM) ; (4)AHL production rate is proportional to N;(5)degradation of the kill protein and AHL follows first-order kinetics. | ||
| - | + | [[Image:XMU_China_124.jpg|left]] | |
| - | + | [[Image:XMU_China_125.jpg|left]] | |
| - | + | ||
| + | <html> | ||
| + | <img src="http://partsregistry.org/wiki/images/4/41/XMU_China_block.jpg"> | ||
| + | </html> | ||
| + | |||
| + | |||
| + | are the rate constants(/h). | ||
| + | |||
| + | [[Image:XMU_China_126.jpg|left]] | ||
| + | |||
| + | |||
| + | <html> | ||
| + | <img src="http://partsregistry.org/wiki/images/4/41/XMU_China_block.jpg"> | ||
| + | </html> | ||
| + | |||
| + | |||
| + | is the carrying capacity in the Limited medium without the cell-death circuit. | ||
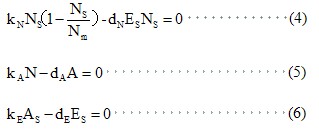
At steady state, we can get the following equations: | At steady state, we can get the following equations: | ||
| - | + | [[Image:XMU_China_127.jpg|left]] | |
| + | |||
| + | |||
| + | <html> | ||
| + | <img src="http://partsregistry.org/wiki/images/4/41/XMU_China_block.jpg"> | ||
| + | </html> | ||
| + | |||
| + | |||
Where subscript ‘s’ represents steady state. | Where subscript ‘s’ represents steady state. | ||
There are two steady-state solutions: | There are two steady-state solutions: | ||
| - | + | [[Image:XMU_China_128.jpg|left]] | |
| + | |||
| + | <html> | ||
| + | <img src="http://partsregistry.org/wiki/images/4/41/XMU_China_block.jpg"> | ||
| + | </html> | ||
| + | |||
| + | |||
We can get the following equation (9) from equation (8) . | We can get the following equation (9) from equation (8) . | ||
| - | + | [[Image:XMU_China_129.jpg|left]] | |
| + | |||
| + | |||
| + | <html> | ||
| + | <img src="http://partsregistry.org/wiki/images/4/41/XMU_China_block.jpg"> | ||
| + | </html> | ||
| + | |||
| + | |||
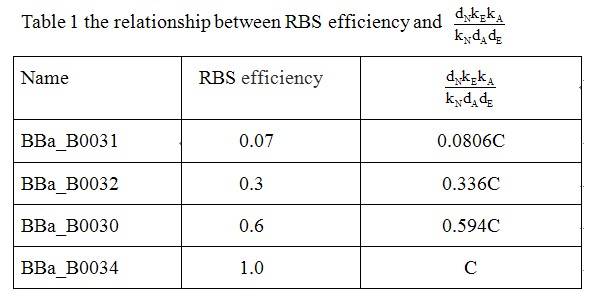
With time limited, we only conducted the experiment on the viable cell density at steady-state with the population-control device with RBS0.07 ,RBS0.3, RBS0.6 and RBS1.0. | With time limited, we only conducted the experiment on the viable cell density at steady-state with the population-control device with RBS0.07 ,RBS0.3, RBS0.6 and RBS1.0. | ||
| - | And we define that: | + | And we define that:[[Image:XMU_China_130.jpg|left]] |
| + | |||
| + | |||
| + | <html> | ||
| + | <img src="http://partsregistry.org/wiki/images/4/41/XMU_China_block.jpg"> | ||
| + | </html> | ||
| + | |||
| + | |||
Computed from our experimental data, we can get the data listed in Table 1. | Computed from our experimental data, we can get the data listed in Table 1. | ||
| - | + | [[Image:XMU_China_131.jpg|left]] | |
| + | |||
| + | |||
| + | <html> | ||
| + | <img src="http://partsregistry.org/wiki/images/4/41/XMU_China_block.jpg"> | ||
| + | </html> | ||
| + | |||
| + | |||
From the model and Table 1, we can conclude that: the efficiency of RBS (a) may have close relationship with kE . Based on the device of RBS1.0, the viable cell density at steady-state (NS ) of other devices with different efficiency of RBS can be shown as equation(10). | From the model and Table 1, we can conclude that: the efficiency of RBS (a) may have close relationship with kE . Based on the device of RBS1.0, the viable cell density at steady-state (NS ) of other devices with different efficiency of RBS can be shown as equation(10). | ||
| - | + | [[Image:XMU_China_132.jpg|left]] | |
| + | |||
| + | |||
| + | <html> | ||
| + | <img src="http://partsregistry.org/wiki/images/4/41/XMU_China_block.jpg"> | ||
| + | </html> | ||
| + | |||
| + | |||
C is -4.96322E-09 in our experiment. | C is -4.96322E-09 in our experiment. | ||
Revision as of 01:59, 6 October 2011
 "
"


