Team:Freiburg/Results
From 2011.igem.org
(→commons) |
(→commons) |
||
| Line 391: | Line 391: | ||
We measured the protein concentration with the bradford-assay. This is a method to determine the total protein concentration. To analyze the protein concentration of the samples, Coomassie Brillant Blue was pippeted to each sample. With the binding of the dye to the proteins the color changes from dark red to blue. The more protein in the solution the more Coomassie dye can bind to proteins and the more the color changes into blue. The absorption of bound Coomassie dye is 595nm. The absorbance is proportional with the amount of bound dye. With a series of Bovine Serum Albumin (BSA) measurements the exact protein concentration of the samples can be determined. BSA acts like a “marker” because the concentration of BSA is known and with a linear calibration line the exact protein concentration can be detected. | We measured the protein concentration with the bradford-assay. This is a method to determine the total protein concentration. To analyze the protein concentration of the samples, Coomassie Brillant Blue was pippeted to each sample. With the binding of the dye to the proteins the color changes from dark red to blue. The more protein in the solution the more Coomassie dye can bind to proteins and the more the color changes into blue. The absorption of bound Coomassie dye is 595nm. The absorbance is proportional with the amount of bound dye. With a series of Bovine Serum Albumin (BSA) measurements the exact protein concentration of the samples can be determined. BSA acts like a “marker” because the concentration of BSA is known and with a linear calibration line the exact protein concentration can be detected. | ||
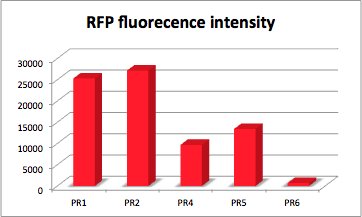
| - | The values of the fluorescence intensity of RFP and GFP deviate from the expected values. We´ve expected PR1 to have the strongest GFP/RFP signal and PR6 with the lowest GFP/RFP signal. The data shows the differences. We could not repeat this measurement another time because of lack of time. | + | The values of the fluorescence intensity of RFP and GFP deviate from the expected values. We´ve expected PR1 to have the strongest GFP/RFP signal and PR6 with the lowest GFP/RFP signal. The data shows the differences. We could not repeat this measurement another time because of lack of time. We could not measure PR1-GFP because the sequencing was negative and there was no time for repeating. The measurement of PR3-RFP was an error and was excluded. |
'''PR-GFP''' | '''PR-GFP''' | ||
Revision as of 02:17, 22 September 2011

Contents |
results
Precipitator
[http://partsregistry.org/Part:BBa_K608404 BBa_K608404] IPTG-inducible Promoter with plastic binding domain-tagged GFP
[http://partsregistry.org/Part:BBa_K608406 BBa_K608406] Precipitator
Protein domain of Precipitator. Artificial Leucine Rich Repeat(LRR) with C and N-terminal hagfish domain fragments capping the artifical middle part. This part is one version of three different designed to bind nickel by histidines,
grouped together pointing away from the horseshoe shaped protein.
Bacterial LRR Consensus of the central LRR fragment:
LxxLxLxxNxLxxLPxxLPxx
Protein code:
CPSRCSCSGTEIRCNSKGLTSVPTGIPSS
ATRLELESNKLQSLPHGVFDK
LTQLTKSNNHLHSLPDNLPAS
LEVLDVSNNHLHSLPDNLPAS
LEVLDVSNNHLHSLPDNLPAS
LEVLDVSNNHLHSLPDNLPAS
LEVLDVSNNHLHSLPDNLPAS
LEVLDVSNNHLHSLPDNLPAS
LKELALDTNQLKSVPDGIFDR
LTSLQKIWLHTNPWDCSCPRIDY
LSRWLNKNSQKEQGSAKCSGSGKPVRSIICP
This protein can be used to complex Nickel or Cobalt. The principal mechanism is comparable to Ni-NTA columns, as chelates the ions. Free binding sites of the ions are then exposed, so that a His-tagged protein can attach to them. The design of the protein is of a particular interest, too. LRR are highly conserved motifs throughout evolution. They appear in all kingdoms of life in almost every thinkable role (Ligases, Receptors, Toxins etc.). Their core is highly conserved and provides a very stable backbone, while the intermediate, non-conserved aminoacids are almost freely interchangeable.
This protein can be used to complex up to 4 Nickel or Cobalt. However the principal design oft he protein is of a particular interest, too. LRR are highly conserved motifs throughout evolution. They appear in all kingdoms of life in almost every thinkable role (Ligases, Receptors, Toxins etc.). Their core is highly conserved and provides a very stable backbone, while the intermediate, non-conserved aminoacids are almost freely interchangeable.
We only submitted one of the three versions, to reduce redundancy in the registry. Please contact us for any questions.
Usage and Biology
The Precipitator is a new artificially designed LRR protein. It is meant as protein that binds Nickel ions with Histidines grouped on its surface. The bound Nickel can then precipitate His-tagged proteins. In our Lab in a Cell it should function as an adaptor between the plastic surface of pipettes and the His-tagged protein. Please look at our detailed description of the design layout in our modeling section. The sequence was synthesised and cloned into the iGEm vector. The submitted sequence was fully confirmed by sequencing.
[http://partsregistry.org/Part:BBa_K608407 BBa_K608407]
Design Notes
Here we investigated an optimal set of non-conserved aminoacids by analysing large sets of similar proteins and databases. You can use this piece of work as a template to design your own protein and give it any function you like, by simply interchanging aminoacids and fusing other domains on the N or C termini. To guarantee proper folding and to shield off the hydrophobic core, a well studied fragment of an LRR protein coming from hagfish was used. This technique was investigated before
Source
The part is constructed from the following protein sequences (PDB: 2z66) N-Terminal hagfish (PDB: 2z62) C-Terminal hagfish (PDB: 3cvr) bacterial ligase
Precipitator fused with GST tag
The Precipitator was fused with the C-terminus of our GST tag in order to extract and further test the construct for its Nickel binding affinity. We successfully cloned it together using the Gibson Assembly and then subsequently pasted it into the iGEM vector. The submitted sequence was partially confirmed by sequencing.
[http://partsregistry.org/Part:BBa_K608408 BBa_K608408] GST-tag
The GST-tag was PCR amplified from a pGEX vector with overhang primers including the iGEM restriction sites and then pasted into the iGEM vector. To verify the functionality of the construct we cloned it before a GFP sequence and expressed it with an IPTG inducible vector. Results see partsregistry page. The submitted sequence was partially confirmed by sequencing.
Results
The non-purified, sonificated supernatant of a 50ml E.coli culture pellet was resuspended in 7.5ml PBS. This sample delivered 319,4 µg/µl of protein detected with a Bradford assay. A second identical sample was GST-purified with a Glutathion-Sepharose pull down assay and resulted in 1ml of sample with a protein concentration of 1,6 µg/µl. However both concentrations were a little above the straight calibration line values. Therefore the results are not perfectly quantified, but the numbers are still significant enough to provide a good proof of the functionality of the assay.
Then the GFP fluorescence of 100µl of supernatant of both samples was measured with a plate reader:
Non-purified: 180630
GST-purified: 243011
Thus the ratio of GFP absorbance / 1µg protein is:
Non-purified: 5642
GST-purified: 1432257
If the values of the Bradford assay are assumed as correct, the purified sample has a 254x higher GFP concentration than the non-purified sample. Due to 3 washing steps it can be assumed that there is barely any other protein left except GFP. Furthermore it can be estimated that only 17% of the total GFP amount present in the 50ml cell culture, could be captured using this assay.
Methods
Plate reader:
The fluorescence intensity and protein concentration were measured with the FLUOstar Omega, which is a multi-mode microplate reader.
Samples were pipetted into the microplate and analyzed via the plate reader. In this experiment we focused on the protein concentration and the fluorescence intensity of GFP.
Bradford-assay: A method to determine the total protein concentration.
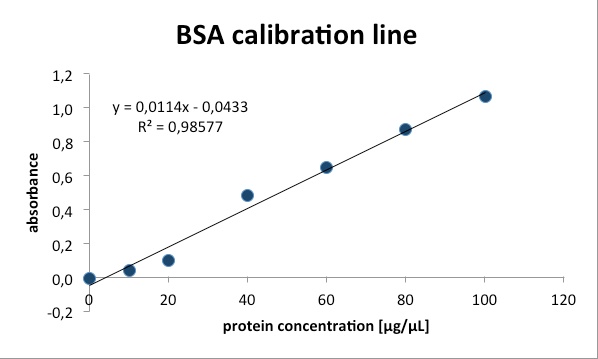
To analyze the protein concentration of the samples, Coomassie Brillant Blue was pippeted to each sample. With the binding of the dye to the proteins the color changes from dark red to blue. The more protein in the solution the more Coomassie dye can bind to proteins and the more the color changes into blue. The absorption of bound Coomassie dye is 595nm. The absorbance is proportional with the amount of bound dye. With a series of Bovine Serum Albumin (BSA) measurements the exact protein concentration of the samples can be determined. BSA acts like a “marker” because the concentration of BSA is known and with a linear calibration line the exact protein concentration can be detected.
Usage and Biology
Prepare construct
- Cloning: Clone the GST Biobrick part BBa_K608408 beforte the N-terminus of the protein you wish to purify. You may want to put a Glycine linker inbetween the two parts, for better expression and folding proterties of the fusion protein. DO NOT USE THE RFC10 STANDARD, but another, which allows fusion proteins. We recommend the Gibson Assembly, it worked conviently for us.
- Vector: You may want to use a vector especially designed for protein expression. The iGEM vectors are all high copy plasmids, which can lead to an overload of protein in your E. coli cells. This can result in toxic effects or inclusion bodies.
- Transformation: you may want to chose a E. coli strain especially designed for protein expression. It is helpful for a successfull protein purification to use a protease deficient strain such as BL21.
Cell culture and Lysis
- Grow cells overnight after transformation in 2ml medium.
- Inoculate 250mL LB in a 1l flask
- Optional: induce with IPTG (500 µL)
- centrifuging cells in 50ml falcon tubes
- resuspend pellets in 7,5µl ice cold PBS
- sonificatie cells (4x 1 min with pause, maximal power, 1 pulse per second)
- Add 1,5X Protease inhibitor and 25µl of 10mM Lysozyme and let rotate at room temperature for 30min
- Centrifuge lysate for 10min at 500xg
- Preparation of glutathione sepharose beads. You may add 1X protease inhibitor to all used PBS.
- Gently shake the bottle of sepharose to resuspend the matrix.
- Use a pipet to remove sufficient slurry for use and transfer to an 15 ml falcon tube. (Dispense 1.33 ml of original sepharose slurry per ml of final volume required.)
- Sendiment the matrix by centrifugation at 500xg for 5 min. Carefully decant the supernatant.
- Wash the sepharose by adding 10 ml of cold 1xPBS per 1.33 ml of the original slurry of glutathione sepharose dispensed. Invert to mix. (Sepharose must be thoroughly washed with PBS to remove the 20% ethanol storage solution. Residual ethanol may interfere with subsequent procedures).
- Sediment the matrix by centrifugation at 500xg for 5 minutes. Decant the supernatant.
- For each 1.33 ml of the original slurry, add 1 ml of 1xPBS. This produces a 50% slurry. Mix well prior to the subsequent pipetting steps. (Sepharose 4B equilibrated with PBS may be stored at 4°C for up to a month.
Purification of fusion proteins
- Transfer supernatant from step 2)h) on top of slurry from step 4)f)
- Rotate falcon for 30 min
- Centrifuge at 500xg for 5min
- Collect supernatant in a separate 50ml falcon ( in case the protein does not attach well to the beads, this supernatant can be used for a second purification)
- Add 10ml of cold PBS with protease inhibitor to flask with the beads
- Rotate falcon for 10 min
- Repeat steps c) - f)
- Centrifuge at 500xg for 5min
- Collect supernatant in a separate 50ml falcon (in case the protein does not attach well to the beads, this supernatant can be used for a second purification)
- Eluate beads with 1ml elution buffer (50mM Tris pH 8, 10mM Glutathione) – transfer slurry into a 2ml eppi
- Centrifuge eppi at 13000rpm to make a stable pellet
- Transfer supernatant to a new eppi. Take care not to take up beads from the pellet.
- Optional: repeat j) – l) to wash the rest off the beads
Further reading
Sandra Harper, David W. Speicher (2008); „Expression and Purification of GST Fusion Proteins“; John Wiley and Sons, Inc.; DOI: 10.1002/0471140864.ps0606s52
Plastic binding domain
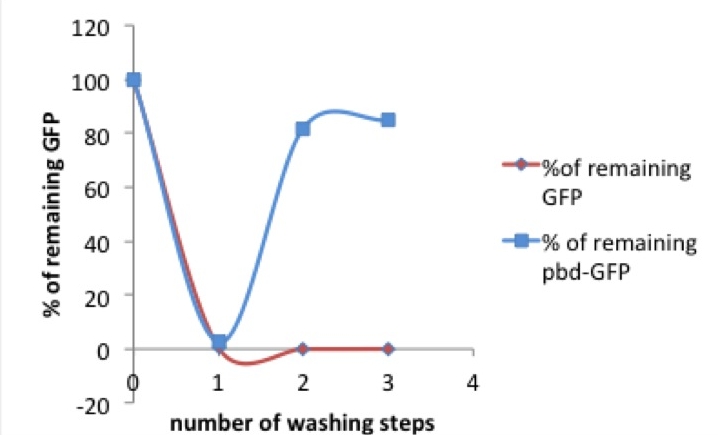
Taking a look at the pbd-bound GFP, it is striking that after the solution has already been diluted by one washing step, the percentage of protein that can be washed away diminishes. It comes to mind that the massive loss of pbd-tagged GFP after the first washing step might be due to an oversaturation of pbd-GFP in the solution. In this case there would be too much pbd-GFP for the available plastic surface, so that most of the protein could be eluated.
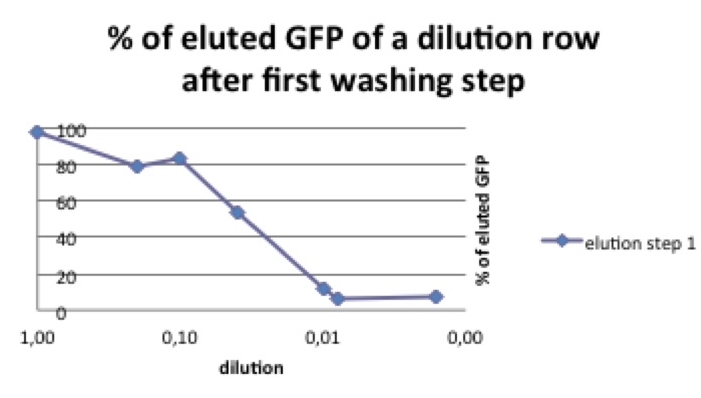
To investigate this phenomenon we compared different start concentrations of pbd-GFP concerning the amount of pbd-GFP that could be washed away.
polystyrene micro titer plates provide only a limited surface for the pbd to bind, the solution shouldn’t be oversaturated with plastic binding protein.
In a range of 1-30ng/µL start concentration there remains about seven times more pbd-GFP after washing than "normal" GFP (see picture 3).
Discussion
The plastic binding domain seems to work
Green light receptor
We could successfully amplify the gene sequences for CcaS and CcaR and the promotor region PcpcG via
PCR from the whole Synechocystis sp. PCC6803 genome.
Later two parts ([http://partsregistry.org/Part:BBa_K608101 BBa_K608101] , [http://partsregistry.org/Part:BBa_K608102 BBa_K608102]), were inserted into the iGEM-Vector pSB1C3 and send to the registry.
Twice we tried to clone the promotor region PcpcG into a vector, but had no insert at all.
After a summer full of cloning we ran out of time to assemble
the green light receptor cassette like we planned to.
For this reason we could not test the green light receptor and can not provide more information.
red light receptor
In August we decided to drop the red light receptor system.
The main reason beeing Jakob having to leave the team to start studying in Strasbourg.
So the FreiGEM team shrunk to five people.
Still we did submit one part for this system which is [http://partsregistry.org/Part:BBa_K608151 BBa_K608151] the translational unit of pcyA
We talked to some of the iGEM teams like TU Munich also working with this system
and we are sure that the red light receptor is not lost.
blue light receptor
The handling with the LOV domain and TrpR domain was very difficult.
On the one hand it was difficlut to digest the parts, because there was a SpeI restriction site in the tryptophan repressible promoter region. So we first had to mutate SpeI into NehI restriction site to digest our parts without digesting the promotor. In the beginning we also tried the Gibson assembly. Primer design was quite difficult because of the lenght, the usually very high annealing temperature and unspecifity of the primer sequences, combined to the mutations we had to include. These hassel leaded to trouble to amplify the Lov domain.The 3A-assembly with the mutated parts wasn´t successful either. We only cloned the Not-Gate in the pSB1C3 vector. We tried this experiment with different parameters but we weren´t successful.
Lysis cassette
After a lot of mishappenings concerning the 2 parts making up the temperature sensitive lysis cassette, we made a last attempt to ligate them (link to workbook) and transform the novel composite over the last weekend before the Wiki-freeze. After putative positive colonies were picked, we managed to perform a last-minute, "blind" -ie not knowing if the sequence of the insert was correct-, and preliminary OD-measurement testing.
We later verified the part sequence. Since we cannot upload .ab1 files, we made 2 base-call files from them without changing absolutely anything (that means that there are some false bases at the beginning and end of every file).
- Forward Primer
- Reverse Primer
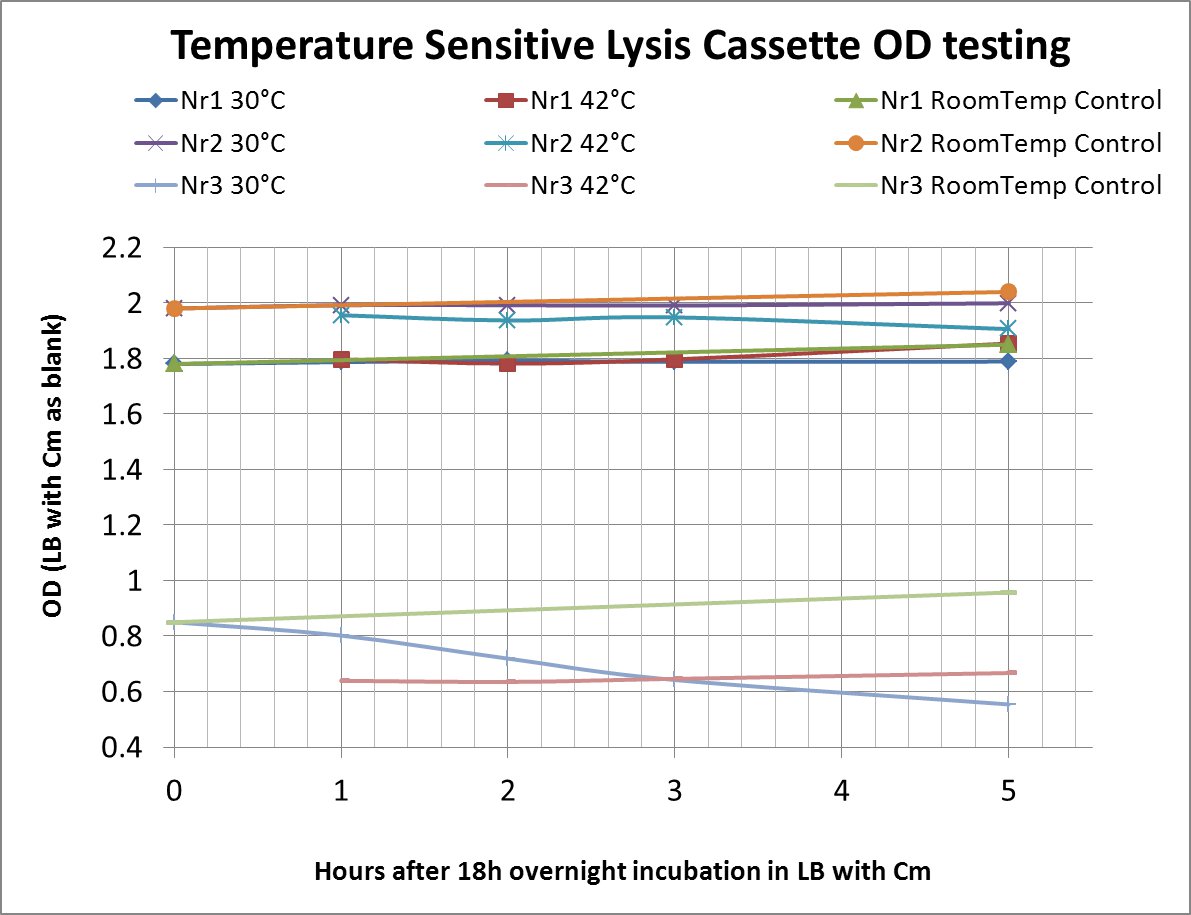
The OD values of the measurement are shown in the chart (please do bear in mind that this was a measurement done under deadline-stress, without the possibility to plan and perform something more concrete before the Wiki-Freeze)
- LB with Cm (Chloramphenicol) was used as a blank before every (hourly) measurement
|
Nr1: Insert is only part ([http://partsregistry.org/Part:BBa_K608351 BBa_K608351])
Nr2: Insert is only part ([http://partsregistry.org/Part:BBa_K608352 BBa_K608352])
Nr3: Both parts were correctly assembled (1:([http://partsregistry.org/Part:BBa_K608351 BBa_K608351]) + 2:([http://partsregistry.org/Part:BBa_K608352 BBa_K608352]))
Therefore the temperature sensitive lysis cassette seems to be pretty temperature-sensitive but also functioning properly. More tests are planned if time allows (ie wiki-unfreeze ;) )
Parts submitted to the registry
All our results are documented in our notebook and summarized in the partsregistry. Here we shortly describe what happened to give you an idea about the current status of the different subprojects. Please follow the links for more information.
Precipitator
[http://partsregistry.org/Part:BBa_K608404 BBa_K608404] IPTG-inducible Promoter with plastic binding domain-tagged GFP
[http://partsregistry.org/Part:BBa_K608406 BBa_K608406] Precipitator
The Precipitator is a new artificially designed LRR protein. It is meant as protein that binds Nickel ions with Histidines grouped on its surface. The bound Nickel can then precipitate His-tagged proteins. In our Lab in a Cell it should function as an adaptor between the plastic surface of pipettes and the His-tagged protein. Please look at our detailed description of the design layout in our modeling section. The sequence was synthesised and cloned into the iGEm vector. The submitted sequence was fully confirmed by sequencing.
[http://partsregistry.org/Part:BBa_K608407 BBa_K608407] Precipitator fused with GST tag
The Precipitator was fused with the C-terminus of our GST tag in order to extract and further test the construct for its Nickel binding affinity. We successfully cloned it together using the Gibson Assembly and then subsequently pasted it into the iGEM vector. The submitted sequence was partially confirmed by sequencing.
[http://partsregistry.org/Part:BBa_K608408 BBa_K608408] GST-tag
The GST-tag was PCR amplified from a pGEX vector with overhang primers including the iGEM restriction sites and then pasted into the iGEM vector. To verify the functionality of the construct we cloned it before a GFP sequence and expressed it with an IPTG inducible vector. Results see partsregistry page. The submitted sequence was partially confirmed by sequencing.
Green light receptor
[http://partsregistry.org/Part:BBa_K608101 BBa_K608101] CcaR, green light response regulator
The green light response regulator CcaR was amplified via PCR from
the whole Synechocystis sp. PCC 6803 genome and inserted into the pSB1C3 vector.
[http://partsregistry.org/Part:BBa_K608102 BBa_K608102]
CcaS , green light receptor
[http://partsregistry.org/Part:BBa_K608151 BBa_K608151] translational unit of pcyA
Lysis cassette
[http://partsregistry.org/Part:BBa_K608351 BBa_K608351] (correct) temperature sensitive promoter
[http://partsregistry.org/Part:BBa_K608352 BBa_K608352] Bacteriophage Lysis Cassette with RBS
commons
At the beginning we had to assemble promoters and ribosome binding sites of different "strengths" (ie consensus identities) in order to ensure proper and controlled expression of our parts.
The cloning procedure was time-consuming (circa two weeks), so we decided to
send our constructs to the registry. We hope to help other teams saving some time.
We called these constructs PR to abbreviate "Promoter and RBS"
[http://partsregistry.org/Part:BBa_K608002 BBa_K608002] strong Promoter and strong RBS (PR1)
[http://partsregistry.org/Part:BBa_K608003 BBa_K608003] strong Promoter , medium RBS (PR2)
[http://partsregistry.org/Part:BBa_K608004 BBa_K608004] strong Promoter , weak RBS (PR3)
[http://partsregistry.org/Part:BBa_K608005 BBa_K608005] medium Promoter , strong RBS (PR4)
[http://partsregistry.org/Part:BBa_K608006 BBa_K608006] medium Promoter , medium RBS (PR5)
[http://partsregistry.org/Part:BBa_K608007 BBa_K608007] medium Promoter , weak RBS (PR6)
Measurement of fluorescence intensity of PR-GFP and PR-RFP
To quantify the strength of our PR-constructs we cloned GFP and RFP behind it
and quantified the protein output.
The fluorescence was measured with a plate reader:
The fluorescence intensity and protein concentration were measured with the FLUOstar Omega,
which is a multi-mode microplate reader.
Samples were pipetted into the microplate and analyzed via the plate reader. In this experiment we focused on the protein concentration and the fluorescence intensity of RFP.
We measured the protein concentration with the bradford-assay. This is a method to determine the total protein concentration. To analyze the protein concentration of the samples, Coomassie Brillant Blue was pippeted to each sample. With the binding of the dye to the proteins the color changes from dark red to blue. The more protein in the solution the more Coomassie dye can bind to proteins and the more the color changes into blue. The absorption of bound Coomassie dye is 595nm. The absorbance is proportional with the amount of bound dye. With a series of Bovine Serum Albumin (BSA) measurements the exact protein concentration of the samples can be determined. BSA acts like a “marker” because the concentration of BSA is known and with a linear calibration line the exact protein concentration can be detected.
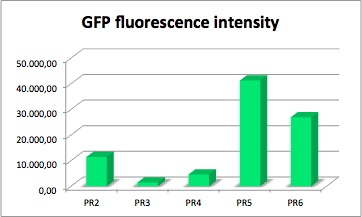
The values of the fluorescence intensity of RFP and GFP deviate from the expected values. We´ve expected PR1 to have the strongest GFP/RFP signal and PR6 with the lowest GFP/RFP signal. The data shows the differences. We could not repeat this measurement another time because of lack of time. We could not measure PR1-GFP because the sequencing was negative and there was no time for repeating. The measurement of PR3-RFP was an error and was excluded.
PR-GFP
GFP served as a reporter of expression. We wanted to know how strong the promoter and RBS activity is. With this reporter gene it was possible to analyze the expression via plate reader. GFP is excited at a wavelength of 509nm and has an emission of 520nm. The plate reader illuminates the samples with a high energy xenon flash lamp. Optical filters or monochromator create the exact wavelength. The more GFP in the sample the higher is the GFP fluorescence intensity. The intensity is collected with the second optical system and is detected with a side window photomultiplier tube.
parts:
[http://partsregistry.org/Part:BBa_K608008 BBa_K608008]
constitutive strong promoter with medium RBS and GFP (PR2-GFP)
[http://partsregistry.org/Part:BBa_K608009 BBa_K608009] Strong promoter with weak RBS and GFP (PR3-GFP)
[http://partsregistry.org/Part:BBa_K608010 BBa_K608010] Medium promoter with strong RBS and GFP (PR4-GFP)
[http://partsregistry.org/Part:BBa_K608011 BBa_K608011] Medium promoter with medium RBS and GFP (PR5-GFP)
[http://partsregistry.org/Part:BBa_K608012 BBa_K608012] Medium promoter with weak RBS and GFP (PR6-GFP)
PR-RFP
With RFP (Red Fluorescence Protein) the activity of promoter and RBS can be quantified. RFP served like GFP as a reporter to determine the expression level. RFP is excited at a wavelength of 580nm. The more RFP in the solution the more is the RFP fluorescence intensity.The plate reader illuminates the samples with a high energy xenon flash lamp. Optical filters or monochromator create the exact wavelength. The more RFP in the sample the higher is the RFP fluorescence intensity. The intensity is collected with the second optical system and is detected with a side window photomultiplier tube.
parts:
[http://partsregistry.org/Part:BBa_K608013 BBa_K608013] strong Promoter with strong RBS and RFP (PR1-RFP)
[http://partsregistry.org/Part:BBa_K608014 BBa_K608014 ] PR with RFP (PR2-RFP)
[http://partsregistry.org/Part:BBa_K608015 BBa_K608015] PR with RFP (PR3-RFP)
[http://partsregistry.org/Part:BBa_K608016 BBa_K608016] PR with RFP (PR4-RFP)
[http://partsregistry.org/Part:BBa_K608017 BBa_K608017] PR with RFP (PR5-RFP)
[http://partsregistry.org/Part:BBa_K608018 BBa_K608018] PR with RFP (PR6-RFP)
 "
"
 Contact


