 "
"
Team:Glasgow/BiofilmResults
From 2011.igem.org
| Line 1: | Line 1: | ||
{{Team:Glasgow/Header}} | {{Team:Glasgow/Header}} | ||
<html> | <html> | ||
| - | < | + | <p>Biofilm formation was also confirmed by SEM pictures that showed the extracellular matrix, such as Picture 1 below.</p> |
| - | < | + | <div> |
| - | </br><p> | + | <table align="centre"> |
| - | + | <tr> | |
| - | < | + | <td> |
| - | + | <img src="http://farm7.static.flickr.com/6177/6166139079_a35d6a5930_m.jpg" width="230" height="180" /><p><font size="1" color="grey">Picture 1: SEM image of Nissle biofilm </br>showing the extracellular matrix</font></p> | |
| + | </td> | ||
| + | <td> | ||
| + | <img src="http://farm7.static.flickr.com/6155/6169966778_9ee504c001_m.jpg"/> | ||
| + | <p><font size="1" color="grey"> Picture 2: 400x A gram-stained 16-hour </br><i>E.coli</i> Nissle biofilm </font></p> | ||
| + | </td> | ||
| + | <td> | ||
| + | <img src="http://farm7.static.flickr.com/6161/6169966780_264a3b3147_m.jpg"/> | ||
| + | <p><font size="1" color="grey"> Picture 3: 100x A gram stained 16-hour </br><i>E.coli</i> Nissle biofilm</font></p> | ||
| + | </td> | ||
| + | </table> | ||
| + | </div> | ||
</br> | </br> | ||
| + | <p>The images below may show why <i>E.coli</i> Nissle has the biofilm forming that <i>E.coli</i> lab strains lack. In Picture 4 the fimbriae of Nissle are clearly visible. Since the <i>E.coli</i> lab strain in Picture 5 does not have them, they may be the reason <i>E.coli</i> Nissle 1917 are so adept at clinging to each other.</p> | ||
| + | <div> | ||
<table> | <table> | ||
<tr> | <tr> | ||
<td> | <td> | ||
| - | < | + | <img src="http://farm7.static.flickr.com/6156/6166741226_e4cfd217bd_m.jpg" /><p><font size="1" color="grey">Picture 4: 10,000x SEM image of Nissle </br>showing the fimbriae</font></p> |
| - | + | ||
| - | <p> | + | |
| - | </ | + | |
</td> | </td> | ||
<td> | <td> | ||
| - | + | <img src="http://farm7.static.flickr.com/6171/6170367511_51e5363dbd_m.jpg" width="230" height="170"/> | |
| - | <img src=" | + | <p><font size="1" color="grey"> Image 2: 15,000x EM of E.coli for comparison. </br>No fimbriae or EPS is visible. (courtesy of Rocky Mountain Laboratories)</font></p> |
| - | < | + | |
| - | < | + | |
| - | + | ||
| - | + | ||
| - | + | ||
| - | </ | + | |
| - | </ | + | |
</td> | </td> | ||
| - | |||
</table> | </table> | ||
| - | + | </div> | |
| - | + | ||
| - | + | ||
| - | + | ||
| - | + | ||
| - | + | ||
| - | + | ||
| - | + | ||
</html> | </html> | ||
Revision as of 00:38, 22 September 2011


Biofilm formation was also confirmed by SEM pictures that showed the extracellular matrix, such as Picture 1 below.
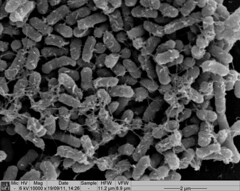 Picture 1: SEM image of Nissle biofilm showing the extracellular matrix |
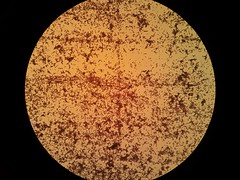
Picture 2: 400x A gram-stained 16-hour E.coli Nissle biofilm |
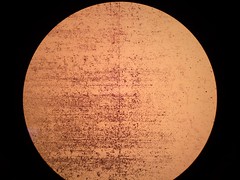
Picture 3: 100x A gram stained 16-hour E.coli Nissle biofilm |
The images below may show why E.coli Nissle has the biofilm forming that E.coli lab strains lack. In Picture 4 the fimbriae of Nissle are clearly visible. Since the E.coli lab strain in Picture 5 does not have them, they may be the reason E.coli Nissle 1917 are so adept at clinging to each other.
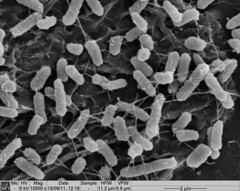 Picture 4: 10,000x SEM image of Nissle showing the fimbriae |
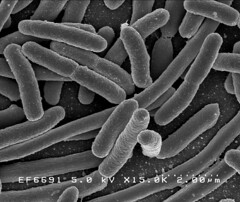
Image 2: 15,000x EM of E.coli for comparison. No fimbriae or EPS is visible. (courtesy of Rocky Mountain Laboratories) |