Team:NTNU Trondheim/Stress Sensor
From 2011.igem.org
(→Stress Sensor (rrnB+LacI+pLac+mCherry)) |
(→Flow Cytometry) |
||
| Line 70: | Line 70: | ||
[[File:M9.png|380x340px]] | [[File:M9.png|380x340px]] | ||
| + | |||
| + | |||
{{:Team:NTNU_Trondheim/NTNU_footer}} | {{:Team:NTNU_Trondheim/NTNU_footer}} | ||
Revision as of 18:15, 20 September 2011

Stress Sensor (rrnB+LacI+pLac+mCherry)
The stress sensor is our main construct. It is made from the following biobricks:
| Biobrick | Part number |
|---|---|
| rrnB P1 | BBa_K639002 |
| LacI with RBS | BBa_J24679 |
| Terminator | BBa_B0015 |
| pLac | BBa_R0011 |
| mCherry with RBS and terminator | BBa_J06702 |
The promotor is a variant of BBa_K112118, that we have made ourselves using PCR, and the PCR product was directly used as insert and connected with the rest of the construct. The final construct was cut with BstBI to verify that the rrnB P1 had been insertet. The stress sensor has a total length of 2653 bp. It was originally constructed and tested in the pSB1A2 plasmid but transfered to the pSB1C3 plasmid prior to shipping to the registry We have put the stress sensor through several tests (see characterization)
Link to parts registry: [http://partsregistry.org/Part:BBa_K639003 BBa_K639003]
Stress sensor characterization
To test our stress sensor, pre-cultures of the construct with, and without the rrnB P1 promoter were grown ON, pelleted and resuspended in M9 medium. The cultures were inoculated 1% in LB, LB+IPTG, M9 and M9+IPTG. IPTG will induce pLac, by inhibiting lacI's inhibition. M9 is a minimal medium, lacking amino-acids. M9 was used because ppGpp is mainly produced in the stringent response during amino-acid starvation.
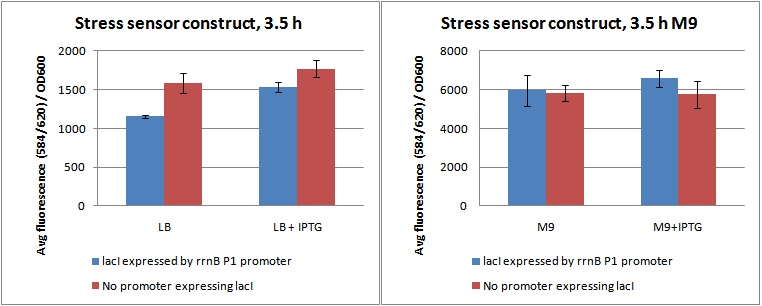
Cultures were grown in flasks in a shaking incubator at 37C for 3,5 hours, and 3 parallels of 100 µL from each flask were sampled to a 96 well fluorometer plate. Fluorescence was measured at ex: 584 em: 620, as well as OD600. Data from the experiment is shown in figure 1, as fluorescence divided by OD600.
Figure 1. Shows Fluorescence at ex: 584 em: 620 diveded by OD600 for cultures grown 3,5 hour in LB and M9 with and without IPTG.
As shown in figure 1, the cells do produce a substantial amount of mCherry even when they are not stressed (LB, and LB+IPTG). This is possibly due to the rrnB P1 promoter not being strong enough to produce sufficient amounts of lacI to inhibit pLac's expression of mCherry.
Looking at the difference between samples with (+P) and without promoter (-P) in LB and LB+IPTG, it is clear that the rrnB P1 promoter does produce lacI. The fluorescence/OD value of +P in LB is lower than -P in LB, indicating production of lacI. When it is induced by IPTG, inhibiting lacI, the level rises to approximately the same as -P, indicating a nullifying effect of the lacI produced.
The fluorescence / OD of the M9 samples is much higher than the LB. This was due to the slow growth rate in M9. The OD600 was unchanged from the inital OD in all M9 parallels after 3,5 hours (data not shown). What is interesting here, is that the difference between +P and -P seems to be gone. This indicates that the rrnB P1 promoter does indeed produce less lacI when the cells are grown in M9, possibly due to amino-acid starvation and ppGpp shutting it down. As the data was quite variable, this is hard to say for sure.
In future work with this construct, one could try to increase rrnB P1's strength by maybe tweaking the UTR, or try to lower pLac's strength, to give less leakage. A combination of both strategies would probably give the best result.
Flow Cytometry
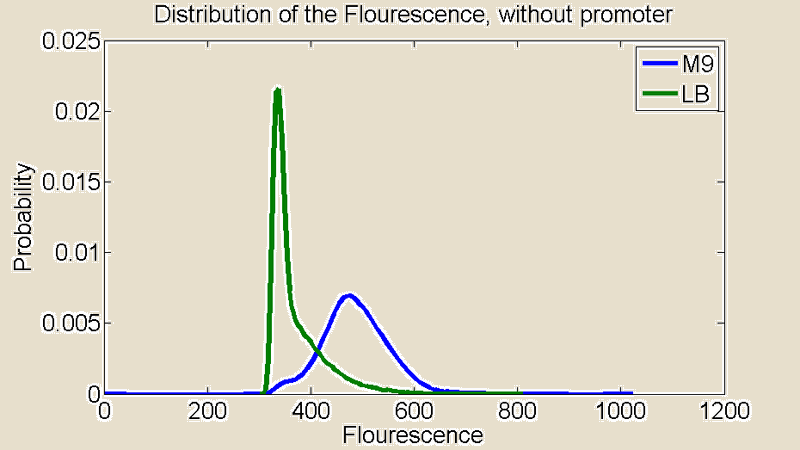
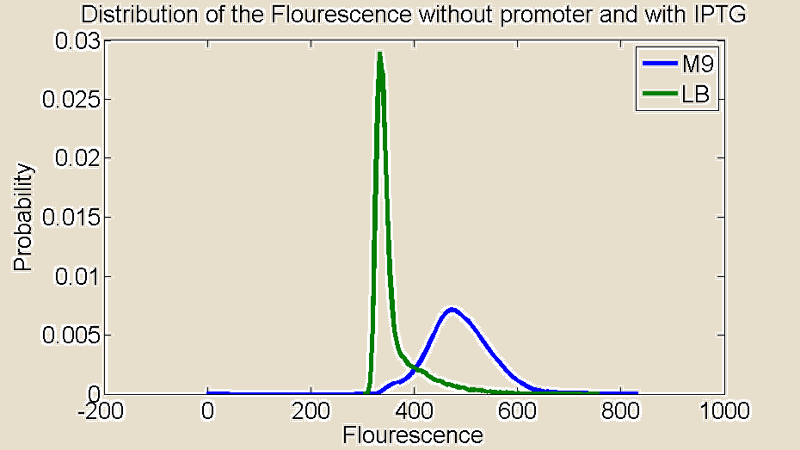
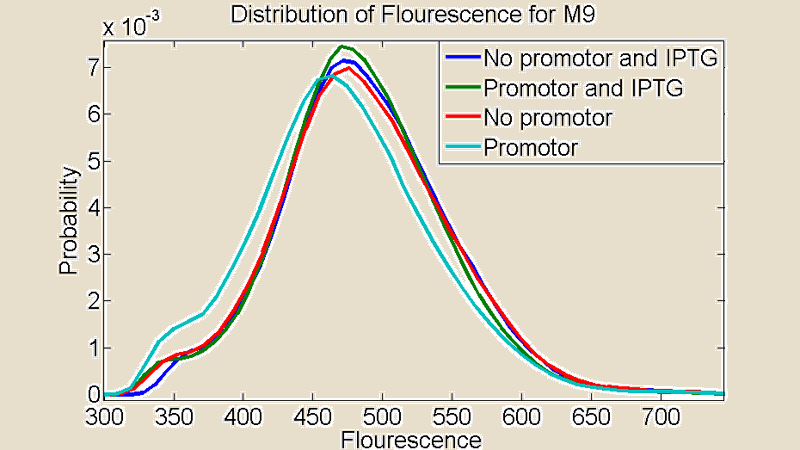
Several measurements were performed using a Flow Cytometer, this allowed us to measure the flouresence from single cells. The resulting plots shows the distributions of the flouresence for the red end of the spectrum (i.e around the wavelength corresponding to mCherry).
First of all there is a remarkable difference between the distributions for M9 and LB. The distribution for LB is relatively sharp compared to M9 which means there is little difference in the level of light emitted from the individual cells. The distribution for M9 is much broader showing a greater variance and it is also shifted to the right. A distribution shifted to the right means stronger emission of red light.
 "
"


