Team:Caltech/Week 9

From 2011.igem.org

(Difference between revisions)
 
(5 intermediate revisions not shown)
Line 120: Line 120:
</table>
</table>
==August 12==
==August 12==
-
Continue time-dependent biofilm optimization experiment with crystal violet stain.
+
Continue time-dependent biofilm optimization experiment with crystal violet stain.<br/>
 +
PCR of 16s.
===Results===
===Results===
Biobrick transformation plates
Line 141: Line 142:
</tr>
</tr>
</table>
</table>
 +
[[File:8-1216sphusion.jpg|thumb|16s amplification, lane 1 NEB 2-log ladder, lane 2 9-3A, lane 3 9-3B, lane 4 9-3C, lane 5 9-9A, lane 6 9-9B, lane 7 9-9C, lane 8 10-3A, lane 9 10-3B, lane 10 10-3C, lane 11 10-6A, lane 12 10-6B, lane 13 10-6C, lane 14 Control 1, lane 15 Control 2]]
==August 13==
==August 13==
===Results===
===Results===
Line 226: Line 228:
<td>.881</td>
<td>.881</td>
</tr>
</tr>
-
</table>
+
</table><br/>
 +
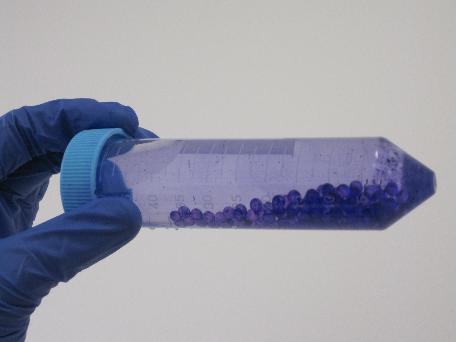
<gallery>
 +
File:Biofilm_graphs.jpg|Biofilm experiment chart
 +
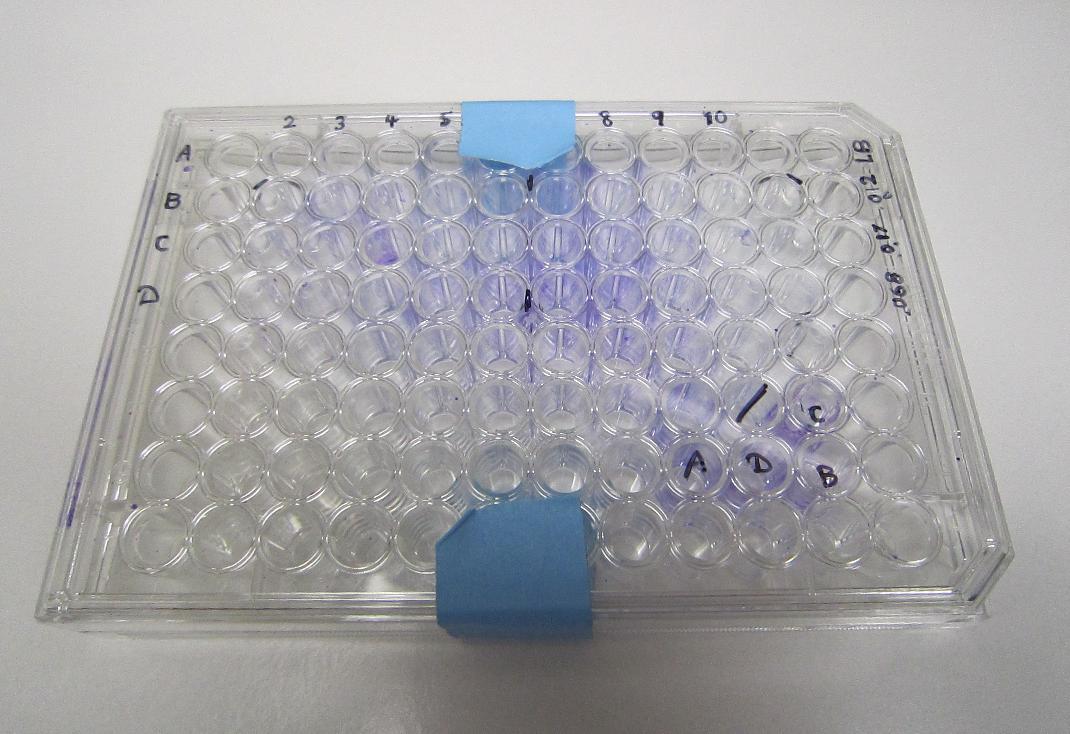
File:96-well.jpg|Biofilm experiment 96-well plate
 +
File:Cuvettes.jpg|Biofilm experiment cuvettes
 +
</gallery>
}}
}}

Latest revision as of 18:50, 8 September 2011


Caltech iGEM 2011


Home

Project

Data

Parts

Team

Notebook

Biosafety

Human Impact

References

Support

August 8

Testing for biofilms grown on 96-well plate and Erlenmeyer flasks with crystal violet
PCR of 16s
Transformation of I732019, I732005, J23119 from source plate in XL-10 gold.
Re-assembly of DDT gene using alternate method
GCMS of p450-degraded BPA samples Obtain experimental strain (biofilm-forming) MG-1655 E. coli and grow overnight in SOC

Results

Bacteria-incubated well remained cystal violet stained after several rinses, indicating the presence of a biofilm, in contrast to the clear control well.

Got successful amplification of 16s in LA River sample 9-9. In both gels, the controls had no bands and all other sample lanes had no bands.
BPA sample was too diluted for GCMS; must concentrate first.
DDT assembly failed.

August 9

Evaporate-centrifuge BPA sample to concentrate for GCMS
Create glycerol stocks of experimental E. coli strain MG-1655 for biofilm experiments
Did 16s sequencing experiments with a Master Mix.
Gibson assembly of pNT004 with PCRd insert
CPCR of more pNT002 colonies with VF2 and VR primers.
Retransform I732005 and I732019 with top ten cells. Plated on kan plates and amp plates since plasmid has resistance to both.
Re-assembly of DDT gene using PIPE cloning and Gibson.

Results

I732019 and I732005 plates had no colonies.
Sequencing shows pNT003 and pNT002 colonies were self-ligated. But then what was the band on the cpcr gel?
DDT assembly failed.
16s gel had primer lengths, gene did not amplify.

August 10

Minimal media transfers
Started enrichment cultures of water samples from Baxter and BBB ponds.
Redid Gibson of pNT002, pNT003, pNT004 with pcrd inserts
Transformed cells with I732017 and K323089 for some source of lacZ
Re-assembly of DDT gene using PIPE cloning and Gibson, transformed into different cells. Begin time-dependent biofilm optimization experiment with crystal violet stain.

Results

I732019 and I732005 plates had no colonies
pNT004 Gibson plates had no colonies
CPCR of pNT002 colonies had no insert bands
DDT assembly transformations showed colonies

August 11

Colony PCR of DDT gene colonies
Transformation of I732005, I732017, I732019 in new XL-10 cells
PCR of pSB4A5, pSB3K3, pNT002 insert, pNT003 insert. Tried PCA to assemble inserts more specifically.
Continue time-dependent biofilm optimization experiment with crystal violet stain.

Results

CPCR of DDT gene
Plate number of colonies
pNT002 + top ten 3
pNT002 - top ten 1
pNT003+ top ten 1
pNT003 - top ten 0
pNT004 + top ten 1
pNT004 - top ten 1
I372017 0
K323089 0
Name concentration (ng/ul)
pSB4A5 57.1
pSB3k3 1 60.4
pSB3k3 2 31.1
pNT002 insert 136.9
pNT003 insert 72.0
pNT002 insert PCA 15.7

August 12

Continue time-dependent biofilm optimization experiment with crystal violet stain.
PCR of 16s.

Results

Biobrick transformation plates

Plate Colonies
I732005 0
I732017 ~200
I732019 65
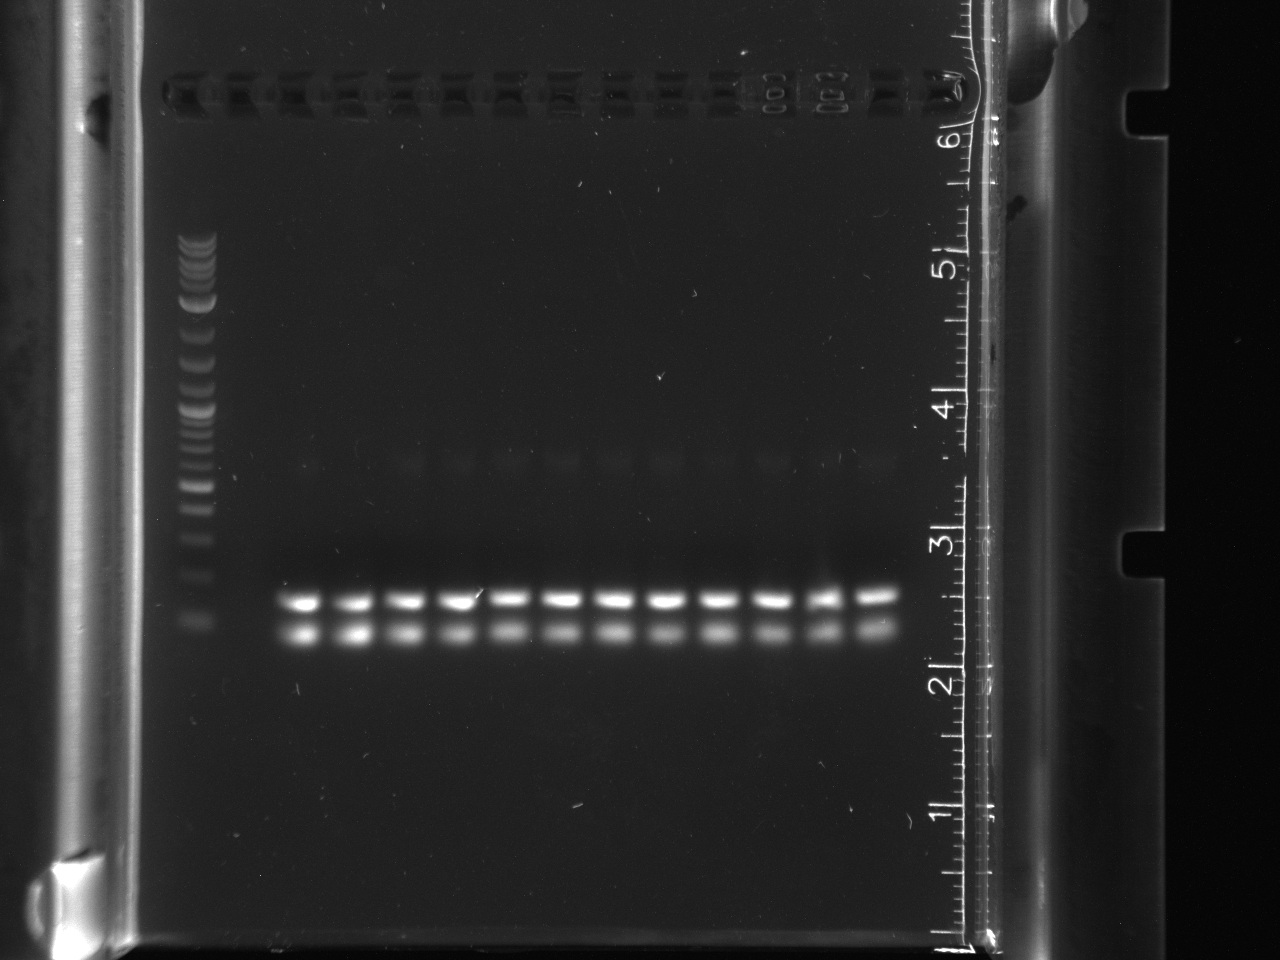
16s amplification, lane 1 NEB 2-log ladder, lane 2 9-3A, lane 3 9-3B, lane 4 9-3C, lane 5 9-9A, lane 6 9-9B, lane 7 9-9C, lane 8 10-3A, lane 9 10-3B, lane 10 10-3C, lane 11 10-6A, lane 12 10-6B, lane 13 10-6C, lane 14 Control 1, lane 15 Control 2

August 13

Results

Plate Colonies
pNT002 + ~320
pNT002 - ~800
pNT003+ ~500
pNT003- ~400

Crystal violet biofilm results:

Starting OD 8/10 8/11 8/12 8/13
5pm 11pm 11am 5pm 11pm 11am 5pm 11pm 11am 5pm
0.118 .065 .171 .114 .135 .266 .149 .133 .100 .408 .740
0.170 .065 .132 .082 .190 .159 .439 1.875 .106 .323 .545
0.068 .065 .106 .184 .198 .210 .121 .201 .145 .039 .881


Retrieved from "http://2011.igem.org/Team:Caltech/Week_9"