Team:WHU-China/Project/Modeling
From 2011.igem.org
| (4 intermediate revisions not shown) | |||
| Line 56: | Line 56: | ||
if (Sys.chrome||Sys.safari) | if (Sys.chrome||Sys.safari) | ||
{ | { | ||
| - | var a1= | + | var a1=2810; |
var a2=document.body.clientHeight; | var a2=document.body.clientHeight; | ||
document.getElementById("bottom").style.top=(a2+a1).toString()+'px'; | document.getElementById("bottom").style.top=(a2+a1).toString()+'px'; | ||
| Line 64: | Line 64: | ||
if(Sys.ie) | if(Sys.ie) | ||
{ | { | ||
| - | var a1= | + | var a1=2780; |
var a2=document.body.clientHeight; | var a2=document.body.clientHeight; | ||
document.getElementById("bottom").style.top=(a2+a1).toString()+'px'; | document.getElementById("bottom").style.top=(a2+a1).toString()+'px'; | ||
document.getElementById("contact").style.top=(a2+a1+80).toString()+'px'; | document.getElementById("contact").style.top=(a2+a1+80).toString()+'px'; | ||
}else{ | }else{ | ||
| - | var a1= | + | var a1=2780; |
var a2=document.body.clientHeight; | var a2=document.body.clientHeight; | ||
document.getElementById("bottom").style.top=(a2+a1).toString()+'px'; | document.getElementById("bottom").style.top=(a2+a1).toString()+'px'; | ||
| Line 80: | Line 80: | ||
<div id="content1"> | <div id="content1"> | ||
<div class="wide" id="wide1"> | <div class="wide" id="wide1"> | ||
| - | <div style="font-size:30px;font- | + | <div style="font-size:30px;font-family: 'Bodoni MT', Helvetica, sans-serif;" >Gene Circuit </div> |
<img src="/wiki/images/c/cd/Oscillator5.png" width="80%" style="margin-left:10%"/> | <img src="/wiki/images/c/cd/Oscillator5.png" width="80%" style="margin-left:10%"/> | ||
<p> | <p> | ||
| Line 91: | Line 91: | ||
<div class="wide" id="wide2"> | <div class="wide" id="wide2"> | ||
<p></br></p> | <p></br></p> | ||
| - | <div style="font-size:30px;font- | + | <div style="font-size:30px;font-family: 'Bodoni MT', Helvetica, sans-serif;">Modeling</div> |
<p> | <p> | ||
In the part of waving time, there is a two nodes system .Using the method of the mathematic theory of the ODE and the stochastic process.,we get our models.In the models, X1 denotes LsrK, X2 denotes LsrR.</br> | In the part of waving time, there is a two nodes system .Using the method of the mathematic theory of the ODE and the stochastic process.,we get our models.In the models, X1 denotes LsrK, X2 denotes LsrR.</br> | ||
| Line 120: | Line 120: | ||
<div class="wide" id="wide3"> | <div class="wide" id="wide3"> | ||
<p></br></p> | <p></br></p> | ||
| - | <div style="font-size:30px;font- | + | <div style="font-size:30px;font-family: 'Bodoni MT', Helvetica, sans-serif;">Conclusion</div> |
<p> | <p> | ||
As the changes of period with the change of the parameters in the image , we can get the conclusion that: </br> | As the changes of period with the change of the parameters in the image , we can get the conclusion that: </br> | ||
Latest revision as of 03:33, 29 October 2011
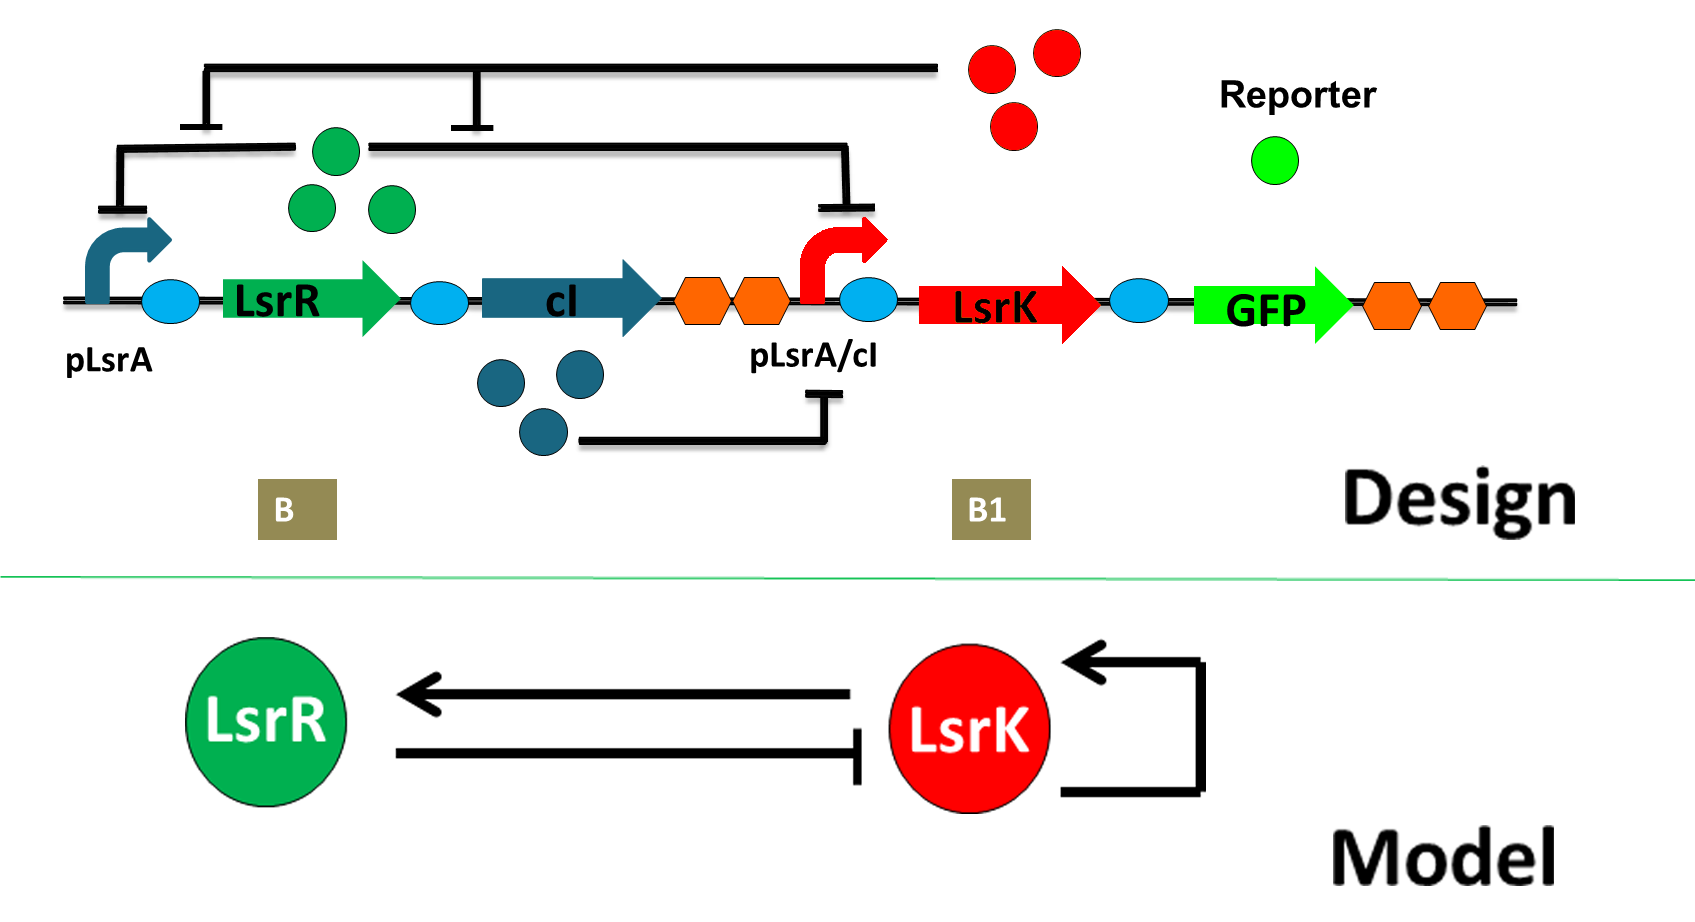
This is our gene circuit designed to equip our E.coli with the ability to change color with time. The key players are LsrR and LsrK. The alternation of their expression results in the oscillating concentration of the reporter—GFP, and thus yield the periodically changing color. Theoretically, at the very beginning, LsrR is expressed and inhibits LsrK. After some time, LsrR inhibits itself and its concentration drops. Therefore LsrK has a chance to express and climbs due to its self enlarging. However, LsrK induces the reexpression of LsrR at the same time. In this way, their concentrations wave alternatively. C1’s function is to delay the oscillation and stabilize the system.
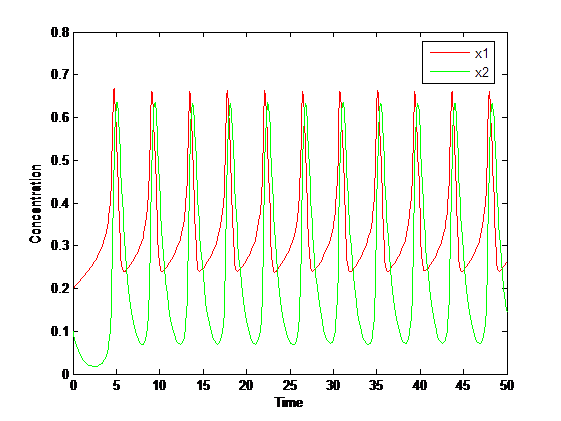
In the part of waving time, there is a two nodes system .Using the method of the mathematic theory of the ODE and the stochastic process.,we get our models.In the models, X1 denotes LsrK, X2 denotes LsrR. First we generate a ODE to describe the system:

the solution diagram of the function is:
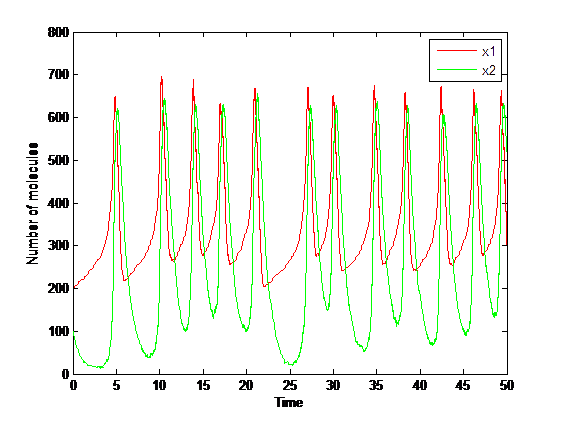
Taking the fluctuations arising from the molecules into account, we need to resort to stochastic simulations. We use here the Gillespie algorithm to simulate a stochastic version of the model.Suppose the system size Ω=1000,then we can get the result of simulation.
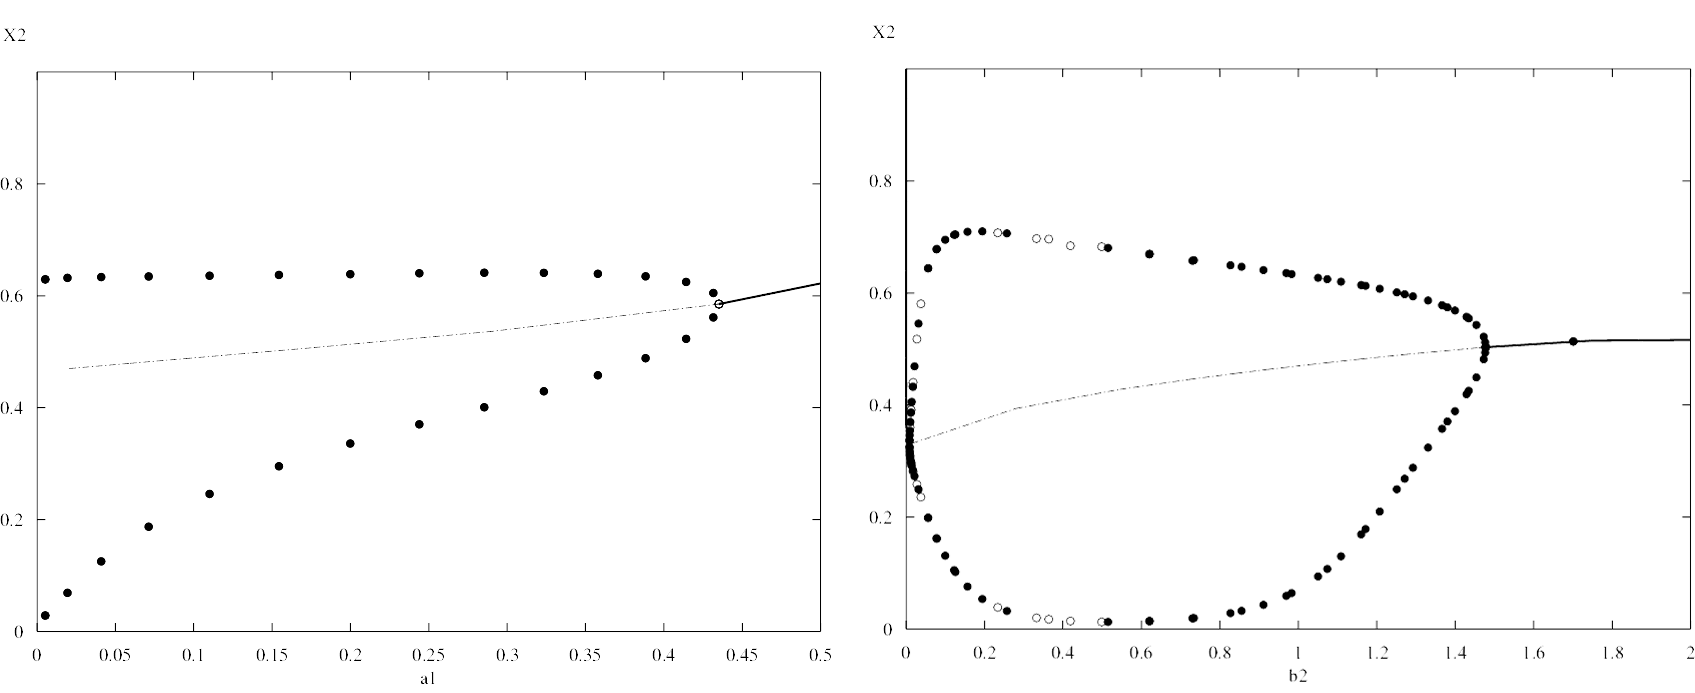
Bifurcation diagram:
Period evolution with parameters:
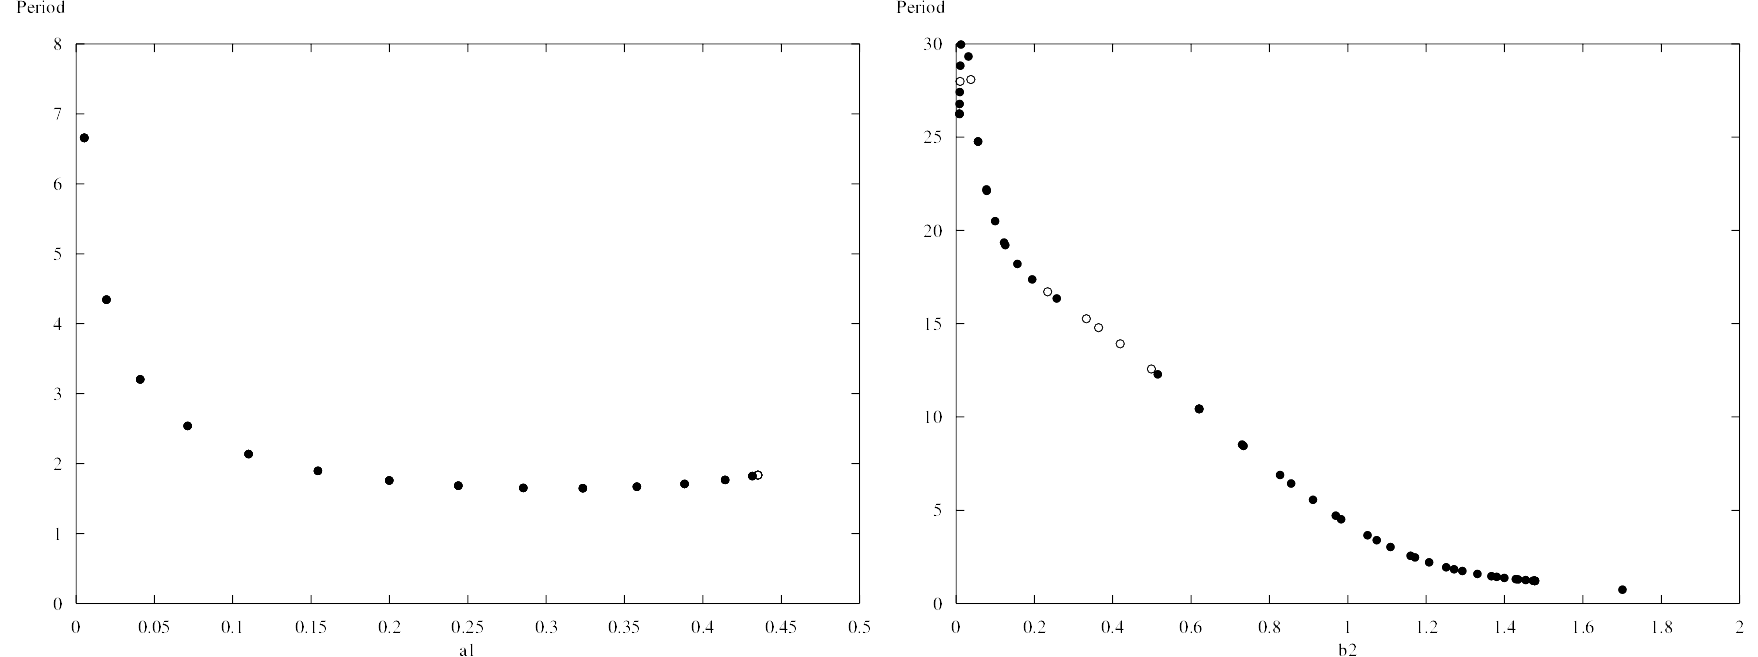
Due to the conclusion we can find that the b1 is more sensitive to the period. If we want to change the period of the system , it more efficient to adjust the parameter of b2 and then adjust the biological properties.
As the changes of period with the change of the parameters in the image , we can get the conclusion that: 1. a1,a2,a3,b1 has a little influence on period. 2. b2 has inversely proportional relationship with period , it has a huge influence on the period. This conclusion we get before can be used to guide the design of biological systems. In order to achieve the adjustment of period, we can adjust the size of some parameters. Both the deterministic and stochastic models confirm our conjecture that the oscillator can work stably.
 "
"


