Team:ETH Zurich/Modeling/Analytical Approximation
From 2011.igem.org
(→Analytical Solution) |
(→Analytical Approximation) |
||
| (14 intermediate revisions not shown) | |||
| Line 3: | Line 3: | ||
{{:Team:ETH Zurich/Templates/SectionStart}} | {{:Team:ETH Zurich/Templates/SectionStart}} | ||
= Analytical Approximation = | = Analytical Approximation = | ||
| - | { | + | '''In our latest modeling approach, we added an analytical gradient approximation and analytically analyzed the robustness of the GFP band. Additionally, the nondimensionalized model gives information about which parameters can be adjusted in pairs to achieve the same steady state for the GFP band.''' |
| + | <br clear="all" /> | ||
| + | {|valign="top" width="100%" | ||
| + | | | ||
| + | [[File:ETHZ-Numerical-VS-Analytical-Middle.png|420px|center|thumb|Red: analytical approximation (line: acetaldehyde, dotted: GFP), black: exact numerical solution (line: acetaldehyde, dotted: GFP)]] | ||
| + | | | ||
| + | [[File:ETHZ-Analytical.png|420px|thumb|center|Analytical Analysis of GFP Band Existence]] | ||
| + | |} | ||
| + | {{:Team:ETH Zurich/Templates/SectionEnd}} | ||
{{:Team:ETH Zurich/Templates/SectionStart}} | {{:Team:ETH Zurich/Templates/SectionStart}} | ||
| Line 73: | Line 81: | ||
[[File:ETHZ-KPP-zDeadZone.png|299px|center]] | [[File:ETHZ-KPP-zDeadZone.png|299px|center]] | ||
| - | <html><h3></html>Comparison<html></h3></html> | + | <html><h3></html>Comparison with Numerical Solution<html></h3></html> |
| + | We also compare the approximate analytical solution with the exact numerical solution at the beginning, middle and end of the detection range of our system: | ||
| + | * '''Beginning of detection range:''' | ||
| + | [[File:ETHZ-Numerical-VS-Analytical-Beginning.png|600px|center|thumb|Red: analytical approximation (line: acetaldehyde, dotted: GFP), black: exact numerical solution (line: acetaldehyde, dotted: GFP)]] | ||
| + | * '''Middle of detection range:''' | ||
| + | [[File:ETHZ-Numerical-VS-Analytical-Middle.png|600px|center|thumb|Red: analytical approximation (line: acetaldehyde, dotted: GFP), black: exact numerical solution (line: acetaldehyde, dotted: GFP)]] | ||
| + | * '''End of detection range:''' | ||
| + | [[File:ETHZ-Numerical-VS-Analytical-End.png|600px|center|thumb|Red: analytical approximation (line: acetaldehyde, dotted: GFP), black: exact numerical solution (line: acetaldehyde, dotted: GFP)]] | ||
| + | ''' We can indeed conclude that the analytical approximation is in good agreement with the exact numerical solution. ''' | ||
{{:Team:ETH Zurich/Templates/SectionEnd}} | {{:Team:ETH Zurich/Templates/SectionEnd}} | ||
| Line 147: | Line 163: | ||
We can now derive a condition that has to be fulfilled in order for the GFP band to exist. Its meaning condenses down to the intuitive fact that the rising flank of the band has to occur "to the left" of the falling one. Mathematically, the condition can be derived from the following expression: | We can now derive a condition that has to be fulfilled in order for the GFP band to exist. Its meaning condenses down to the intuitive fact that the rising flank of the band has to occur "to the left" of the falling one. Mathematically, the condition can be derived from the following expression: | ||
| - | [[File:ETHZ-Analytical-GFP-Existence.png| | + | [[File:ETHZ-Analytical-GFP-Existence.png|655px|center]] |
'''This condition simplifies to''' | '''This condition simplifies to''' | ||
Latest revision as of 02:47, 29 October 2011

Contents |
Analytical Approximation
In our latest modeling approach, we added an analytical gradient approximation and analytically analyzed the robustness of the GFP band. Additionally, the nondimensionalized model gives information about which parameters can be adjusted in pairs to achieve the same steady state for the GFP band.
Steady State Gradient Approximation
We derived the gradient formation dynamics analytically already in the reaction-diffusion model. However, there we only solved the resulting partial differential equation numerically. Here, we are going to venture forth and give a suitable analytical approximation!
Kolmogorov-Petrovsky-Piskounov Equation
In mathematics, the problem posed by general reaction-diffusion systems form is known as the Kolmogorov-Petrovsky-Piskounov Equation. In the case of acetaldehyde as diffusing and reacting molecule, the equation has the following general structure:

Boundary Conditions
For the analytical approximation of the acetaldehyde gradient, we only consider the boundary condition that the concentration at the reservoir (located at z = 0) stays constant:This is in contrast to the full model, where we enforce that no diffusion occurs through the opening at the side of the channel which is closed and not connected to the reservoir. However, we will see that for our circuit, this assumption is valid as long as we are inside the detection range of our circuit, which is the case that we are interested in. In the end, we can also detect if we go out of detection range in the analytical model and make sure this assumption holds.
Solution at Steady State
At steady state, we have to solve the KPP equation for the time derivative set to zero, i.e.
1. Simplification
Before we get started with solving the actual equation, we simplify it by gathering all the parameters we can:
2. Approximation
Next, we assume that the Michaelis-Menten-type degradation in our KPP operates at or almost at saturation for the relevant part of the gradient. This assumption holds for inputs that are within detection range according to the exact numerical integration of the KPP equation.
This means we can approximate the reaction term around saturation, i.e. AcAl*(z) >> KM,AcAl:
We have now arrived at a solvable ordinary differential equation for the acetaldehyde gradient:
3. Partial Analytical Solution
We can solve the ordinary differential equation we derived before by integrating wrt. to z twice, thereby introducing an unknown integration constant κ:
In the approximate solution to the problem, negative concentrations might be obtained due to the presence of the zeroth-order term in the KPP partial differential equation. To determine κ and avoid negative concentrations in the approximate solution, we apply the dead-zone concept.
Dead Zone Concept
The dead zone concept introduces a nonreaction zone. It is an approximation to the Kolmogorov-Petrovsky-Piskounov equation for saturation of Michaelis-Menten kinetics that tends to work better than the orginial boundary conditions [1]. In our case, for the nonreaction zone, we require that
The solution to the problem posed by the ODE steady-state approximation of the Kolmogorov-Petrovsky-Piskounov equation and the dead-zone concept gives a value for κ:
Analytical Solution
This completes the final equation describing the acetaldehyde gradient at steady state:
Finally, we also get an analytical expression for zDeadZone, at which both the acetaldehyde concentration and its gradient are zero:
Comparison with Numerical Solution
We also compare the approximate analytical solution with the exact numerical solution at the beginning, middle and end of the detection range of our system:- Beginning of detection range:
- Middle of detection range:
- End of detection range:
We can indeed conclude that the analytical approximation is in good agreement with the exact numerical solution.
GFP Band: Dimensionless Model
1. Nondimensionalized System
We nondimensionalized all species occurring in the equations for the GFP band circuit.
The dimensionless equations for the dynamics of the band-generating system then read
2. Steady State
3. Dimensionless Groupings
The equation system can be simplified by introducing the following dimensionless groupings:
This yields the final equations for steady state:
GFP Band: Approximation & Analysis
1. Splitting of Pathways
First, we split the band-pass system into both its long and short pathway:
- Short pathway:
- AcAl
- TetR
- LacIM1
- GFP
- Long pathway:
- AcAl
- TetR
- CI
- LacI
- GFP
Seperation of LacI Species
We separate the LacI species and their steady state equations in order to compute both pathways independently:2. From GFP to Acetaldehyde
To get from GFP to Acetaldehyde, we have to invert all relevant equations:
| Short pathway: | Long pathway: |
3. Half-Maximum GFP Activity
We first concentrate on the short pathway and determine for which acetaldehyde concentration it produces half-maximum GFP:
Next, we concentrate on the long pathway:
4. GFP Band Existence
We can now derive a condition that has to be fulfilled in order for the GFP band to exist. Its meaning condenses down to the intuitive fact that the rising flank of the band has to occur "to the left" of the falling one. Mathematically, the condition can be derived from the following expression:
This condition simplifies to
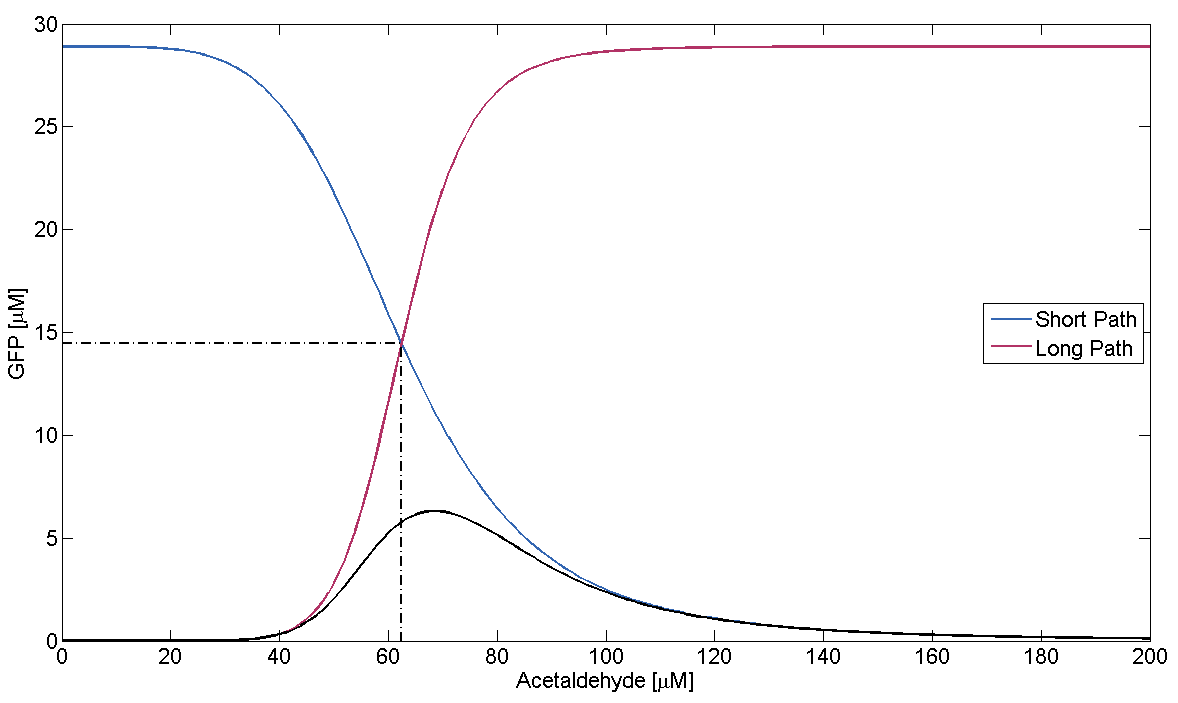
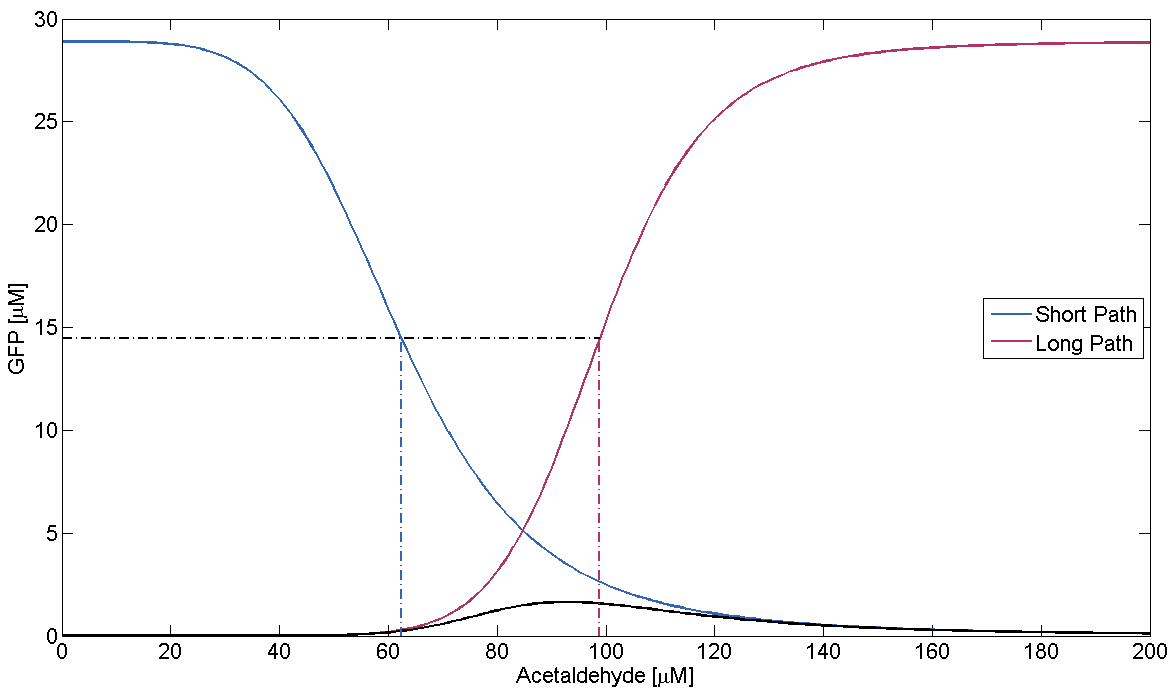
In Figure 1, this means that the dash-dotted red line must be at a lower acetaldehyde concentration than the blue dash-dotted red line. We now analyze what possible outcomes this condition has by varying μLacIM1:
- Condition holds:
This case is covered by our actual system implementation. In our system μLacIM1 is over 20 times smaller than the limit required by the condition. This substantiates our belief in the robustness of our system:
- Corner Case (Equality):
In this case, the area where both pathways are above half maximum expression condenses down to a single point. We define this as the threshold between no existence and existence of the GFP band.
- Condition failure:
On condition failure there should be no discernible band. We verify this by simulating the GFP response depending on Acetaldehyde with μLacIM1 10 times lower than the threshold we previously defined:
References
[1] [http://www.ncbi.nlm.nih.gov/pubmed/16209545 Valdés-Parada FJ, Alvarez-Ramírez J, Ochoa-Tapia JA.
An approximate solution for a transient two-phase stirred tank bioreactor with nonlinear kinetics.
Biotechnol Prog. 2005 Sep-Oct;21(5):1420-8.]
 "
"


