Team:Potsdam Bioware/Project/Details Modeling
From 2011.igem.org
UP Sebastian (Talk | contribs) (→Parameter estimation) |
(→Modeling) |
||
| (6 intermediate revisions not shown) | |||
| Line 6: | Line 6: | ||
== Modeling == | == Modeling == | ||
| - | There is no synthetic biology without modeling, of course. In principle there is structure modeling and | + | There is no synthetic biology without modeling, of course. In principle there is structure modeling and systems modeling. In structure modeling the conformation and structure of proteins is examined and steric consequences for reactions or the whole system can be estimated. We focused on the second sort of modeling: The systems modeling in which the reaction kinetics of the whole system is analyzed, outcomes are predicted and parameters correlated to measurements. Thus, a synthetic biology approach can be chosen because a better understanding of the system is achieved and further changes can be planed - just like in engineering. |
=== Model === | === Model === | ||
| Line 106: | Line 106: | ||
<br> | <br> | ||
| - | Here we display one example of how the change of a simulation constant impacts the growth of the cells and that our system is robust: The parameter | + | Here we display one example of how the change of a simulation constant impacts the growth of the cells and that our system is robust: The parameter K<sub>D</sub> (Dissociation of microviridin and protease divided by the association) is central to our model and the β-lactamase concentration in the periplasm an indicator for the cell survival. To see the dependence of β-lactamase on this constant, following plot (figure 8) was created: |
<br> | <br> | ||
| - | [[File: UP_3Dplot_Lact_06.png|center|600px|thumb|'''Figure 8:''' Starting at t3: β-lactamase concentration inside the periplasm. A significant change of the simulation factor | + | [[File: UP_3Dplot_Lact_06.png|center|600px|thumb|'''Figure 8:''' Starting at t3: β-lactamase concentration inside the periplasm. A significant change of the simulation factor K<sub>D</sub> (Dissociation of microviridin and protease divided by the association) can result in a lower β-lactamase concentration and thus less fitness of the cell (because the β-lactamase protects the cell from the antibiotic ampicillin).]] |
Figure 9 shows the relating cell doubling time that can be measured in the lab. | Figure 9 shows the relating cell doubling time that can be measured in the lab. | ||
<br> | <br> | ||
| - | [[File: UP_3Dplot_cells_06.png|center|600px|thumb|'''Figure 9:''' Starting at t3: Growth (double) rate of cells dependent on the ampicillin concentration in the periplasm. A significant change of the simulation factor | + | [[File: UP_3Dplot_cells_06.png|center|600px|thumb|'''Figure 9:''' Starting at t3: Growth (double) rate of cells dependent on the ampicillin concentration in the periplasm. A significant change of the simulation factor K<sub>D</sub> (Dissociation of microviridin and protease divided by the association) can result in less fitness of the cell and a reduction of its growth rate.]] |
The β-lactamase concentration in the periplasm can be very small. Thus for this concentration a semi-stochastig model was produced by handling this value as integer. Such graphs are less smooth (see figures 10 and 11) (parameters were insignificantly changed). | The β-lactamase concentration in the periplasm can be very small. Thus for this concentration a semi-stochastig model was produced by handling this value as integer. Such graphs are less smooth (see figures 10 and 11) (parameters were insignificantly changed). | ||
| Line 126: | Line 126: | ||
As mentioned before most model parameters could only be estimated by looking at the order of magnitude of substances in similar systems and lab experiences combined with unit transformation. To make our model more reliable we improved critical parts of our model by relating it to lab measurements of cell survival in different variations of our system (see section <i>in vivo</i> selection). Especially two experiments were used: The percentage of surviving cells on different ampicillin concentration mediums with induced β-lactamase expression and a system with induced β-lactamse and also induced protease expression. | As mentioned before most model parameters could only be estimated by looking at the order of magnitude of substances in similar systems and lab experiences combined with unit transformation. To make our model more reliable we improved critical parts of our model by relating it to lab measurements of cell survival in different variations of our system (see section <i>in vivo</i> selection). Especially two experiments were used: The percentage of surviving cells on different ampicillin concentration mediums with induced β-lactamase expression and a system with induced β-lactamse and also induced protease expression. | ||
| - | We implemented a routine for parameter estimation in MATLAB with the help of which the two parameter values could be specified (in direct relation to lab measurements) that we were least certain about before: alpha (the parameter in the formula (see above) connecting the ampicillin concentration in the periplasm and the percentage of surviving cells) and k(+2) (the parameter of association of the protease and the β-lactamase - here the aspect plays a role that the β-lactamase must first be folded before it can be transported into the periplasm, so in total the chance for association is higher due to the longer retention time). Alpha was specified to 0.3163 and k(+2) was specified to | + | We implemented a routine for parameter estimation in MATLAB with the help of which the two parameter values could be specified (in direct relation to lab measurements) that we were least certain about before: alpha (the parameter in the formula (see above) connecting the ampicillin concentration in the periplasm and the percentage of surviving cells) and k(+2) (the parameter of association of the protease and the β-lactamase - here the aspect plays a role that the β-lactamase must first be folded before it can be transported into the periplasm, so in total the chance for association is higher due to the longer retention time). Alpha was specified to 0.3163 and k(+2) was specified to 2.0253*(1.e-5). |
| - | As can be seen on following figures 12 and 13, the model | + | As can be seen on following figures 12 and 13, the model responses reliably to the measurements (see <i>in vivo</i> selection for more information). Thus predictions of the model concerning robustness (see results) and trigger times can be trusted. |
<br> | <br> | ||
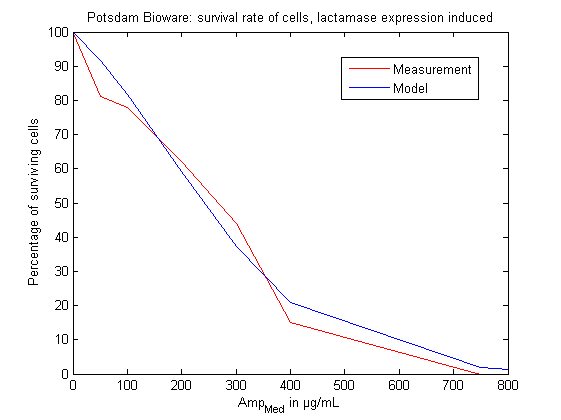
| + | [[File: UP_comparison_lactamase.png|center|500px|thumb|'''Figure 12:''' Comparison of model and measurement at t4 > 3h: Percentage of surviving cells dependent on the ampicillin concentration added to the medium. The lactamase expression is induced.]] | ||
| + | |||
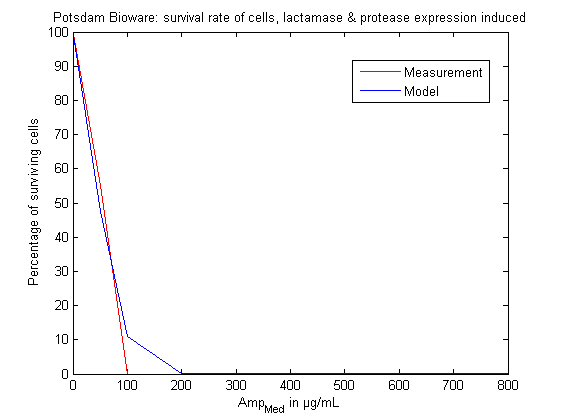
| + | [[File: UP_comparison_lactamase_and_protease.png|center|500px|thumb|'''Figure 13:''' Comparison of model and measurement at t4 > 3h: Percentage of surviving cells dependent on the ampicillin concentration added to the medium. Lactamase and protease expression is induced.]] | ||
=== MATLAB code === | === MATLAB code === | ||
| - | |||
[[Media:conzt1.m]]<br> | [[Media:conzt1.m]]<br> | ||
[[Media:conzt2.m]]<br> | [[Media:conzt2.m]]<br> | ||
[[Media:conzt3.m]]<br> | [[Media:conzt3.m]]<br> | ||
[[Media:UP_plottfuntionendreiaufeinmal2.m]]<br> | [[Media:UP_plottfuntionendreiaufeinmal2.m]]<br> | ||
| - | [[Media:UP_celldivision2.m]] | + | [[Media:UP_celldivision2.m]]<br> |
| + | [[Media:UP_lactamase2.m]]<br> | ||
| + | [[Media:UP_parameter_estimation_1.m]]<br> | ||
| + | [[Media:UP_parameter_estimation_2.m]]<br> | ||
Latest revision as of 03:36, 29 October 2011
Contents |
Modeling
There is no synthetic biology without modeling, of course. In principle there is structure modeling and systems modeling. In structure modeling the conformation and structure of proteins is examined and steric consequences for reactions or the whole system can be estimated. We focused on the second sort of modeling: The systems modeling in which the reaction kinetics of the whole system is analyzed, outcomes are predicted and parameters correlated to measurements. Thus, a synthetic biology approach can be chosen because a better understanding of the system is achieved and further changes can be planed - just like in engineering.
Model
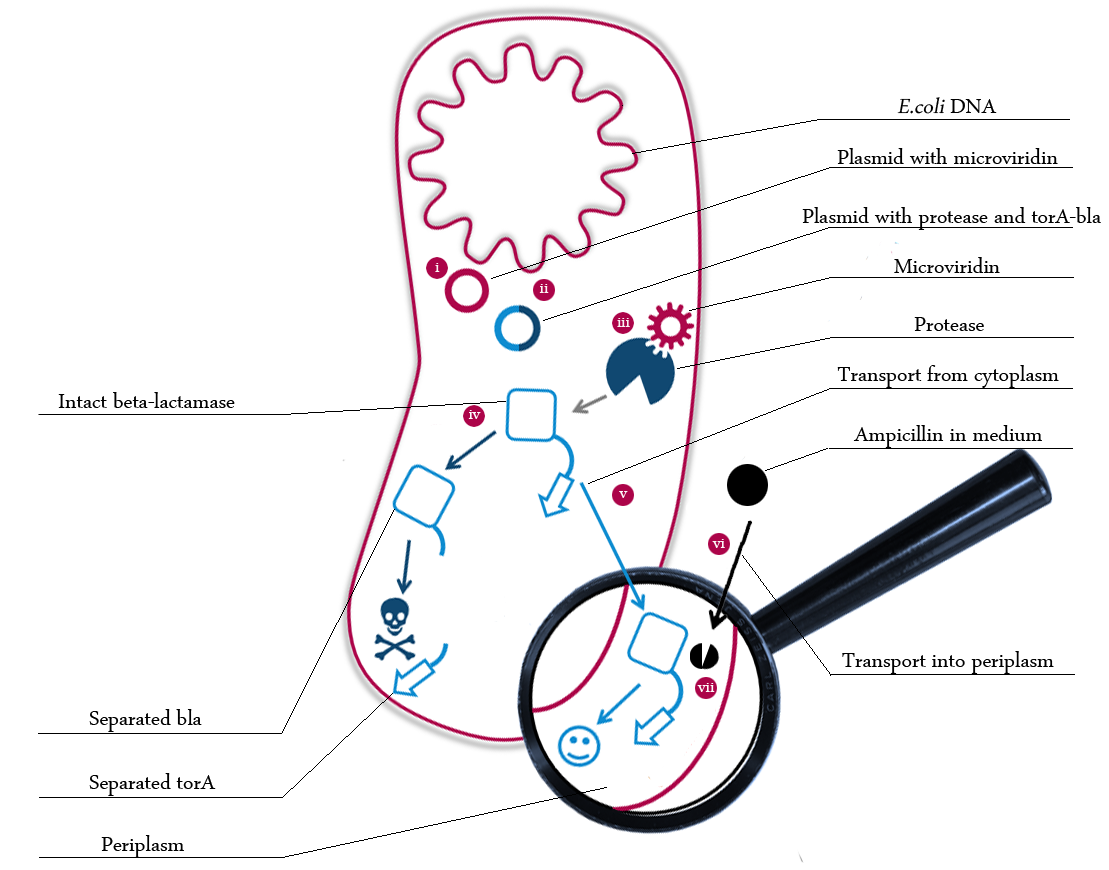
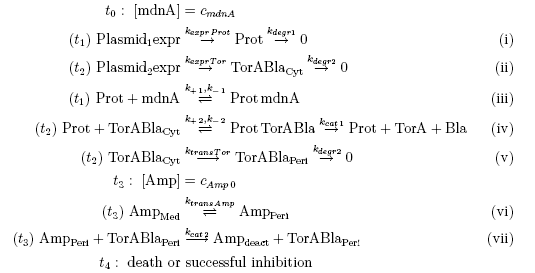
We built a model of our in vivo selection system to be able to engineer our system effectively. The following schema shows the major reactions taking place in our cell system. The Romanic numbers indicate the system relevant (partially triggered) reactions that were written down as equations and then numerically propagated through time.
The schema shows the triggered expression of mircoviridin (our inhibitor), the protease (that needs to be inhibited for medical reasons) and the β-lactamase (that protects the cell from an antibiotic). The protease cleaves at a specific recognition site in the linker peptide. This will abolish the β-lactamase export and in consequnece the cell will die.
There are three important trigger activation times:
- (t0) - start (microviridin added already)
- t1 - start expression of protease
- t2 - start expression of β-lactamase
- t3 - ampicillin added into medium
- (t4) - end of the experiment: cell cultures survive or die.
Keeping these times in mind, the reactions can be written down in seven chemical reaction equations of different sort and order.
Concentration equations
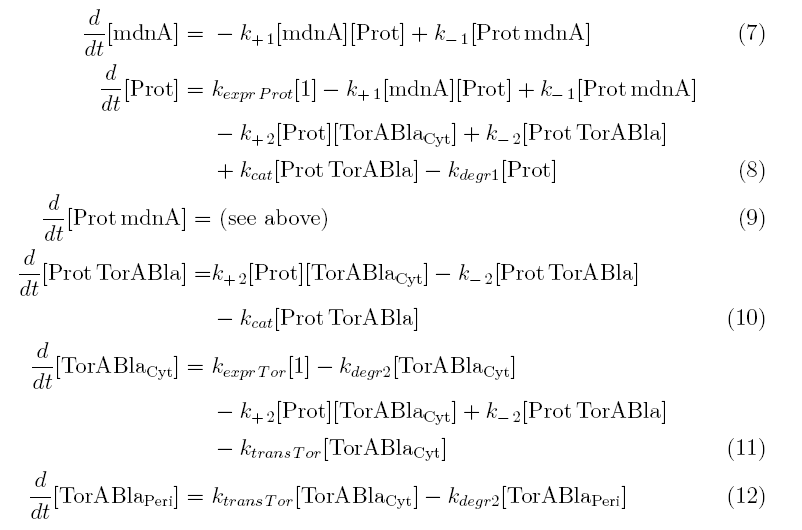
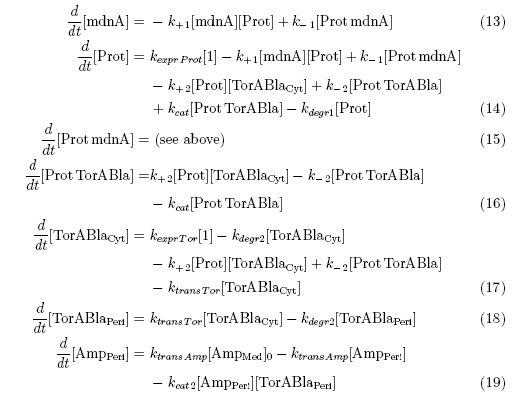
From the above reaction equations differential equations can be derived that describe the change of substance concentrations. Three concentrations are fixed, however:
To calculate each concentration at a certain time, several parameters (also refered to as constants or factors) have to be estimated. A literature research was not able to provide us with exact values for our system but a typical range for comparable systems could be assigned to all values. Most of the parameter units had to be transformed. The robustnes of the system towards changes of the most important constants was examined (see results) and some parameters could be estimated by fitting the system to lab measurements (see parameter estimation).
All not-constant concentrations can be represented in form of differential equations. Between time t1 and t2 four parameters are introduced:
- k+1 in (1/s*molecules)- parameter for the association of MdnA (microviridin) and Prot (protease)
- k-1 in (1/s) - parameter for the dissociation of the inhibited protease
- kexpr.prot in (molecules/s) - parameter for the expression of protease
- kdeg1 in (1/s) - parameter for the degradation of protease
Between time t2 and t3 six additional parameters are introduced:
- k+2 in (1/s*molecules)- factor for association of Prot (protease) and TorABla (β-lactamase)
- k-2 in (1/s) - parameter for the dissociation of protease and substrate
- kcat in (1/s) – parameter for the catalytic enzyme reaction that cleaves the signale TorA sequence from the β-lactamase inactivating the export
- kexpr.Tor in (molecules/s) - parameter for the the expression of β-lactamase
- kdeg2 in (1/s) – parameter for the degradation of β-lactamase
- ktransTor (1/s) – parameter by which β-lactamase in the cytoplasm is able to pass the membrane and get into the periplasm
After t3 there are only two more factors that we should introduce:
- ktransAmp (1/s) – parameter by which the added ampicillin in the medium is able to pass the outer membrane and get into the periplasm
- kcat2 in (1/s*molecules) – parameter for the catalytic enzyme reaction of ampicillin deactivation
Results
The equations above were solved using MATLAB. WARNING: These equations are moderately to very stiff! A solution can only be obtained using the functions ode23t or ode23s!
Using the Avogadro constant and the volume of a E.coli cell (9*10^-16 L) and a periplasm-volume of (3*10^-17 L), following constants were calculated and compared with similar literature values:
- k+1 = 8.e-6 (1/molecules*s)
- k-1 = 4.e-4 (1/s)
- kexpr.Prot = 0.6 (molecules/s)
- kdegr1 = 17.e-4 (1/s)
- k+2 = 4.e-5 (1/molecules*s)
- k-2 = 2.e-4 (1/s)
- kcat = 8 (1/s)
- kexpr.Tor = 1 (1/s)
- kdegr2 = 2.e-3 (1/s)
- ktransTor = 1.e-3 (1/s)
- ktransAmp = 5.e-3 (1/s)
- Kcat2 = 0.001 (1/molecules*s)
- mdnA(0) = 3000 (molecules)
- Amp(0 Med) = 8.e+2 (molecules)
- alpha = 0.3163 (forumlar parameter)
Now the concentration equations could be visualized in all three time segments:
It can be seen that there is only a negligible amount of ampicillin in the periplasm if the expression works as indicated. This amount of ampicillin has only a small effect on the growth rate of the cells. There is also a wide tolerance left for suboptimal conditions. The trigger time t1, t2 and t3 shall be about one hour after one another.
In the first section the effect of the inhibition can clearly be seen: Even though the continuous expression of protease, only a very small number remains active in the cytoplasm. In the second section β-lactamase is expressed. Most of the β-lactamase in the cytoplasm is destroyed by the protease, however the number is by far large enough to steadily release molecules into the periplasm where it cannot be affected by the protease any more. Because the volume of the periplasm is very small, the concentration there is even higher than the absolute amount of molecules in the graph suggests compared to the amount of molecules in the cytoplasm. The third section shows that the concentrations remain very steady and the cells are ampicillin resistant.
In case microviridin is not expressed the simulation indicates following substance concentrations that were correlated to our lab data of the same system (see parameter estimation). Under those conditions cells die quickly.
In case the protease is also not expressed the simulation indicates following substance concentrations. They were correlated to measurements as well. Protected by β-lactamase cells survive well on ampicillin plates.
Cells in which all parts of our system work are very ampicillin resistant and grow fast: They double their cell volume about every 20 minutes. If an error would appear and the ampicillin concentration inside the periplasma would increase over 2 µg/mL, the growth rate would slow down drastically and the cells might die. This way defect cell cultures can easily be separated from the good ones.
We constructed a formula for the ratio of the growth rate (cells double during this timespan) to the ampicillin concentration in n µg/mL out of data that we gained out of the lab.
The cell doubling time can approximately be calculated by: T(growth) = 20min+10*2^(2*n-1).
Analogous to this the cell surviving percentage can be estimated by: surviving cells in % = 25/(20min+10*2^(alpha*n-1)).
Here we display one example of how the change of a simulation constant impacts the growth of the cells and that our system is robust: The parameter KD (Dissociation of microviridin and protease divided by the association) is central to our model and the β-lactamase concentration in the periplasm an indicator for the cell survival. To see the dependence of β-lactamase on this constant, following plot (figure 8) was created:
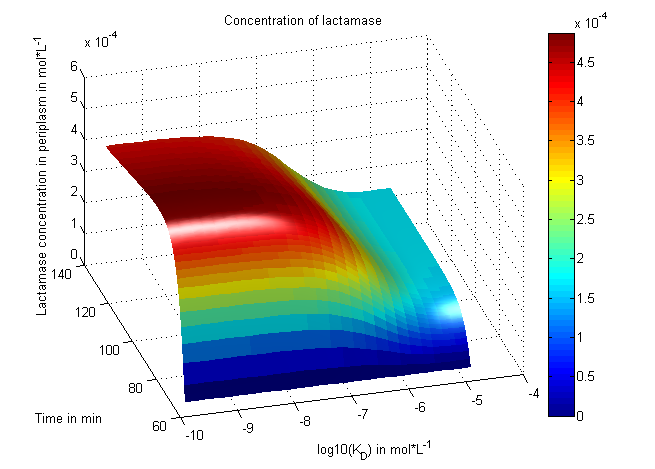
Figure 9 shows the relating cell doubling time that can be measured in the lab.

The β-lactamase concentration in the periplasm can be very small. Thus for this concentration a semi-stochastig model was produced by handling this value as integer. Such graphs are less smooth (see figures 10 and 11) (parameters were insignificantly changed).
We were able to see that our system works very well in theory. We learned about correct time-scales for our triggering and we were able to identify expected cell-division rates as reference for lab work.
Parameter estimation
As mentioned before most model parameters could only be estimated by looking at the order of magnitude of substances in similar systems and lab experiences combined with unit transformation. To make our model more reliable we improved critical parts of our model by relating it to lab measurements of cell survival in different variations of our system (see section in vivo selection). Especially two experiments were used: The percentage of surviving cells on different ampicillin concentration mediums with induced β-lactamase expression and a system with induced β-lactamse and also induced protease expression.
We implemented a routine for parameter estimation in MATLAB with the help of which the two parameter values could be specified (in direct relation to lab measurements) that we were least certain about before: alpha (the parameter in the formula (see above) connecting the ampicillin concentration in the periplasm and the percentage of surviving cells) and k(+2) (the parameter of association of the protease and the β-lactamase - here the aspect plays a role that the β-lactamase must first be folded before it can be transported into the periplasm, so in total the chance for association is higher due to the longer retention time). Alpha was specified to 0.3163 and k(+2) was specified to 2.0253*(1.e-5).
As can be seen on following figures 12 and 13, the model responses reliably to the measurements (see in vivo selection for more information). Thus predictions of the model concerning robustness (see results) and trigger times can be trusted.
MATLAB code
Media:conzt1.m
Media:conzt2.m
Media:conzt3.m
Media:UP_plottfuntionendreiaufeinmal2.m
Media:UP_celldivision2.m
Media:UP_lactamase2.m
Media:UP_parameter_estimation_1.m
Media:UP_parameter_estimation_2.m
 "
"
