Team:Peking S/project/blogic
From 2011.igem.org
(→Biological Implementation of Logic Gates: XOR Gate as an Example) |
(→Biological Implementation of Logic Gates: XOR Gate as an Example) |
||
| (61 intermediate revisions not shown) | |||
| Line 24: | Line 24: | ||
We have assigned a set of these three logic gates, AND, OR and NOT as our logic bases (Figure 1-3), not only because they are regarded as elementary parts in electronics, but also taking into account that there have been well established modular AND and OR gate [1, 2], and our quorum sensing repressors serve naturally as NOT gate. Moreover, this set is functionally complete, which is to say that any computational operation can be implemented by layering these gates together (Figure 4). | We have assigned a set of these three logic gates, AND, OR and NOT as our logic bases (Figure 1-3), not only because they are regarded as elementary parts in electronics, but also taking into account that there have been well established modular AND and OR gate [1, 2], and our quorum sensing repressors serve naturally as NOT gate. Moreover, this set is functionally complete, which is to say that any computational operation can be implemented by layering these gates together (Figure 4). | ||
| - | Besides, this set is also modulated. This is to say, any computational operation can be implemented by layering these gates together, and that this set can be rapidly connected to different inputs and used to drive different outputs ( | + | Besides, this set is also modulated. This is to say, any computational operation can be implemented by layering these gates together, and that this set can be rapidly connected to different inputs and used to drive different outputs (Anderson, [1]). |
| - | <center>[[File: | + | <center>[[File:JWY-AND.png|500px]]</center> |
''Figure 1. Schematic view of AND gate. T7ptag is a T7 RNA polymerase gene with two internal amber stop codons blocking translation, while supD is the amber suppressor tRNA. Only when both components are transcribed, T7 RNA polymerase is synthesized and this in turn activates a T7 promoter. Afterwards, T7 promoter would turn on the downstream gene expression as an output. The input promoters and output gene expressions can be changed according to the practical use of our AND gate, which guarantees its modularity.'' | ''Figure 1. Schematic view of AND gate. T7ptag is a T7 RNA polymerase gene with two internal amber stop codons blocking translation, while supD is the amber suppressor tRNA. Only when both components are transcribed, T7 RNA polymerase is synthesized and this in turn activates a T7 promoter. Afterwards, T7 promoter would turn on the downstream gene expression as an output. The input promoters and output gene expressions can be changed according to the practical use of our AND gate, which guarantees its modularity.'' | ||
| Line 48: | Line 48: | ||
<center>[[File:Gates2_(1).png|600px]]</center> | <center>[[File:Gates2_(1).png|600px]]</center> | ||
| - | ''Figure 4 | + | ''Figure 4. Sixteen combinational logic circuits with two inputs and one output, all implemented through the layout of AND, OR and NOT gates according to design principles proposed, with simplest construction and AND gates as few as possible. NIMPLY = NOT IMPLY.'' |
| Line 130: | Line 130: | ||
<center>[[File:Xor.png|500px]]</center> | <center>[[File:Xor.png|500px]]</center> | ||
| - | ''Figure 8 | + | ''Figure 8. XOR gate design. This combinational logic circuit has to be insulated by cell membrane into two cells, and the NOT gate can be implemented by our quorum sensing repressors through cell-cell communication.'' |
| Line 137: | Line 137: | ||
[[File:Table1.png|680px]] | [[File:Table1.png|680px]] | ||
| - | |||
| - | |||
===Biological Implementation of Logic Gates: XOR Gate as an Example=== | ===Biological Implementation of Logic Gates: XOR Gate as an Example=== | ||
| Line 144: | Line 142: | ||
'''Circuit Design''' | '''Circuit Design''' | ||
| - | Our XOR gate has been designed according to three principles proposed above. The whole gene network has been insulated by cell membrane into two cells, with | + | Our XOR gate has been designed according to three principles proposed above. The whole gene network has been insulated by cell membrane into two cells, communicating with a typical repressible ‘chemical wire', one of our quorum sensing inverters. |
| + | |||
| + | Gene circuit design of XOR gate is illustrated in Fig. 9. Cell A serves as a functional AND gate, of which two inputs are arabinose and salicylate, and the output is luxI, synthetase of our chemical wire 3OC6HSL. Cell B bears another AND gate, of which one input is generated by an OR gate sensing arabinose and salicylate, and the other input is 3OC6HSL, which is received by our lux repressible promoter. | ||
| + | |||
| + | |||
| + | <center>[[File:JWY-XOR-Cons1.png|500px]]</center> | ||
| + | |||
| + | <center>[[File:JWY-XOR-Cons2.png|500px]]</center> | ||
| + | |||
| + | ''Figure 9. Gene circuit Design of XOR gate. T7ptag in both AND gate is placed on pSB4K5 so that leakage of T7ptag is less, for the benefit of law metabolic burden.'' | ||
| + | |||
| + | |||
| + | '''Modeling''' | ||
| + | |||
| + | The transfer function of XOR gat is mainly based on AND gate. As a module to construct XOR gate, formula used to describe AND gate to predict the behavior of our XOR gate as well. | ||
| + | |||
| + | Transfer functions of AND gate is: | ||
| + | |||
| + | [[File:Pkusj1.png]] | ||
| + | |||
| + | Where Gmax is the maximum fluorescence observed for the output, I1 and I2 should be the activity of the input promoter (a=50+/-20, b=3000+/-1000). | ||
| + | |||
| + | The parameter a and b are chosen to fit the experiment data. Thus we assume that the formula (1) describe the AND gate’s behavior accurately and we use this formula to predict the performance of our XOR gate. | ||
| + | |||
| + | As Figure 8 illustrates, our XOR gate is designed involving two such AND gates. Here we point I1 to be the activity of the pBAD and I2 to be the activity of the pSal. According to the formula [1], the output of the first AND gate should be: | ||
| + | |||
| + | [[File:Pkusj2.png]] | ||
| + | |||
| + | We assume that the the amount of AHL is proportional to LuxI. Therefore the concentration of AHL should be: | ||
| + | |||
| + | [[File:Pkusj3.png]] | ||
| + | |||
| + | AHL will bind to its transcriptional factor and the concentration of bound transcription factor at equilibrium is: | ||
| + | |||
| + | [[File:Pkusj4.png]] | ||
| + | |||
| + | The activity of the plux_inv is decided by the following formula: | ||
| + | |||
| + | [[File:Pkusj5.png]] | ||
| + | |||
| + | To reduce the number of parameters, we can assume that Amax=1, since the value of C will not change if we divide Amax and Kd with same number. For the similar reason, we can let C0=1. Then we get: | ||
| + | |||
| + | [[File:Pkusj6.png]] | ||
| + | |||
| + | We notice that plux_inv is the I1 of the second AND gate. Besides, I2 of the second AND gate is the sum of the activity of the pBAD and pSal. | ||
| + | |||
| + | [[File:Pkusj7.png]] | ||
| + | |||
| + | Then comes the simulation result of XOR gate: | ||
| + | |||
| + | <center>[[File:XOR simu.png|500px]]</center> | ||
| + | |||
| + | ''Figure 10. The simulation result of XOR gate.'' | ||
| + | |||
| + | |||
| + | |||
| + | Using the similar definition of sensitivity in balancer, we list the value of parameter and its sensitivity. | ||
| + | We calculate the OUTPUT/OUTPUTmax with input (10, 10), (10, 1000), (1000, 10), (1000, 1000) respectively. Assume that OUTPUT1/OUTPUTmax is the smaller one of the OUTPUT/OUTPUTmax with input (10, 1000), (1000, 10). OUTPUT2/OUTPUTmax is the larger one of the OUTPUT/OUTPUTmax with input (10,10),(1000,1000). We define p as the symbol of the goodness of the performance: | ||
| + | |||
| + | [[File:Pkusj8.png]] | ||
| + | |||
| + | Then the sensitivity can be calculated in the following way: | ||
| + | |||
| + | [[File:Pkusj9.png]] | ||
| + | |||
| + | Table 2. Parameters in model | ||
| + | |||
| + | <center>[[File:Tableparameter.png|600px]]</center> | ||
| + | |||
| + | The chart demonstrates that the parameters in our model are insensitive so that they are chosen reasonably. Our model predicts a good performance of XOR gate under these reasonable parameters. | ||
| + | |||
| + | |||
| + | '''Experimental Results''' | ||
| + | |||
| + | We have already constructed appropriate plasmids and tested their performance separately. Afterwards, the whole system consisting of A, B cells was verified and operated together. | ||
| + | |||
| + | |||
| + | A CELL | ||
| + | |||
| + | In order to test the performance of A cell, mainly its AND gate, we substituted luxI protein with a reporter gfp in the plasmid pSB1AT3, and transformed it together with an AND gate on pSB4K5 (Figure 11) into E.coli. Subsequently, cell behavior was investigated by applying arabinose and salicylate in gradient. The result was measured by a microplate reader. We also took a photo for a more visualized view. Figure 11 illustrates that our AND gate works as expected: the downstream output would be generated only when both inputs were present. | ||
| + | |||
| + | <center>[[File:JWY and gate.png|500px]]</center> | ||
| + | |||
| + | <center>[A]</center> | ||
| + | |||
| + | <center>[[File:AND-supp.png|500px]]</center> | ||
| + | |||
| + | <center>[B]</center> | ||
| + | |||
| + | |||
| + | ''Figure 11. Performance of an AND gate in cell A.'' | ||
| + | |||
| + | ''[A]Concentrations of arabinose are 1e-8M, 1e-7M, 1e-6M, 1e-5M, 1e-4M and 1e-3M, while those of salicylate are 1e-8M, 1e-7M, 1e-6M, 1e-5M, 1e-4M and 1e-3M, respectively. The Z axis denotes the intensity of fluorescence normalized by the OD600 value. | ||
| + | '' | ||
| + | |||
| + | ''[[B]Cells in first three EP tubes (left to right) were induced by arabinose, salicylate, and arabinose along with salicylate, respectively, while cells in the fourth tube were left without inducement as a control. Only the cells induced by both arabinose and salicylate generated enough GFP, indicating effectiveness of our AND gate in cell A. | ||
| + | '' | ||
| + | |||
| + | |||
| + | B CELL | ||
| + | |||
| + | Cells harboring appropriate plasmids were induced by following sets of inducers: 10^-3 arabinose, 10^-4 salicylate, and 10^-3 arabinose , 10^-4 salicylate along with 10^-6 HSL, and the result was photographed for a visualized view (Figure 12). | ||
| + | |||
| + | |||
| + | <center>[[File:Bcell-supadd.png|500px]]</center> | ||
| + | |||
| + | |||
| + | ''Figure 12. GFP expression of B cell. From Left to Right: Cells in first left two EP tubes (left to right) were induced by arabinose, salicylate, cell in third EP tube was induced by arabinose and , salicylate along with AHL, while cells in the fourth tube were left without inducement as a control. | ||
| + | '' | ||
| + | |||
| + | From the results above, we have found that our B cells are always sensitive to HSL. Nevertheless, their behavior seems to be independent of the concentration of arabinose or salicylate, and also show significant basal level of fluorescence, which indicates that the leakage of arabinose or salicylate sensor regulated promoter is significant, and as a result, the basal expression of supD is high enough to work on rescue T7ptag, which is constructively constitutively expressed in the absence of HSL in our circuit. | ||
| + | |||
| + | There are several approaches for possible improvements. According to Anderson’s[1] and our previous team’s work, random mutagenesis on RBS upstream of T7ptag, which determines the activity range of its promoter, could modulate the function of the AND gate. Similar methods may be applied to our B cell, and thus to get an appropriate RBS, the constructive expression level of T7ptag may be lessen, result in less basal level of the whole circuit. Moreover, tuning the copy number of supD would be a more straightforward approach. It is promising to bring down the basal expression of supD by swapping the plasmid containing arabinose and salicylate induced supD from current medium copy number backbone to a lower copy number backbone, e.g. pSB4K5. To construct a new plasmid containing tandem promoters, pBAD and pSal with only one downstream supD may also contribute to potential reduction of supD basal expression. | ||
| + | |||
| + | |||
| + | ASSEMBLY | ||
| + | |||
| + | We have assembled A cell and B cell and tested its behavior by liquid culture assay (Figure 13). | ||
| + | |||
| + | |||
| + | <center>[[File:XOR supadded.png|500px]]</center> | ||
| - | |||
| - | |||
| - | + | ''Figure 13. Result of the liquid culture assay. Two strains were inoculated together at t = 0, and grown as co-culture. The picture showed for result of induction with 10^-3 arabinose, 10^-4 salicylate, 10^-3 arabinose and 10^-4 salicylate, blank (top to bottom) | |
| + | '' | ||
| - | + | The results were not satisfying. Though showing a XOR gate result, most of the A/B cell assemblies illustrated significant basal level of gfp fluorescent. These circumstances were coherent with the result of cell B mentioned above, which we suppose is due to high basal expression of supD. | |
| - | + | This result has can also been be reasonably explained with our XOR gate model. Figure 13 is our simulation result of XOR gate, in which the variables space is extended to cover a sufficiently large range of inputs. Nevertheless, the two inputs in experiment can only vary within a quite limited range which is a sub-region of the I1-I2 space. Rectangular region in Figure 14 represents phase diagram of our present XOR gate module. | |
| - | + | Models of XOR gate also indicates that variations in the translation strength can be reflected by changes in the range of arbitrary input. Therefore, lessening the basal expression level of salicylate promoter and random mutagenesis on RBS upstream of T7ptag, may result in shifting of the rectangular region, and get a better XOR gate outcome. | |
| - | |||
| - | + | <center>[[File:Phase.png|500px]]</center> | |
| - | + | ''Figure 16. Simulation result of XOR gate. White rectangular illustrates phase diagram of our present XOR gate, and grey one illustrates phase diagram after random mutagenesis and screening, which performed as a XOR gate.'' | |
| - | |||
| - | |||
| - | + | We then designed a random mutagenic library of four positions in the RBS upstream of T7ptag and the resulting library of variants was then screened and primarily characterized by induced with arabinose, salicylate and AHL in 96-well plates. The performance of each individual construct was compared with that of the previous one. There were several candidates that performed quite well (Figure 17). Further characterization need to be done to verify their performance. | |
| - | + | <center>[[File:JWY-XOR-Screen.png|500px]]</center> | |
| - | + | ''Figure 17. Primary characterization result of one promising candidate. Cells in first left two EP tubes (left to right) were induced by arabinose, salicylate, cell in third EP tube was induced by arabinose and , salicylate along with AHL, while cells in the fourth tube were left without inducement as a control. '' | |
| - | + | ||
| - | + | ||
===References=== | ===References=== | ||
Latest revision as of 11:52, 18 October 2011
Template:Https://2011.igem.org/Team:Peking S/bannerhidden Template:Https://2011.igem.org/Team:Peking S/back2
Template:Https://2011.igem.org/Team:Peking S/bannerhidden

Boolean Logic
Boolean Logic Synthetic Microbial Consortia|
Extension of the Boolean Logic
Boolean Logic Synthetic Microbial Consortia
We have harvested, re-designed and quantitatively characterized enough ‘chemical wires’ for developing this ‘chemical wire’ toolbox. But this was not the end. We noticed that there is actually a trade-off between signaling speed and layers of cell-cell signal transduction when distributing a logic function among a synthetic microbial consortium. More layers there are, more time needs to be cost during signal transduction, but with less difficulty implementing each layer.
To figure out how to cope with this trade-off, we next sought to propose design rules and thus to develop software to facilitate the distribution of Boolean logic gene network among a synthetic microbial consortium.
Design Rules and Software for Boolean Network Distribution
We have assigned a set of these three logic gates, AND, OR and NOT as our logic bases (Figure 1-3), not only because they are regarded as elementary parts in electronics, but also taking into account that there have been well established modular AND and OR gate [1, 2], and our quorum sensing repressors serve naturally as NOT gate. Moreover, this set is functionally complete, which is to say that any computational operation can be implemented by layering these gates together (Figure 4).
Besides, this set is also modulated. This is to say, any computational operation can be implemented by layering these gates together, and that this set can be rapidly connected to different inputs and used to drive different outputs (Anderson, [1]).
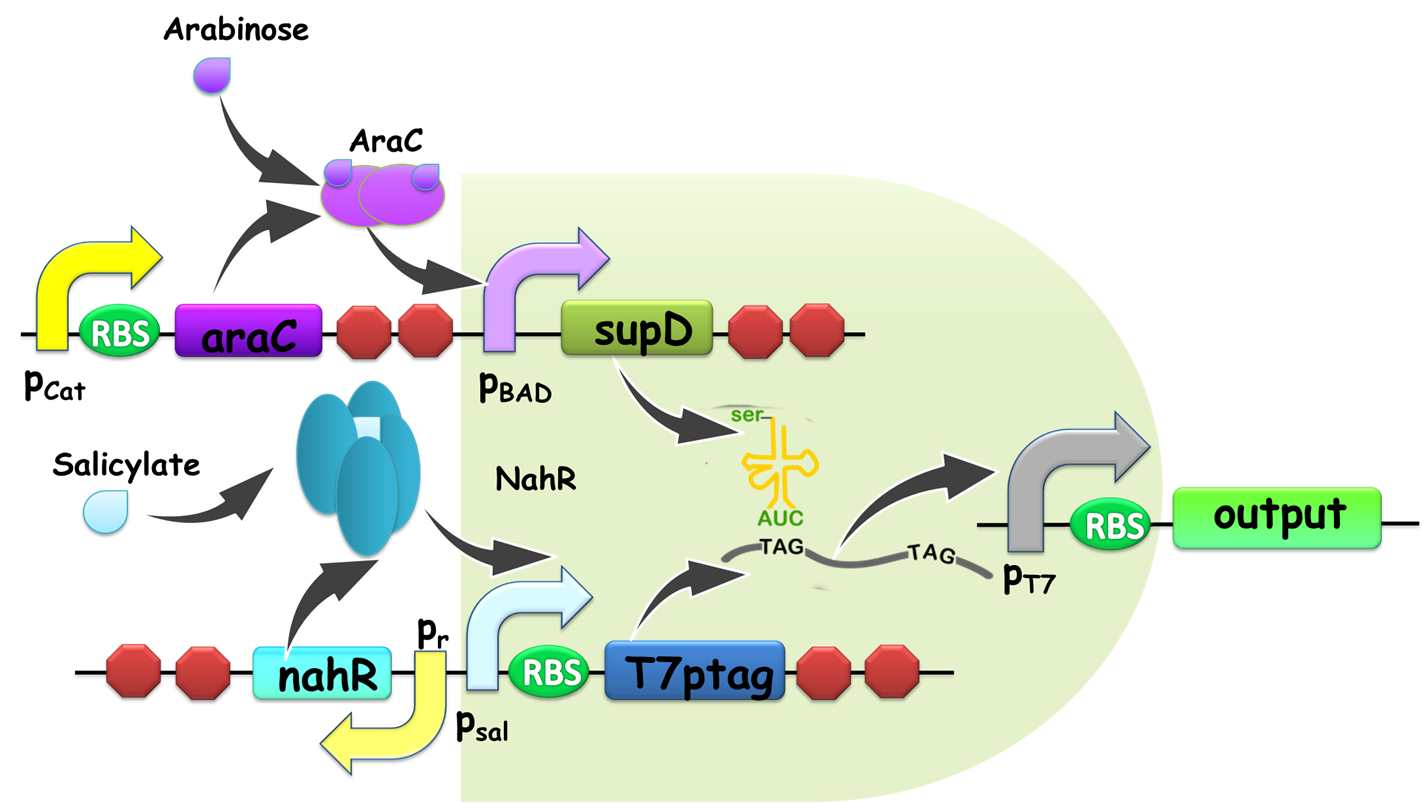
Figure 1. Schematic view of AND gate. T7ptag is a T7 RNA polymerase gene with two internal amber stop codons blocking translation, while supD is the amber suppressor tRNA. Only when both components are transcribed, T7 RNA polymerase is synthesized and this in turn activates a T7 promoter. Afterwards, T7 promoter would turn on the downstream gene expression as an output. The input promoters and output gene expressions can be changed according to the practical use of our AND gate, which guarantees its modularity.
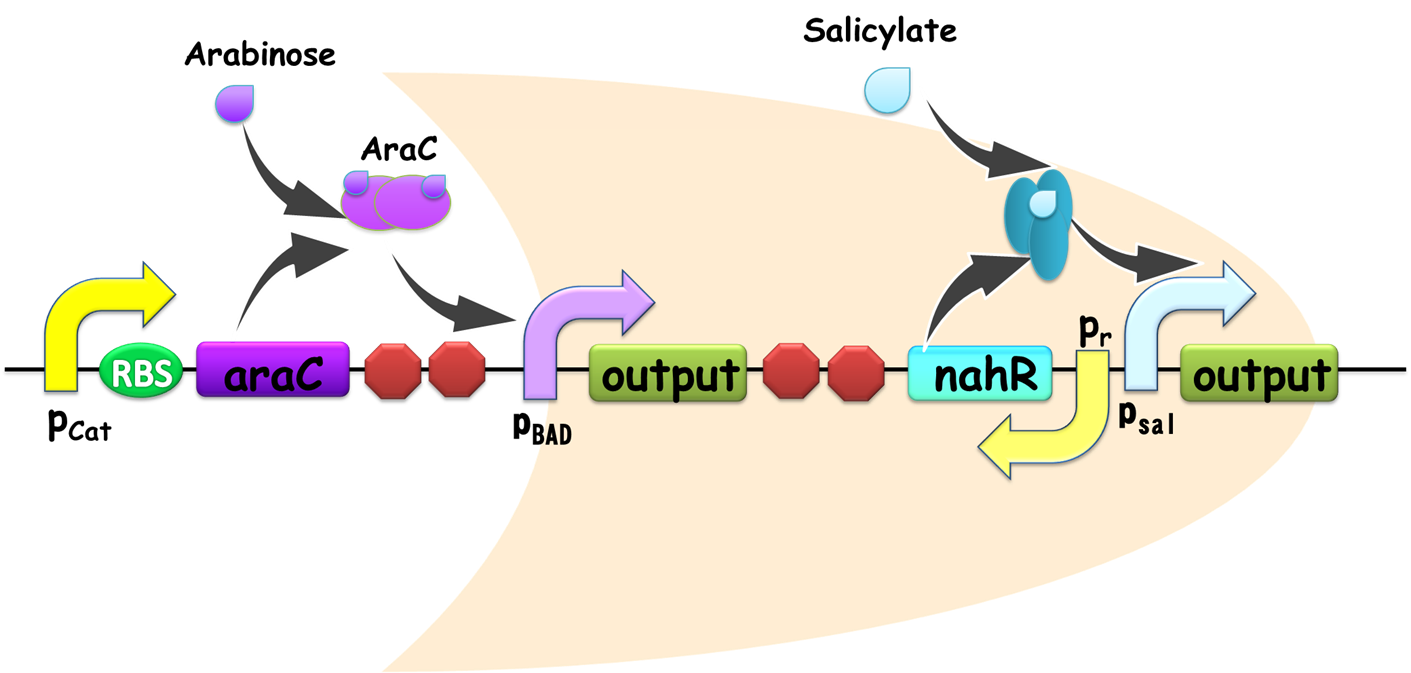
Figure 2. Schematic view of OR gate. Two promoters, pBAD and pSal share a same output gene, so if any one of them is on, the output gene would be generated, and the gate is ON. Similar with our AND gate, the input promoters can be readily substituted in practical use, establishing its advantage for modular use.

Figure 3. An archetype of conventional genetic inverter serving as our NOT gate. The core component of this inverter is a repressor-operator pair (in this case, the lacI-LacO pair). For detailed infromation, click here.
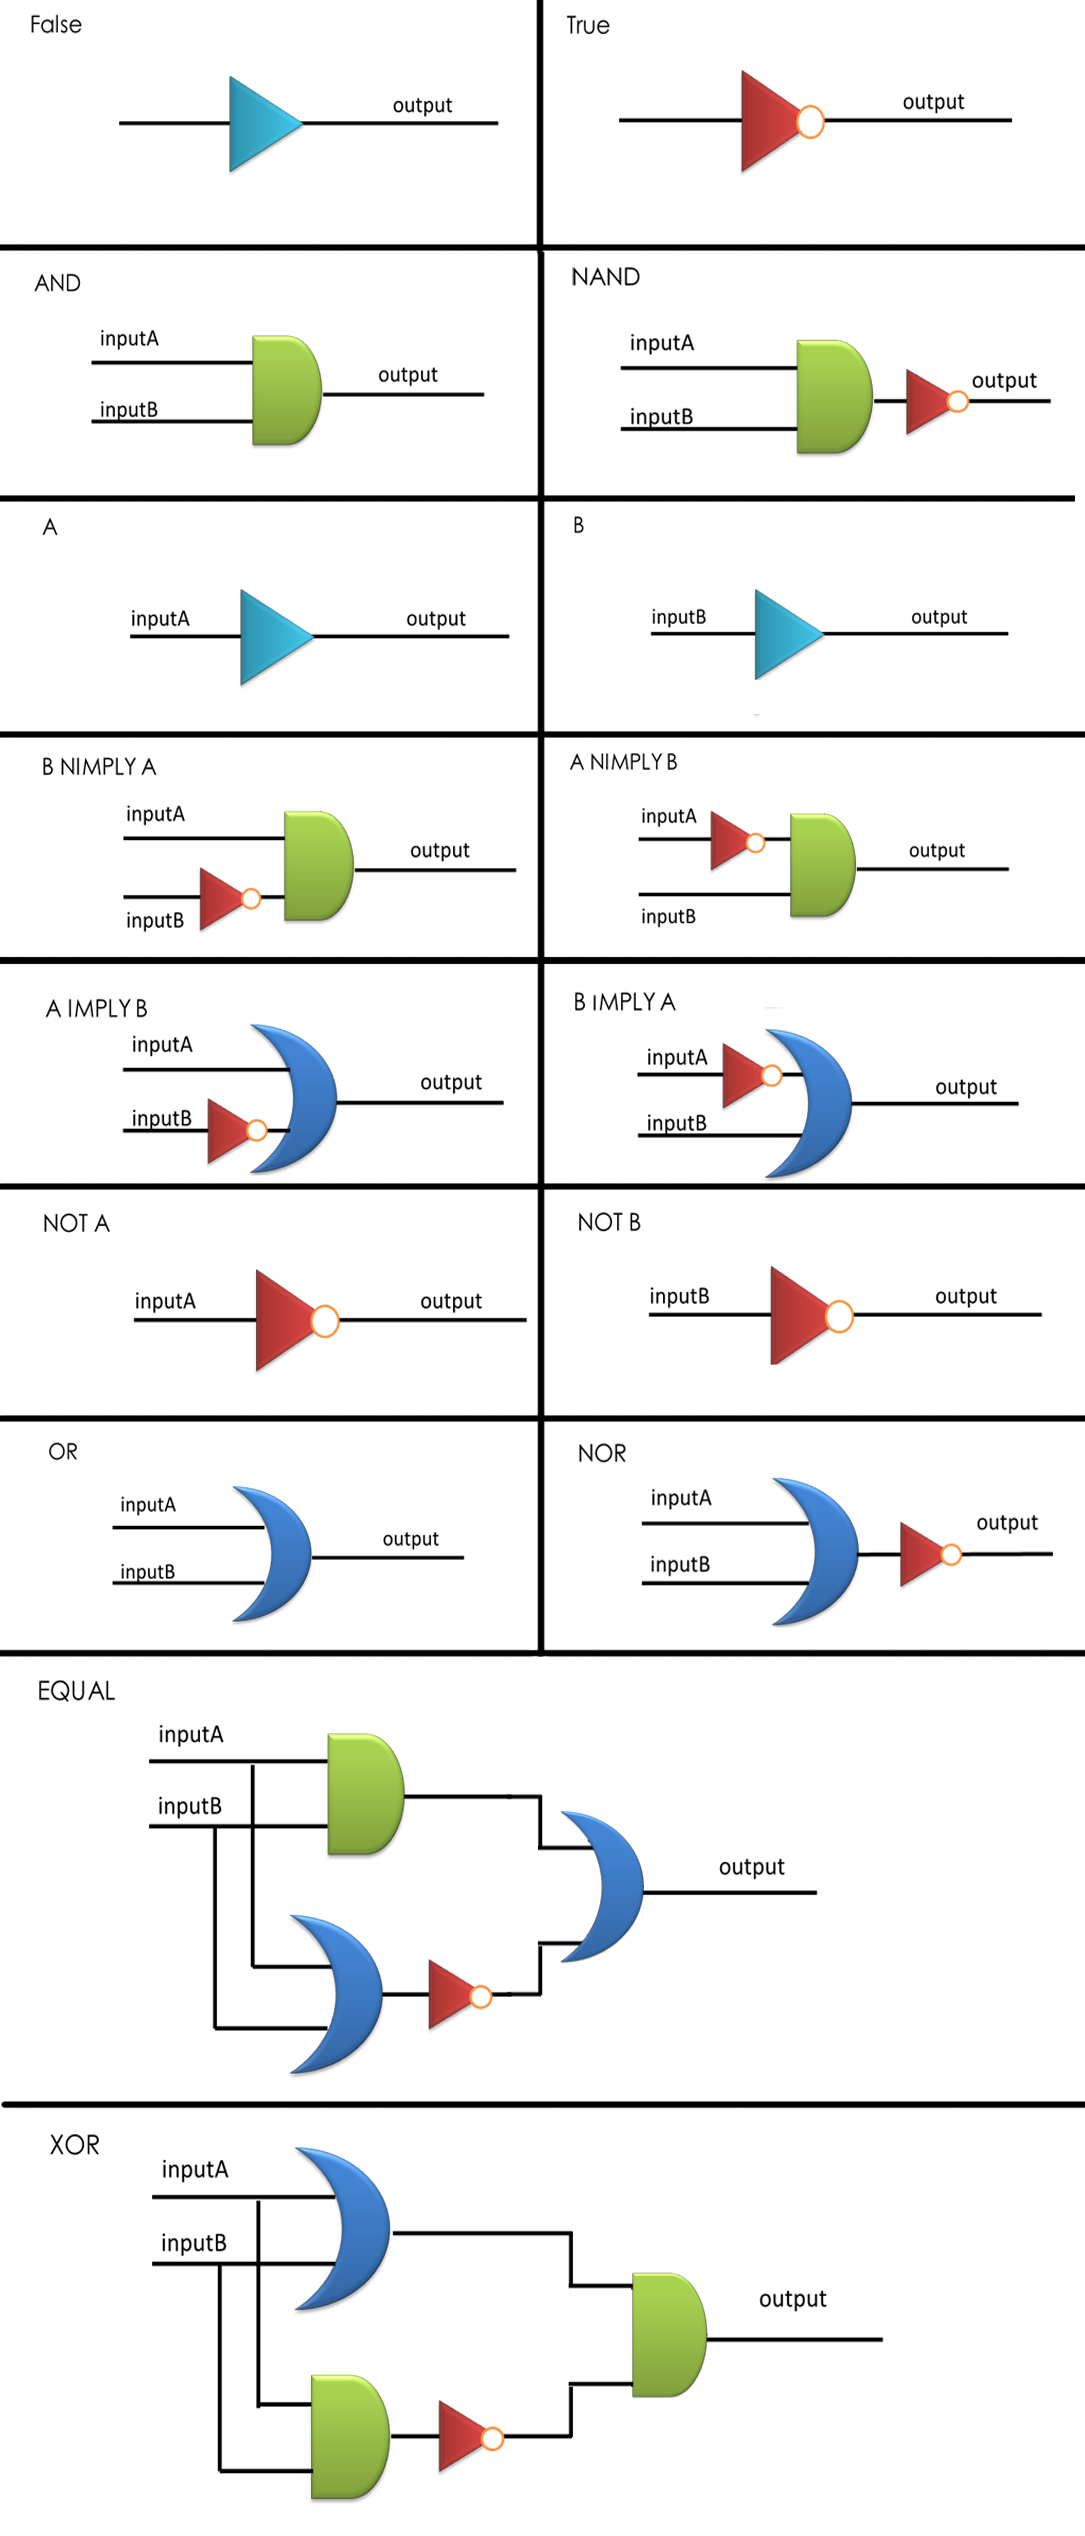
Figure 4. Sixteen combinational logic circuits with two inputs and one output, all implemented through the layout of AND, OR and NOT gates according to design principles proposed, with simplest construction and AND gates as few as possible. NIMPLY = NOT IMPLY.
Modeling for AND, OR and NOT gates have been established.
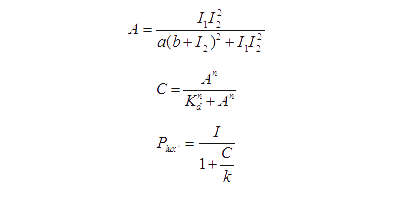
Transfer functions of AND gate[1] is:

Where Gmax is the maximum fluorescence observed for the output, I1 and I2 should be the activity of the input promoter (a=50+/-20, b=3000+/-1000).;
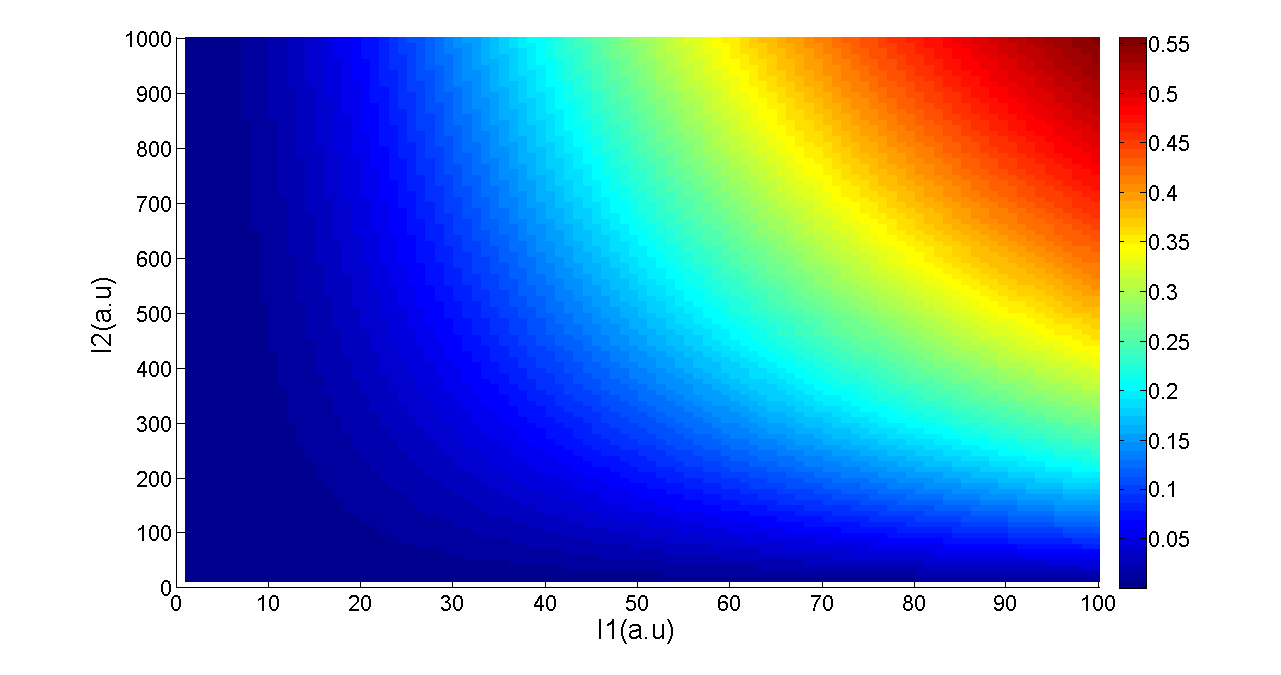
Figure 5. Transfer function of AND gate. I1 and I2 denote two inputs of the AND gate. Only when two inputs both present in the system, the output would be ON.
When two promoters controls the transcription of a gene, the promoters can either be additive or interfere with each other. In most case, tandem promoters are nearly additive. In our design of OR gate, the two promoters seldom interfere each other since they regulate separated identical output genes (Figure 2), and as a consequence it is reasonable to discuss additive situation only.
The production of X is modeled as [1]:

Equation (2) reduces to the following at steady-state:

(x is the concentration of inducer).
Basing on formula (2) to (4), we get the simulation result:
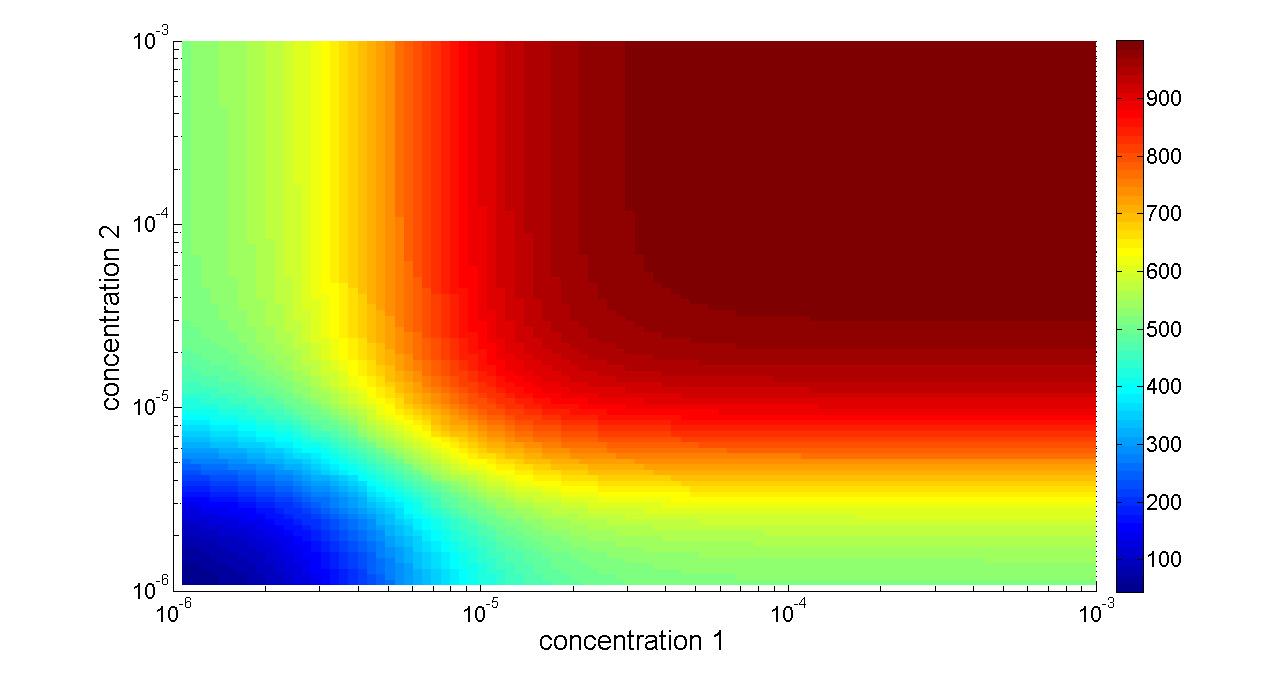
Figure 6. Transfer function of OR gate. Concentration 1 and 2 denote two inputs of the OR gate. When any one of the two inputs presents in the system, the output would be ON.
For our NOT gate (quorum sensing repressors), the binding of a ligand to its transcription factor at equilibrium is:

where C is the concentration of bound transcription factor, C0 is the total concentration of transcription factors, L is the concentrations of ligands, Kd is the dissociation constant, and n is the cooperativity. By mass conservation, the concentration of free transcription factor CF is:
The probability for each promoter in open is described by the following equations:

Basing on formula (5) to (7), we get the simulation result:
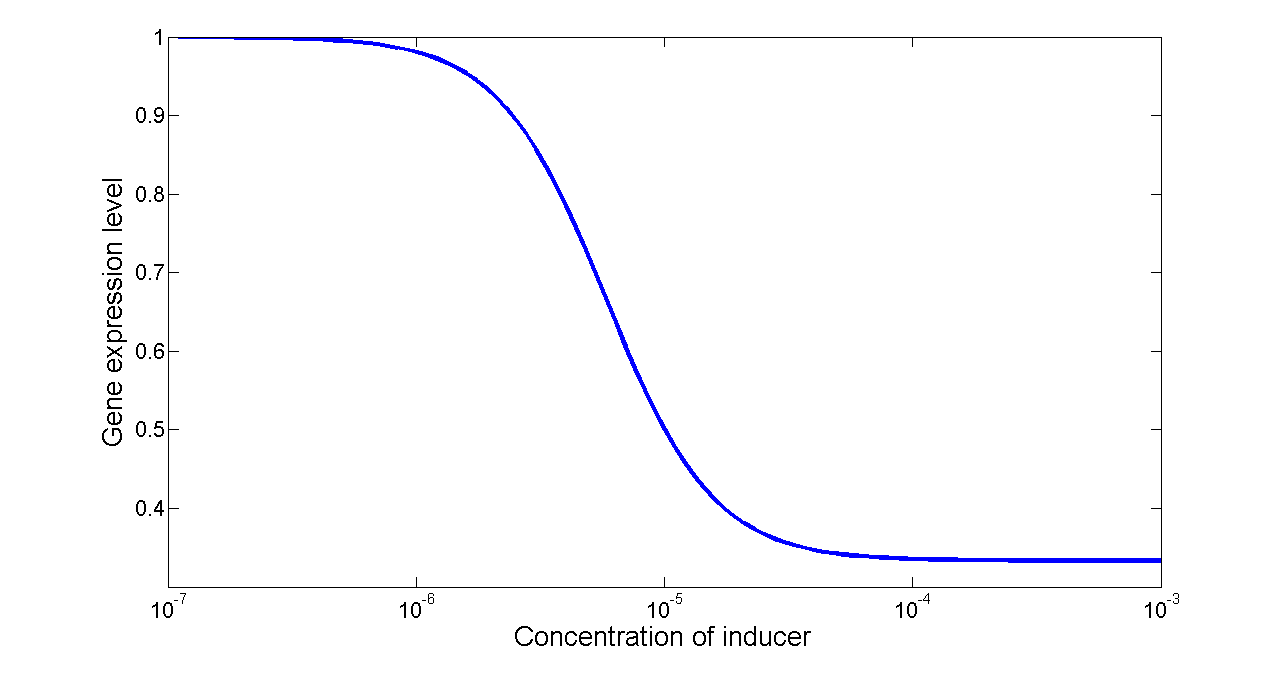
Figure 7. Transfer function of NOT gate. When the inducer presents in high concentration, gene expression would be inhibited, while low concentration of inducer would activate gene expression, exhibiting a typical performance of NOT gate.
As a proof of principle, we have exhausted all possible Boolean logic functions with two inputs and one output. We speculated that the first design rule is to find out the simplest construction of each two-input logic gate, where 'simplest' was defined as the fewest logic bases utilized in the whole network.
In addition, if several layouts can be generated for a specific logic circuit using the same number of logic bases, we tended to select the one using more NOT and OR, since these two gates are easier to be assembled into cells and cause less metabolic burden compared with AND gate.
We have developed a specific Breadth-First-Search (BFS) method to find out each combinational logic circuit meeting the design requirements. First of all, the outputs A and B could be readily obtained without any logic bases. Then we applied NOT, OR and AND gate respectively to the established circuits, resulting in NOT A, NOT B, A OR B and A AND B. Once again, by connecting the newly-obtained logic gates using the three bases, we could construct more new gates, and similarly repeated procedures would generate all the sixteen combinational logic gates, and the BFS method itself would guarantee that all the combinations of logic bases we have found are the simplest ones corresponding to our definition. The CPP source files of our calculation as well as the program are available on our wiki. download
Compared with their silicon-based counterparts, the biological logic circuits are more difficult to be scaled up by simply layering the elementary bases in a single cell, due to crosstalk among cellular components, cascade of intrinsic noise as well as metabolic burden accompanied by expression of overfull foreign genes in host cells [3]. While Tamsir, A. et al. have proposed a multicellular approach to implementing complex logic circuits as an alternative [2], their concept of constructing all possible circuits utilizing a single NOR gate would inevitably result in bringing more cells in the system to fulfill a certain function, and the time required to calculate a specific result would also be dramatically extended. In addition to resulted time delay, it may also cause unexpected time sequential problem when functioning.
Aimed at balancing the two aspects discussed above, here we have proposed our third rule for multicellular networks distribution. To avoid excessive noise and decrease basal level, it is desired that the tandem logic bases in a single cell cannot be more than three layers, so that the intrinsic noise of each cell would be suppressed by an overall average on the whole population when the signal is sent out by the wiring-molecule to a downstream cell via quorum sensing. On the other hand, two or more signal pathways sharing the same input signal should not co-exist within a single cell, otherwise they would compete for the limited regulatory proteins, resulting in ineffectiveness and non-modularity of logic calculation.
Consequently, we have focused on finding out logic bases distributions satisfying the mentioned principles, with no more than three tandem layers and no two or more pathways sharing same upstream signals. Since our system is relative small in size, we exploited 'greedy' algorithm to guarantee the distribution would be optimized in the sense of fewest cells included in the circuit.
By applying the principles to our sixteen two-input, one-output circuits discussed above (Figure 4), we discovered that all other logic circuits could be implemented in a single cell without violating them, except for XOR and EQUAL gates. Since these two gates are structurally similar, we have focused on the biological implementation of XOR gate (Table 1) as a proof of concept (Figure 8), demonstrating the robustness and efficiency of our system under the rules proposed above.
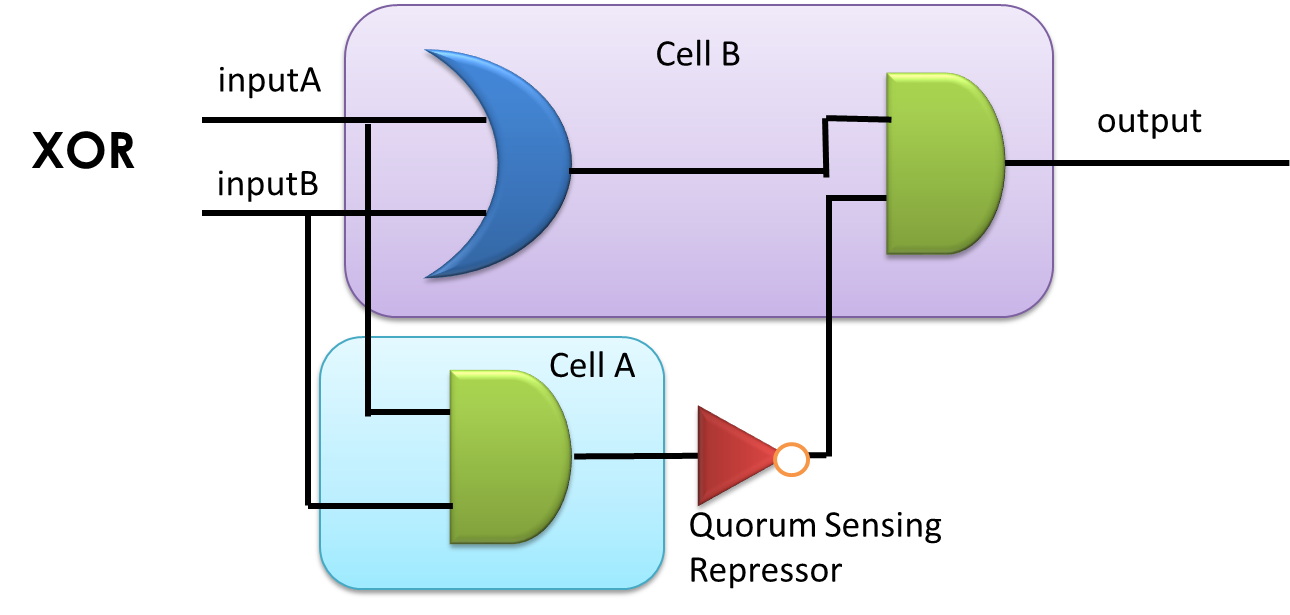
Figure 8. XOR gate design. This combinational logic circuit has to be insulated by cell membrane into two cells, and the NOT gate can be implemented by our quorum sensing repressors through cell-cell communication.
Table 1. Truth table of XOR gate
Biological Implementation of Logic Gates: XOR Gate as an Example
Circuit Design
Our XOR gate has been designed according to three principles proposed above. The whole gene network has been insulated by cell membrane into two cells, communicating with a typical repressible ‘chemical wire', one of our quorum sensing inverters.
Gene circuit design of XOR gate is illustrated in Fig. 9. Cell A serves as a functional AND gate, of which two inputs are arabinose and salicylate, and the output is luxI, synthetase of our chemical wire 3OC6HSL. Cell B bears another AND gate, of which one input is generated by an OR gate sensing arabinose and salicylate, and the other input is 3OC6HSL, which is received by our lux repressible promoter.
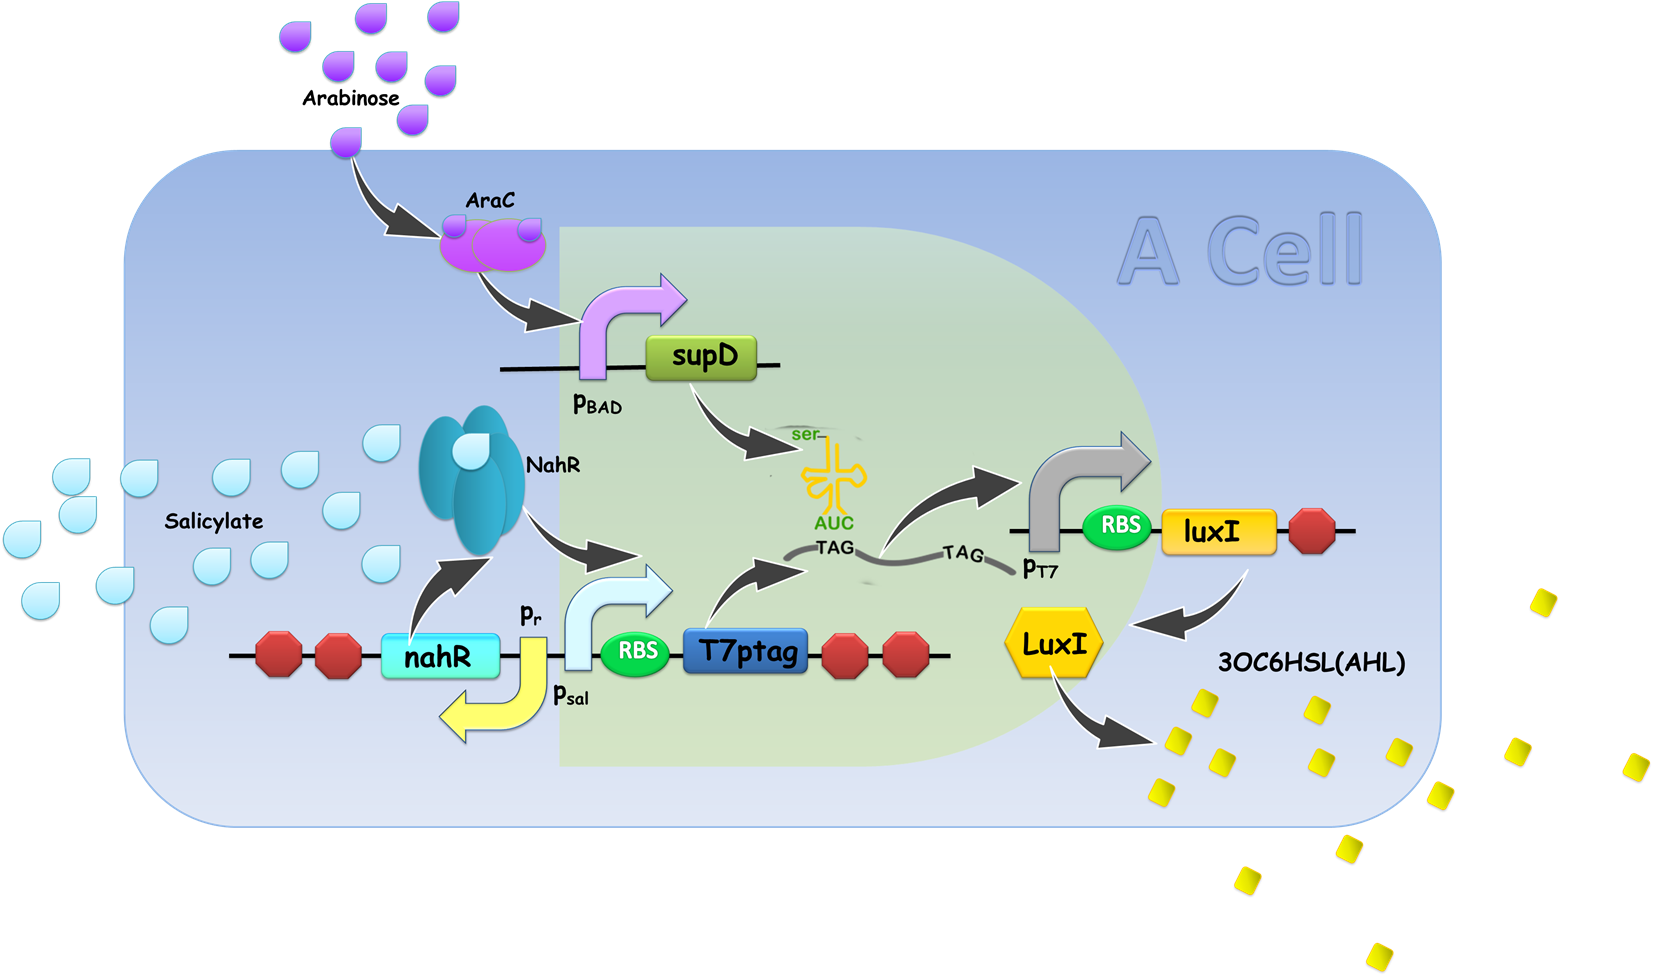
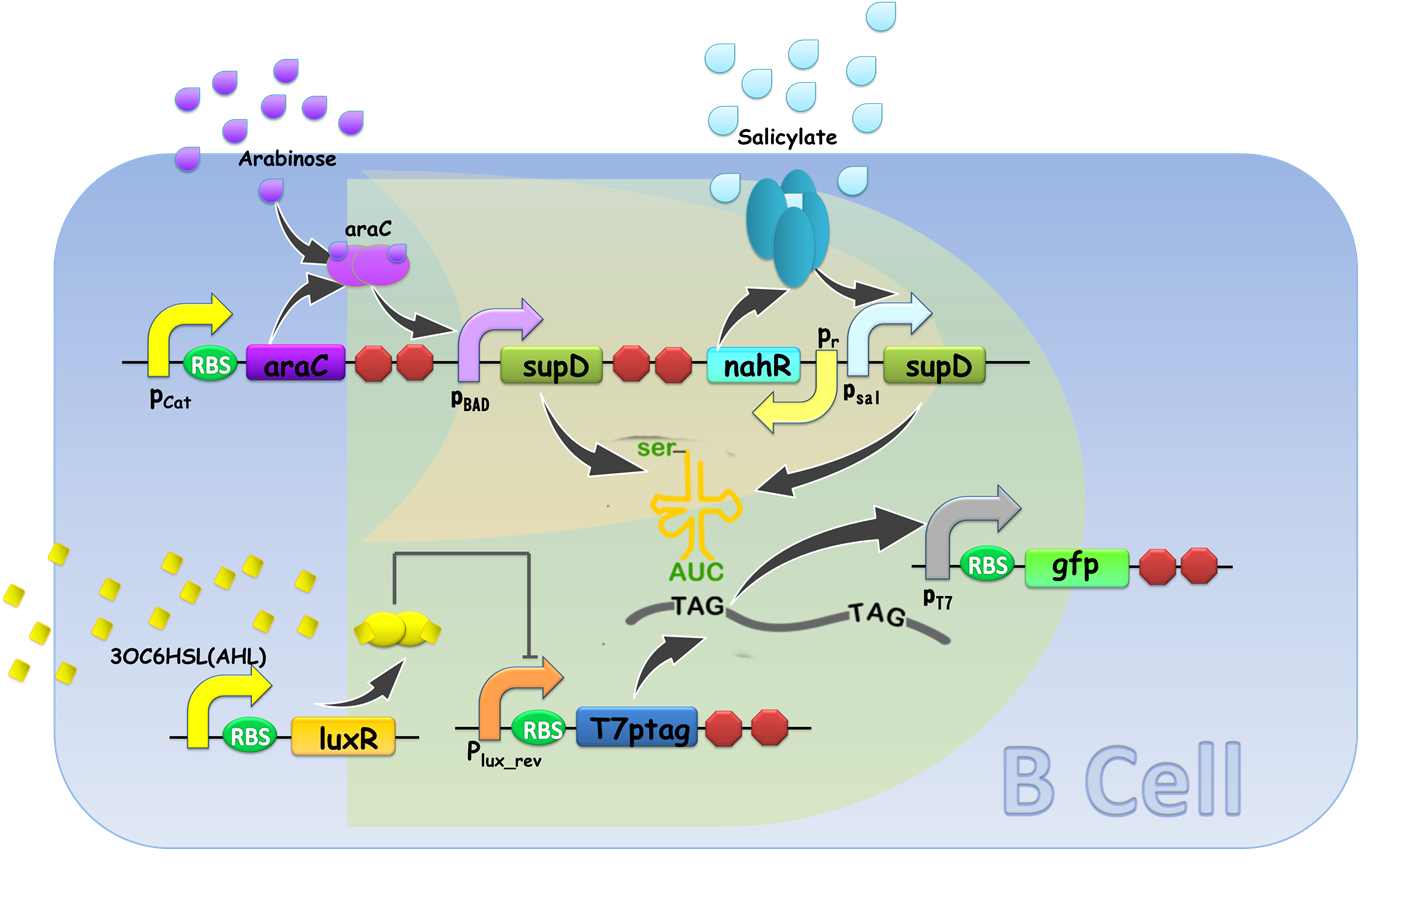
Figure 9. Gene circuit Design of XOR gate. T7ptag in both AND gate is placed on pSB4K5 so that leakage of T7ptag is less, for the benefit of law metabolic burden.
Modeling
The transfer function of XOR gat is mainly based on AND gate. As a module to construct XOR gate, formula used to describe AND gate to predict the behavior of our XOR gate as well.
Transfer functions of AND gate is:
Where Gmax is the maximum fluorescence observed for the output, I1 and I2 should be the activity of the input promoter (a=50+/-20, b=3000+/-1000).
The parameter a and b are chosen to fit the experiment data. Thus we assume that the formula (1) describe the AND gate’s behavior accurately and we use this formula to predict the performance of our XOR gate.
As Figure 8 illustrates, our XOR gate is designed involving two such AND gates. Here we point I1 to be the activity of the pBAD and I2 to be the activity of the pSal. According to the formula [1], the output of the first AND gate should be:
We assume that the the amount of AHL is proportional to LuxI. Therefore the concentration of AHL should be:
AHL will bind to its transcriptional factor and the concentration of bound transcription factor at equilibrium is:
The activity of the plux_inv is decided by the following formula:
To reduce the number of parameters, we can assume that Amax=1, since the value of C will not change if we divide Amax and Kd with same number. For the similar reason, we can let C0=1. Then we get:
We notice that plux_inv is the I1 of the second AND gate. Besides, I2 of the second AND gate is the sum of the activity of the pBAD and pSal.
Then comes the simulation result of XOR gate:
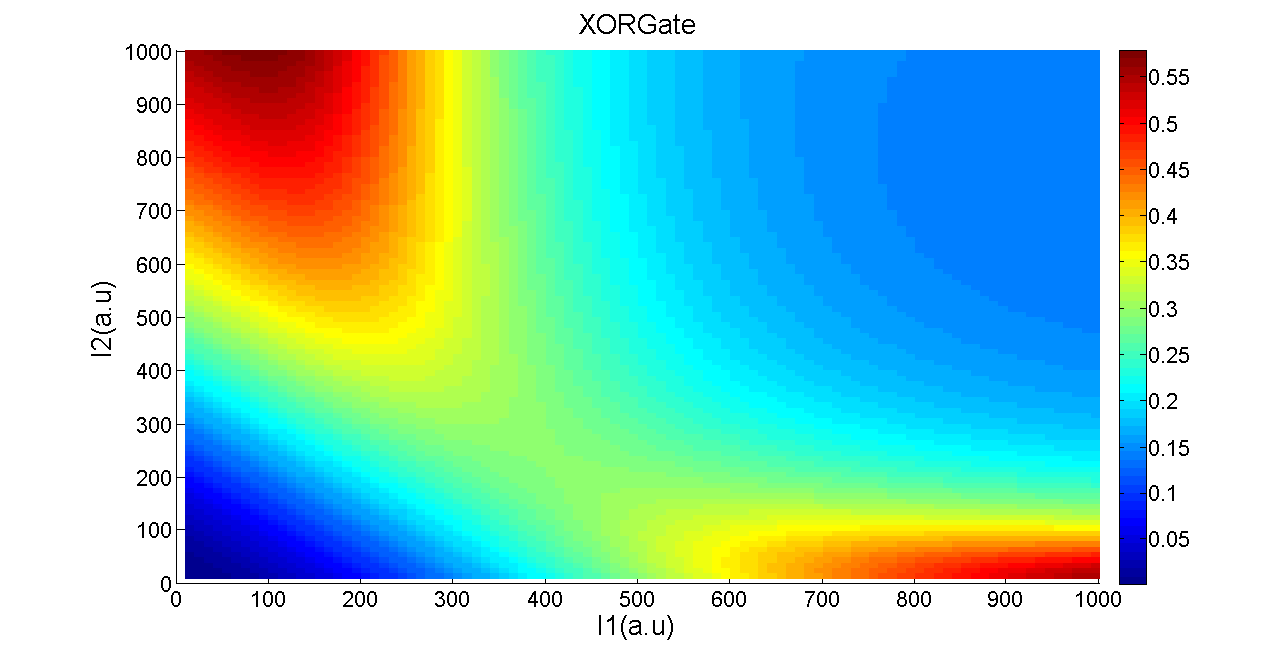
Figure 10. The simulation result of XOR gate.
Using the similar definition of sensitivity in balancer, we list the value of parameter and its sensitivity. We calculate the OUTPUT/OUTPUTmax with input (10, 10), (10, 1000), (1000, 10), (1000, 1000) respectively. Assume that OUTPUT1/OUTPUTmax is the smaller one of the OUTPUT/OUTPUTmax with input (10, 1000), (1000, 10). OUTPUT2/OUTPUTmax is the larger one of the OUTPUT/OUTPUTmax with input (10,10),(1000,1000). We define p as the symbol of the goodness of the performance:
Then the sensitivity can be calculated in the following way:
Table 2. Parameters in model

The chart demonstrates that the parameters in our model are insensitive so that they are chosen reasonably. Our model predicts a good performance of XOR gate under these reasonable parameters.
Experimental Results
We have already constructed appropriate plasmids and tested their performance separately. Afterwards, the whole system consisting of A, B cells was verified and operated together.
A CELL
In order to test the performance of A cell, mainly its AND gate, we substituted luxI protein with a reporter gfp in the plasmid pSB1AT3, and transformed it together with an AND gate on pSB4K5 (Figure 11) into E.coli. Subsequently, cell behavior was investigated by applying arabinose and salicylate in gradient. The result was measured by a microplate reader. We also took a photo for a more visualized view. Figure 11 illustrates that our AND gate works as expected: the downstream output would be generated only when both inputs were present.
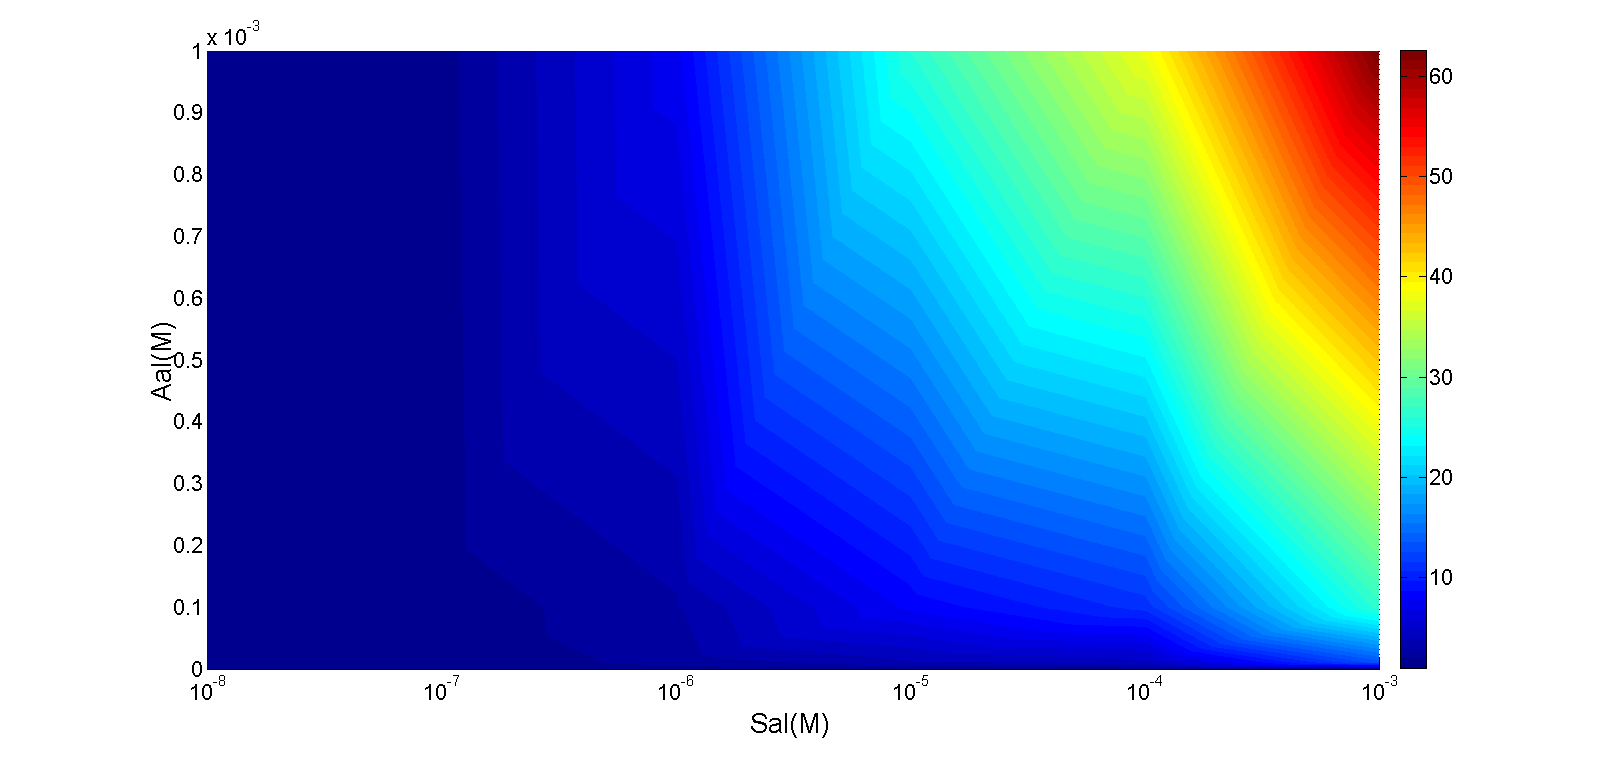

Figure 11. Performance of an AND gate in cell A.
[A]Concentrations of arabinose are 1e-8M, 1e-7M, 1e-6M, 1e-5M, 1e-4M and 1e-3M, while those of salicylate are 1e-8M, 1e-7M, 1e-6M, 1e-5M, 1e-4M and 1e-3M, respectively. The Z axis denotes the intensity of fluorescence normalized by the OD600 value.
[[B]Cells in first three EP tubes (left to right) were induced by arabinose, salicylate, and arabinose along with salicylate, respectively, while cells in the fourth tube were left without inducement as a control. Only the cells induced by both arabinose and salicylate generated enough GFP, indicating effectiveness of our AND gate in cell A.
B CELL
Cells harboring appropriate plasmids were induced by following sets of inducers: 10^-3 arabinose, 10^-4 salicylate, and 10^-3 arabinose , 10^-4 salicylate along with 10^-6 HSL, and the result was photographed for a visualized view (Figure 12).

Figure 12. GFP expression of B cell. From Left to Right: Cells in first left two EP tubes (left to right) were induced by arabinose, salicylate, cell in third EP tube was induced by arabinose and , salicylate along with AHL, while cells in the fourth tube were left without inducement as a control.
From the results above, we have found that our B cells are always sensitive to HSL. Nevertheless, their behavior seems to be independent of the concentration of arabinose or salicylate, and also show significant basal level of fluorescence, which indicates that the leakage of arabinose or salicylate sensor regulated promoter is significant, and as a result, the basal expression of supD is high enough to work on rescue T7ptag, which is constructively constitutively expressed in the absence of HSL in our circuit.
There are several approaches for possible improvements. According to Anderson’s[1] and our previous team’s work, random mutagenesis on RBS upstream of T7ptag, which determines the activity range of its promoter, could modulate the function of the AND gate. Similar methods may be applied to our B cell, and thus to get an appropriate RBS, the constructive expression level of T7ptag may be lessen, result in less basal level of the whole circuit. Moreover, tuning the copy number of supD would be a more straightforward approach. It is promising to bring down the basal expression of supD by swapping the plasmid containing arabinose and salicylate induced supD from current medium copy number backbone to a lower copy number backbone, e.g. pSB4K5. To construct a new plasmid containing tandem promoters, pBAD and pSal with only one downstream supD may also contribute to potential reduction of supD basal expression.
ASSEMBLY
We have assembled A cell and B cell and tested its behavior by liquid culture assay (Figure 13).

Figure 13. Result of the liquid culture assay. Two strains were inoculated together at t = 0, and grown as co-culture. The picture showed for result of induction with 10^-3 arabinose, 10^-4 salicylate, 10^-3 arabinose and 10^-4 salicylate, blank (top to bottom)
The results were not satisfying. Though showing a XOR gate result, most of the A/B cell assemblies illustrated significant basal level of gfp fluorescent. These circumstances were coherent with the result of cell B mentioned above, which we suppose is due to high basal expression of supD.
This result has can also been be reasonably explained with our XOR gate model. Figure 13 is our simulation result of XOR gate, in which the variables space is extended to cover a sufficiently large range of inputs. Nevertheless, the two inputs in experiment can only vary within a quite limited range which is a sub-region of the I1-I2 space. Rectangular region in Figure 14 represents phase diagram of our present XOR gate module.
Models of XOR gate also indicates that variations in the translation strength can be reflected by changes in the range of arbitrary input. Therefore, lessening the basal expression level of salicylate promoter and random mutagenesis on RBS upstream of T7ptag, may result in shifting of the rectangular region, and get a better XOR gate outcome.

Figure 16. Simulation result of XOR gate. White rectangular illustrates phase diagram of our present XOR gate, and grey one illustrates phase diagram after random mutagenesis and screening, which performed as a XOR gate.
We then designed a random mutagenic library of four positions in the RBS upstream of T7ptag and the resulting library of variants was then screened and primarily characterized by induced with arabinose, salicylate and AHL in 96-well plates. The performance of each individual construct was compared with that of the previous one. There were several candidates that performed quite well (Figure 17). Further characterization need to be done to verify their performance.

Figure 17. Primary characterization result of one promising candidate. Cells in first left two EP tubes (left to right) were induced by arabinose, salicylate, cell in third EP tube was induced by arabinose and , salicylate along with AHL, while cells in the fourth tube were left without inducement as a control.
References
[1] Anderson, J. C., Voigt, C. A. & Arkin, A. P. Environmental signal integration by a modular AND gate. Mol. Syst. Biol. 3, 133 (2007).
[2] Tamsir, A., Tabor, J. J. & Voigt , C. A. Robust multicellular computing using genetically encoded NOR gates and che mical ‘wires’ . Nature. 469, 212-215(2011).
[3] Li, B. & You, L. Division of logic labour. Nature. 469, 171-172(2011).
[4] Danino, T., Palomino, O. M., Tsimring, L. & Hasty, J. A synchronized quorum of genetic clocks. Nature. 463, 326-330(2010).
[5] Regot, S. et al. Nature 469, 207–211 (2011).
 "
"


