Team:Calgary/Notebook/Calendar/Binf
From 2011.igem.org
| (5 intermediate revisions not shown) | |||
| Line 22: | Line 22: | ||
<p>Recently, Dr. Mayi, one of our facilitators, came across an interesting study which analyzed the capacity of bacteria to degrade naphthenic acids. According to the study, both Pseudomonas putida and Pseudomonas fluorescens are capable of degrading small amounts of naphthenic acids, but when put in co-cultures with each other, their capacity increases to 95% elimination. What's more is that this degradation was effective across a broad spectrum of naphthenic acids, including those with one, two, and even three rings. The inference we drew from this effect is that there are some unique genes within each bacteria that, when allowed to interact with each other, are responsible for the degradation of naphthenic acids. In a sense, one bacteria's garbage is another bacteria's treasure. This project's hypothesis is that it is possible to narrow down the candidates for this pathway by using a bioinformatic survey. </p> | <p>Recently, Dr. Mayi, one of our facilitators, came across an interesting study which analyzed the capacity of bacteria to degrade naphthenic acids. According to the study, both Pseudomonas putida and Pseudomonas fluorescens are capable of degrading small amounts of naphthenic acids, but when put in co-cultures with each other, their capacity increases to 95% elimination. What's more is that this degradation was effective across a broad spectrum of naphthenic acids, including those with one, two, and even three rings. The inference we drew from this effect is that there are some unique genes within each bacteria that, when allowed to interact with each other, are responsible for the degradation of naphthenic acids. In a sense, one bacteria's garbage is another bacteria's treasure. This project's hypothesis is that it is possible to narrow down the candidates for this pathway by using a bioinformatic survey. </p> | ||
| - | |||
<h3>Original Strategy for the Bioinformatic Survey</h3> | <h3>Original Strategy for the Bioinformatic Survey</h3> | ||
<h4> Author: Stephen</h4> | <h4> Author: Stephen</h4> | ||
| Line 28: | Line 27: | ||
<p> The goal of the bioinformatic survey is to provide leads to the experimental side (or wet lab) of the project. Two assumptions were made at the beginning of the survey. The first is that the two genomes are homologous enough to eliminate a substantial portion of each genome from consideration. The other assumption is that the gene of interest is located within the non-homologous regions of the either genome. If both assumptions are correct, then it should be possible to create a short list of candidate genes involved in the degradation pathway, for investigation in the wet lab. Knowing what genes are involved in the degradation means that wet lab can simply look upstream for a naphthenic acid promoter.<p> | <p> The goal of the bioinformatic survey is to provide leads to the experimental side (or wet lab) of the project. Two assumptions were made at the beginning of the survey. The first is that the two genomes are homologous enough to eliminate a substantial portion of each genome from consideration. The other assumption is that the gene of interest is located within the non-homologous regions of the either genome. If both assumptions are correct, then it should be possible to create a short list of candidate genes involved in the degradation pathway, for investigation in the wet lab. Knowing what genes are involved in the degradation means that wet lab can simply look upstream for a naphthenic acid promoter.<p> | ||
| - | |||
<h3>June 27- July 1, 2011</h3> | <h3>June 27- July 1, 2011</h3> | ||
<h4> Author: Stephen</h4> | <h4> Author: Stephen</h4> | ||
| Line 39: | Line 37: | ||
| - | |||
<h3> July 4-8, 2011</h3> | <h3> July 4-8, 2011</h3> | ||
<h4> Author: Stephen</h4> | <h4> Author: Stephen</h4> | ||
| Line 46: | Line 43: | ||
| - | |||
<h3> July 11-15, 2011</h3> | <h3> July 11-15, 2011</h3> | ||
<h4> Author: Stephen</h4> | <h4> Author: Stephen</h4> | ||
| Line 55: | Line 51: | ||
| - | |||
<h3> July 16-22, 2011</h3> | <h3> July 16-22, 2011</h3> | ||
<h4> Author: Stephen</h4> | <h4> Author: Stephen</h4> | ||
| Line 61: | Line 56: | ||
<p> David, our TA, went through the catalogue of species and added additional notes to some species. Patrick and Stephen spent most of the week preparing for the aGEM Conference.</p> | <p> David, our TA, went through the catalogue of species and added additional notes to some species. Patrick and Stephen spent most of the week preparing for the aGEM Conference.</p> | ||
| - | |||
| - | |||
<h3> July 23-29, 2011</h3> | <h3> July 23-29, 2011</h3> | ||
<h4> Author: Stephen</h4> | <h4> Author: Stephen</h4> | ||
| Line 73: | Line 66: | ||
| - | |||
<h3>July 29-August 4, 2011</h3> | <h3>July 29-August 4, 2011</h3> | ||
<h4>Author: Stephen</h4> | <h4>Author: Stephen</h4> | ||
| Line 86: | Line 78: | ||
| - | |||
<h3>July 29-August 4, 2011</h3> | <h3>July 29-August 4, 2011</h3> | ||
<h4>Author: Patrick</h4> | <h4>Author: Patrick</h4> | ||
| Line 100: | Line 91: | ||
| - | |||
<h3>August 12-18, 2011</h3> | <h3>August 12-18, 2011</h3> | ||
<h4>Author: Patrick</h4> | <h4>Author: Patrick</h4> | ||
| Line 107: | Line 97: | ||
</p> | </p> | ||
| - | |||
<h3>August 12-18, 2011</h3> | <h3>August 12-18, 2011</h3> | ||
<h4> Author: Stephen</h4> | <h4> Author: Stephen</h4> | ||
| Line 126: | Line 115: | ||
| - | |||
<h3>August 19-25, 2011</h3> | <h3>August 19-25, 2011</h3> | ||
<h4>Author: Stephen</h4> | <h4>Author: Stephen</h4> | ||
| Line 139: | Line 127: | ||
| - | |||
<h3> August 26-September 2nd, 2011</h3> | <h3> August 26-September 2nd, 2011</h3> | ||
<h4> Author: Stephen</h4> | <h4> Author: Stephen</h4> | ||
| Line 152: | Line 139: | ||
| - | </html>[[image:Calgary2011_FIg_M.1.jpg |thumb|280px|left|<p><b>Figure 1 | + | </html>[[image:Calgary2011_FIg_M.1.jpg |thumb|280px|left|<p><b>Figure 1.</b> 16S-RNA Melt curve</p>]]<html> |
| - | </html>[[image:Calgary2011_Fig_M.2.jpg |thumb|280px|right|<p><b>Figure 2 | + | </html>[[image:Calgary2011_Fig_M.2.jpg |thumb|280px|right|<p><b>Figure 2.</b> LysR1 melt curve</p>]]<html> |
| - | + | ||
| - | + | ||
<p>We decided to perform primer optimization with conventional PCR altering the ratios of Fw to Rv primer to try to amplify the product more efficiently.</p> | <p>We decided to perform primer optimization with conventional PCR altering the ratios of Fw to Rv primer to try to amplify the product more efficiently.</p> | ||
| Line 164: | Line 149: | ||
<p>Again, the only significant product was from the16S-RNA gene and the others failed to PCR.</p> | <p>Again, the only significant product was from the16S-RNA gene and the others failed to PCR.</p> | ||
| - | |||
| - | |||
<h3>September 13, 2011</h3> | <h3>September 13, 2011</h3> | ||
<h4>Author: Stephen Dixon</h4> | <h4>Author: Stephen Dixon</h4> | ||
<p> After meeting with the iGEM team to discuss administrative details, I ran into Peter Qi and we did some additional bioinformatics using the Pseudomonas.com database. The database offers a comparative search between putida and fluorescens with which we obtained a new list. Peter and I, as a pair, went through the list and short-listed some more genes to test, in case the ones from the Dark Horse database failed. One of the most fascinating candidates was annotated as "glyoxalase/bleomycin resistance protein/dioxygenase"; when BLAST'ed, it turned out to be related to a gene involved in Ring Cleavage!</p> | <p> After meeting with the iGEM team to discuss administrative details, I ran into Peter Qi and we did some additional bioinformatics using the Pseudomonas.com database. The database offers a comparative search between putida and fluorescens with which we obtained a new list. Peter and I, as a pair, went through the list and short-listed some more genes to test, in case the ones from the Dark Horse database failed. One of the most fascinating candidates was annotated as "glyoxalase/bleomycin resistance protein/dioxygenase"; when BLAST'ed, it turned out to be related to a gene involved in Ring Cleavage!</p> | ||
| - | |||
| - | |||
| - | |||
| Line 217: | Line 197: | ||
<br></br> | <br></br> | ||
| - | </html>[[image:Calgary2011_Fig_M.3.jpg|thumb|280px|left|<p><b>Figure 3 | + | </html>[[image:Calgary2011_Fig_M.3.jpg|thumb|280px|left|<p><b>Figure 3.</b> RT-PCR Amplification using ECH primer set with LD2 cDNA.</p>]]<html> |
| - | </html>[[image:Calgary2011_Fig_M.4.jpg|thumb|280px|right|<p><b>Figure 4 | + | </html>[[image:Calgary2011_Fig_M.4.jpg|thumb|280px|right|<p><b>Figure 4.</b> Corresponding RT-PCR Melt Curve</p>]]<html> |
<br></br> | <br></br> | ||
<p>Further characterization of newly synthesized cDNA demonstrated the linear range at which the primers worked. cDNA was synthesized for all treatments (with and without NA treatment), and qRT-PCR was performed to test whether there was an increase in amplification between NA treated cells and cells not treated with NAs. </p> | <p>Further characterization of newly synthesized cDNA demonstrated the linear range at which the primers worked. cDNA was synthesized for all treatments (with and without NA treatment), and qRT-PCR was performed to test whether there was an increase in amplification between NA treated cells and cells not treated with NAs. </p> | ||
| - | <p>To obtain the values from Figure 5, 16S-DNA Ct values were subtracted from ECH Ct values for the same treatment. The standard Relative Quantitation formula was then applied to the ΔCt values, in which the Ct value is an exponent of 2.</p> | + | <p>To obtain the values from Figure 5, 16S-DNA Ct values were subtracted from ECH Ct values for the same treatment. The standard Relative Quantitation formula was then applied to the ΔCt values, in which the Ct value is an exponent of 2 (http://www.ambion.com/techlib/basics/rtpcr/index.html).</p> |
| - | </html>[[image:Calgary2011_Fig_M.5.jpg |thumb|300px|center|<b>Figure 5 | + | </html>[[image:Calgary2011_Fig_M.5.jpg |thumb|300px|center|<p><b>Figure 5.</b> Transcription levels of Enoyl CoA Hydatase upon exposure to Naphthenic acids, after normalization to control.</p>]]<html> |
<p>Further experiments are needed to confirm whether this difference is consistent, as well as whether this is a general stress response.</p> | <p>Further experiments are needed to confirm whether this difference is consistent, as well as whether this is a general stress response.</p> | ||
| Line 234: | Line 214: | ||
<h4>Author: Margaret </h4> | <h4>Author: Margaret </h4> | ||
| - | <p>To | + | <p>To test whether I could duplicate previous results that implied that the gene ECH was amplified in cells treated with Naphthenic acids, RNA extraction was performed from strain LD2 in untreated cells, cells treated with 40mg/L, 80mg/L and 160mg/L of NA, as well as cells treated with 1mM hydrogen peroxide. The purpose of hydrogen peroxide was to stress the cells with a characterized stress inducing agent, to determine if up-regulation of enoyl-CoA is attributable to a general stress response. Unfortunately, the amount of RNA extracted to perform the experiment was insufficient, so confirmation of enoyl-CoA upregulation upon NA treatment will need to occur at a later date.</p> |
| + | |||
| + | <h3>Oct 12th to Oct 14th, 2011</h3> | ||
| + | <h4>Author: Peter Qi and Margaret Renaud-Young</h4> | ||
| + | <h4>Summary of Activities: </h4> | ||
| + | <p>Treatment of Pseudomonas LD2 in stress conditions (1 mM H2O2), cyclohexane pentanoic acid (a naphthenic acid/NA) (80mg/L), decanoic acid (a fatty acid/FA) (80mg/L in ethanol), and control (no treatment, water only).</p> | ||
| + | <p>Isolations of RNA from four Pseudomonas LD2 cultures/treatment groups, 2*108 cells (1 OD= 2*108 cells/mL). This is a repeat from previous RNA isolations, which did not work likely because of low cell concentrations, insufficient lysis of cells before RNA extraction. No RNA was isolated from the H2O2 culture, as the culture did not grow. The isolated RNA was not DNAse treated or run through the genomic DNA grab columns. The samples were treated with DNAse the following week (see next entry), the gel below shows RNA samples without DNAse treatment:</p> | ||
| + | |||
| + | |||
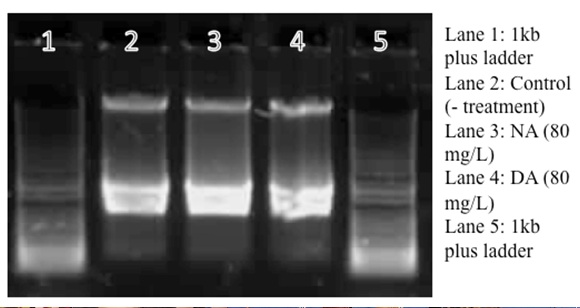
| + | </html>[[image:UCALGARY_2011_Peter_1.jpg |thumb|500px|center|<p><b>Figure 6.</b> 0.8% Agarose Gel run at 110V for 15 minutes for RNA preps (not DNAse treated) from Pseudomonas LD2 treated with napthenic acid/cyclohexane pentanoic acid (80mg/L), decanoic acid (80mg/L), and no treatment (control).</p>]]<html> | ||
| + | |||
| + | |||
| + | <p>The 5kb bands indicates DNA contamination. The isolated RNA (not treated by DNAse) is reverse transcrited using Quanta RT kit. The reverse transcribed product is serially diluted for the RT-PCR. The RNA samples were treated with DNAse the following week, and the PCR results are identical (see next entry).</p> | ||
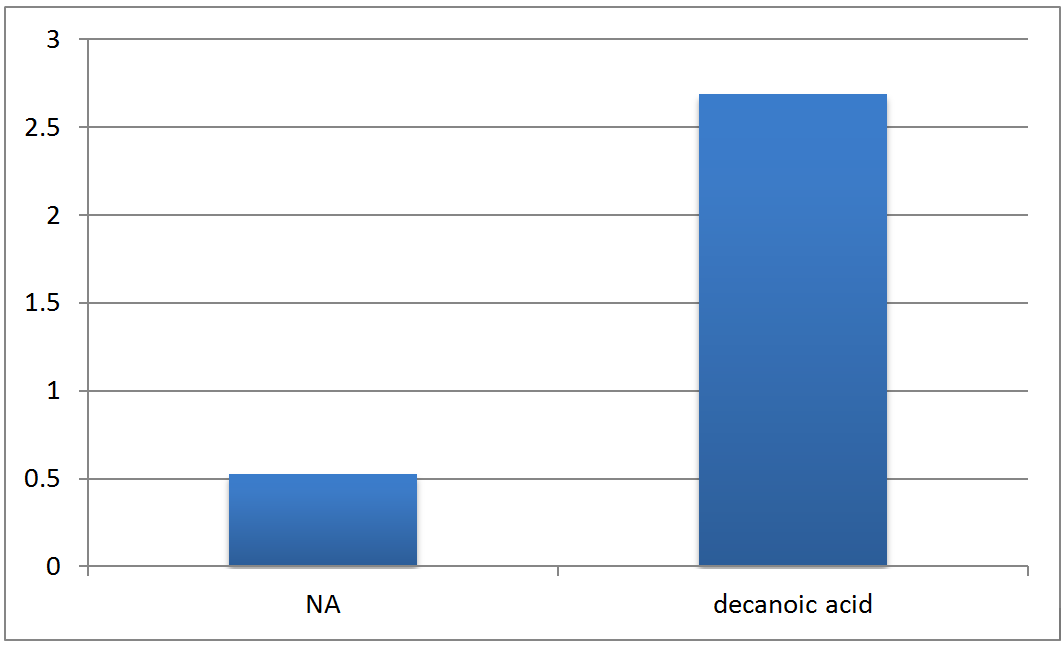
| + | <p>Real time PCR experiment measuring enoyl CoA hydrotase (ECH) gene expression relative to 16s rDNA expressions, and compare across control (no treatment), NA treated, and decanoic acid treated groups. See previous entry for calculation methods. A mistake was found in the previous calculations of gene expression levels, which reversed the trends (i.e. an upregulation in expression calculated before is actually a down-regulation). Corrected calculations show a down-regulation of ECH in response to NA, and a up-regulation of ECH when exposed to the FA, compared to the control group.</p> | ||
| + | |||
| + | </html>[[image:UCALGARY2011Peter_2.png |thumb|500px|center|<p><b>Figure 7.</b> Relative Quantitation of Fad-2 Transcript upon exposure to naphthenic acids and decanoic acid after normalization to control.</p>]]<html> | ||
| + | |||
| + | |||
| + | <h3>Oct 17th to 21st, 2011</h3> | ||
| + | <h4>Author: Peter Qi and Margaret Renaud-Young</h4> | ||
| + | <h4>Summary of Activities: </h4> | ||
| + | <p>Fresh total RNA is extracted from the same four treatment groups as before, with the addition of cinnamic acid/CA treatment (CA is a known substrate of ECH). DNA (genomic and plasmid) is removed from the RNA extractions using RNAse free DNAse kits, instead of the genomic DNA trap columns used before. RNA treated with DNAss and untreated RNA samples are run on a 0.8% agarose gel for 15 minutes, yielding the following results:</p> | ||
| + | |||
| + | </html>[[image:UCALGARY2011Peter_3.png |thumb|500px|center|<p><b>Figure 8.</b> 0.8% Agarose Gel run at 110V for 15 minutes for RNA preps (DNAse treated) from Pseudomonas LD2 treated with cinnamic acid (80mg/L), napthenic acid/cyclohexane pentanoic acid (80mg/L), decanoic acid (80mg/L), H2O2 (1mM) and no treatment (control), and RNA preps from Oct 13, 2011 (Lane 7-9).</p>]]<html> | ||
| + | |||
| + | |||
| + | <p>The RT-PCR yielded the following results: </p> | ||
| + | |||
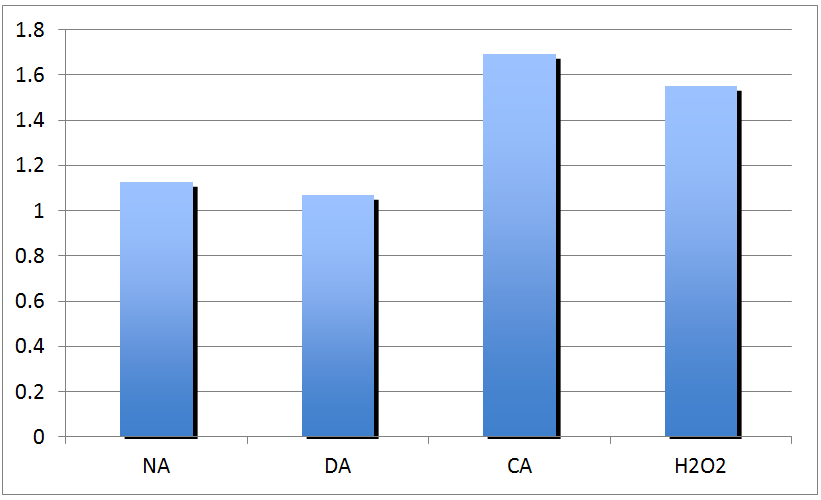
| + | </html>[[image:UCALGARY2011Peter_4.png |thumb|500px|center|<p><b>Figure 9.</b> Relative Quantitation of Fad-2 Transcript upon exposure to naphthenic acids, decanoic acid, cinnamic acid, and H2O2 after normalization to control.</p>]]<html> | ||
| + | |||
| + | |||
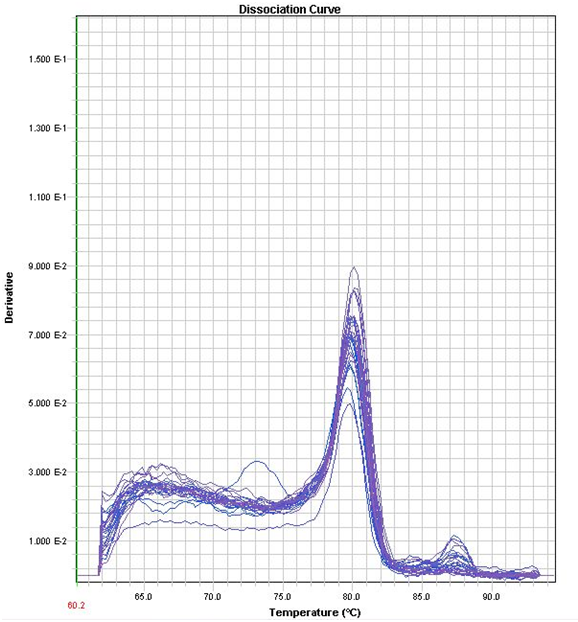
| + | </html>[[image:UCALGARY2011Peter_5.png |thumb|500px|center|<p><b>Figure 10.</b> Corresponding RT-PCR Melt Curve to Figure 9.</p>]]<html> | ||
| + | |||
| + | |||
| + | <p>The results are not as expected, as ECH expression is not upregulated in response to NA exposure, but instead upregulated in response to H2O2 and cinnamic acid treatment. The response to cinnamic acid is expected, since it is a natural substrate, but the response to hydrogen peroxide may indicate that the gene may be a general stress response gene, which requires further investigation to clarify.</p> | ||
| + | <h3>Oct 24th to 28th, 2011</h3> | ||
| + | <h4>Author: Peter Qi and Margaret Renaud-Young</h4> | ||
| + | <h4>Summary of Activities:</h4> | ||
| + | <p>It was noticed last week that napthenic acids do not dissolve in water very well, and may not be homogenously mixed into culture. Also, it was discovered that ethanol may cause a general stress response, as it is observed in E coli. Thus, all treatments are now dissolved in ethanol before exposing to culture, and the control contains 5 uL of 95% ethanol. RNA is again isolated from the treated cultures using revised protocols as per last week. The RNA is run on agarose gel for confirmation, see gel below:</p> | ||
| + | |||
| + | </html>[[image:UCALGARY2011Peter_6.png |thumb|500px|center|<p><b>Figure 11.</b> 0.8% Agarose Gel run at 110V for 15 minutes for RNA preps (DNAse treated) from Pseudomonas LD2 treated with cinnamic acid (80mg/L), napthenic acid/cyclohexane pentanoic acid (80mg/L), decanoic acid (80mg/L), H2O2 (1mM) and no treatment (control). All samples were DNAse treated.</p>]]<html> | ||
| + | |||
| + | |||
| + | <p>Serial dilutions of reversed transcribed products (from isolated RNA) is run on RT-PCR plates, for gene expression of ECH, and 16s rDNA. The following results are obtained:</p> | ||
| + | |||
| + | </html>[[image:UCALGARY2011Peter_7.png |thumb|500px|center|<p><b>Figure 12.</b> Relative Quantitation of Fad-2 Transcript upon exposure to naphthenic acids (dissolved in water or ethanol), decanoic acid, cinnamic acid, and H2O2 after normalization to control.</p>]]<html> | ||
| + | |||
| + | |||
| + | |||
| + | <a name="RTPCR"></a> | ||
| + | |||
| + | </html>[[image:UCALGARY2011Peter_8.png |thumb|500px|center|<p><b>Figure 12.</b> Corresponding RT-PCR Melt Curve to Figure 12</p>]]<html> | ||
| + | |||
| + | |||
| + | <p>The results are relative consistent with last week, except that the ECH is no longer upregulated by H2O2, and ECH expression in the hydrogen peroxide treatment is lower than that of NA treatment. However, no difference in gene expression is observed between FA and NA treatment, which suggests the response of ECH expression may not be specific to NA exposure.</p> | ||
| + | |||
| + | |||
| + | |||
<style> | <style> | ||
#titlebar{margin-top: -6px;} | #titlebar{margin-top: -6px;} | ||
Latest revision as of 03:58, 29 October 2011





Bioinformatic Survey

Project Participants
Stephen, David, Maggie, Patrick
Project Background
Author: Stephen
Recently, Dr. Mayi, one of our facilitators, came across an interesting study which analyzed the capacity of bacteria to degrade naphthenic acids. According to the study, both Pseudomonas putida and Pseudomonas fluorescens are capable of degrading small amounts of naphthenic acids, but when put in co-cultures with each other, their capacity increases to 95% elimination. What's more is that this degradation was effective across a broad spectrum of naphthenic acids, including those with one, two, and even three rings. The inference we drew from this effect is that there are some unique genes within each bacteria that, when allowed to interact with each other, are responsible for the degradation of naphthenic acids. In a sense, one bacteria's garbage is another bacteria's treasure. This project's hypothesis is that it is possible to narrow down the candidates for this pathway by using a bioinformatic survey.
Original Strategy for the Bioinformatic Survey
Author: Stephen
The goal of the bioinformatic survey is to provide leads to the experimental side (or wet lab) of the project. Two assumptions were made at the beginning of the survey. The first is that the two genomes are homologous enough to eliminate a substantial portion of each genome from consideration. The other assumption is that the gene of interest is located within the non-homologous regions of the either genome. If both assumptions are correct, then it should be possible to create a short list of candidate genes involved in the degradation pathway, for investigation in the wet lab. Knowing what genes are involved in the degradation means that wet lab can simply look upstream for a naphthenic acid promoter.
June 27- July 1, 2011
Author: Stephen
My initial thinking is that both genomes consist of two parts: parts that have a homology to the other genome, and parts that don't. Eliminating the parts that do by definition would immediately reveal the parts that aren't. Since homology tends to be between similar sequences rather than exact matches, a statistical approach could be used that determines homology based on the significance of the finding.
Patrick Wu, my colleague, started off by looking for software that we could reuse for our application. DNA manipulation is sufficicently complicated enough that it makes no sense to reinvent the wheel; after some digging around, he found an open-source DNA alignment tool called MUMmer. MUMmer uses a suffix tree (a type of data structure) that works in O(n) time to rapidly align whole genomes; in the process, MUMmer provides information on single nucleotide changes, translocations, and homologous/similar genes.
Currently, we are looking into how MUMmer can be used to compare the homology of the genomes. If it turns out that the homology is not significant enough, then some other criteria must be used to narrow down the list of unique genes.
July 4-8, 2011
Author: Stephen
This week, Patrick went back to working on the Wiki, and I started to develop software for performing the big computation. We finished working with MUMmer once we realized that it offered no means of finding unique genes, and because it had already verified a significant level of homology existed between LD1 and LD2. My hope was to develop an original application based on several modules, which would process the entire genome. Module 1 would read and transcribe each of the genes in the entire genome. Module 2 would "compare the genes" and eliminate similar genes, and Module 3 would get the identity of each gene and sort them in some relevant order. However, my program for discarding junk DNA in Module 1 was not working as well as I had hoped; it identified over 150 genes in Mumps Virus, when there is only 7 according to BLAST. In the process of developing this software, I learned more about evolution and homology, horizontal gene transfer, the nitty-gritty details of transcription, and about codon tables.
July 11-15, 2011
Author: Stephen
This week, I realized that any organism with a sufficient number of genes that were horizontally transferred would, by definition, have genes that are non-homologous to other species within the same genus. Therefore, one way to find the naphthenic acid promoter is to look for genes which are horizontally transferred; horizontal transfer is a process by which bacteria share genetic information with dissimilar species.
In the process of looking up how to identify such a gene, I encountered a wonderful program called Dark Horse, which uses an algorithm for finding phylogenetically atypical proteins among bacterial strains on a genome-wide basis - that is, proteins which are likely to have been horizontally transferred. So I looked up all strains of Pseudomonas putida (F1, GB1, KT2440, and W619) and fluorescens (Pf5 and Pf01) on the database, and instantly obtained a list of 200 such genes. Unfortunately, we know not what the exact sequence of the strains used in the Del Rio paper were, but we are hopeful that there is enough similarity to the species in the database that they will share the horizontal genes. We are now cataloguing the bacterial species in this list, in order to create a comprehensive list of genes to test in the lab. What is really interesting about this is that, assuming that Del Rio's bacteria are similar to the ones in the database, we may already be sitting on the answer.
July 16-22, 2011
Author: Stephen
David, our TA, went through the catalogue of species and added additional notes to some species. Patrick and Stephen spent most of the week preparing for the aGEM Conference.
July 23-29, 2011
Author: Stephen
This week we finally finished cataloguing the interesting results from the Dark Horse results. We also discovered ProteinWorld HB, an online web tool which searches for unique genes between two species. However, we found no genes were listed in both lists. On Friday, we discovered that Pseudomonas.com also offers a comparative genome search, and a list of annotated genes in each genome. We look forward to comparing the list of annotated genes to the Dark Horse and Protein World results.
We looked also at GenomeBlast, which claims to find unique genes between species; however, we were not successful in obtaining the program's output. The authors of GenomeBlast suggested by email that the problem may have arisen due to the size of the genomes we were trying to process.
Also, we emailed Dr Mayi about how our results can be verified in the wet lab.
July 29-August 4, 2011
Author: Stephen
This week was short, because Monday was a civic holiday.
Since Dr Mayi said that we could experimentally verify some of our results, the main focus this week has been on selecting around 5 or 6 genes that are responsive to naphthenic acids. We want genes which turn on as a response to NAs, and genes that are inactive when there are no NAs present. We continue to think about that the identity of the strains of LD1 (Pseudomonas putida) and LD2 (Pseudomonas fluorescens) remains unknown.
We also discovered that pseudomonas.com has a pre-computed gene comparison search, which allows you to look for genes in one group of species/strains which are not present in another list. We have the results from this list as well, but we are using it as a reference for what genes are actually present.
On Wednesday and Thursday, we BLASTed each of the interesting genes we found on our Dark Horse and ProteinWorld results, to learn more about them. We eliminated or "nominated" genes based on their supposed relevance to fatty acid degradation pathways, and how relevant they could be to naphthenic acid degradation. We also noted when a particular genes appeared to have conserved domains, but looked substantially different than other genes with a similar function. Using these standards, we short-listed our gene list to about six genes. Our final list includes a handful of transcription factors (such as GI 58003974), Enoyl-CoA hydratase, and LysR family proteins. Next week, we intend to experimentally verify whether the gene products of these sequences are affected by naphthenic acid presence.
July 29-August 4, 2011
Author: Patrick
This week I looked into results from the Dark Horse and ProteinWorldDB results in an attempt to find proteins of particular interest. A handful of transcription factors appear to be of interest. P. putida GB-1 offers a hypothetical protein that most closely aligns with a transcription factor (GI 58003974). As well, lysR family proteins appear to be promising because of their transcription regulation properties. Enoyl-CoA hydratases seem to be part of fatty acid degradation pathways, so it may be a good protein to pursue as well.
August 5-12, 2011
Author: Stephen
This week we continued to sift through the gene lists and started to plan out how we could verify that the genes are responsive to naphthenic acids. Our plan is to perform a quantative RT-PCR on two samples of bacteria, one treated by naphthenic acid and one that is not. We plan to find out whether the selected genes are up-regulated in response to naphthenic acids. On Monday, I read about RT-PCR, and how naphthenic and fatty acids are believed to be degraded. On Tuesday, I slept the entire day, which helped me recover from oral surgery. On Wednesday, I wanted to know if enoyl CoA hydratase would be worth keeping on the list, but I failed to eliminate it conclusively; I later found out from David that other enoyl genes were involved in the degradation of caffeic acid. On thursday, I continued going through the list and eliminated genes from Synnecochus, Gloebacter, and thermobifida.
August 12-18, 2011
Author: Patrick
This week I was primarily working on primer design for the RT-PCR, and learning about the process. I also gathered names for the formation of an iGEM club for the upcoming Fall and Winter semesters and submitted the forms to the Students' Union. I have also been writing out thank-you letters to our sponsors and donators and filling out the SEEL application form for funding in the future.
August 12-18, 2011
Author: Stephen
This week, I asked Patrick to help me design some primers. Much of the week was spent learning how to design primers, discussing what characteristics we wanted the primers to have, and designing the primers using Primer3 and PrimerBlast. The criteria we wanted our primers to have were:
- Melting Temperature: 70-74°C (optimally 72°C)
- Primer Length: 22-24 (optimally 24)
- Product Length: 150-250 base pairs (optimally 200)
- No runs of 4 or more of the same nucleotide letter in either the forward or reverse primer.
- The primers have a GC clamp at the end (ie. end with G, C, GC, or CG)
- The last 5 nucleotides contain 3 or 4 GC's.
- GC Content between 40-60% (optimally 50%)
- All unintentional matches calculated from Primer Blast are at least 25% mismatched.
I also learned that the melting point in the PCR machine is the maximum melting temperature for the primers. This was important because the constitutively expressed gene we found in a paper by Martínez-Lavanchy et. al. (2010), 16s rRNA, had a shorter primer length than the other primers we had designed. If we make it any longer, then the primer may no longer be genus-specific, which makes it less useful as a RT-PCR control. I had originally noticed this after I had already made all the primers, but I decided it was okay and the only downside was that the producer/primer length is not perfectly controlled.
August 19-25, 2011
Author: Stephen
This week, I got involved in planning out the RT-PCR experiment, learned how analyze the data, and mapped out the plate. I also designed BioBrickable Primers for the promoter regions of each of the genes in our short list from Dark Horse.
The first graph I learned how to analyze was the plot of the Optical Density vs. the Cycle Number. If a gene is transcribed in response to naphthenic acids, then we'd expect the initial mRNA concentrations to be higher before it is reverse transcribed back into DNA. Therefore, when we perform the PCR, the population will grow faster because it will be at an earlier stage. The difference in the number of cycles it takes between the control and treated samples to pass a specific threshold is indicative of the initial population. After normalizing the difference between the cycles which passed the threshold, we can statistically determine whether a particular gene is transcribed as a naphthenic acid response, or that it was just total luck. I learned how to analyze a second graph which shows two raised to the fold increase over the control.
The third graph I learned to analyze was the standard curve between the log of the template number and the cycle number. The better the linear regression coefficient R, the more ideal the PCR behaved.
In regards to the RT-PCR, it seems to work in approximately five steps: the culturing step, the RNA extraction step, the DNAse step, the reverse transcription step, and finally the qPCR step. Lastly, designing BioBrickable Primers is the same as designing normal primers, except for the insertion of the BioBrickable Suffix and Prefix.
August 26-September 2nd, 2011
Author: Stephen
The RT-PCR experiment was delayed because the cells did not grow properly. Robert told me that the cell media was at fault, so he made a new stock solution. I created a list of transcription factors shared in strains of fluorescens not found in putida. I also learned what a sigma factor is. I also learned about the genomic dissimilarity of different strains of Pseudomonas fluorescens from Silby 2006 et. al., which at the amino acid identity level can be lower than the similarity between different species within the same genus. Nevertheless, the strains of fluorescens are more similar to each other than any other species.
September 3- 9
Author: Margaret
RNA extraction was performed with strains LD1 and LD2 treated with 80mg/L of NA in LB media, as well as control treatments of LB media alone.
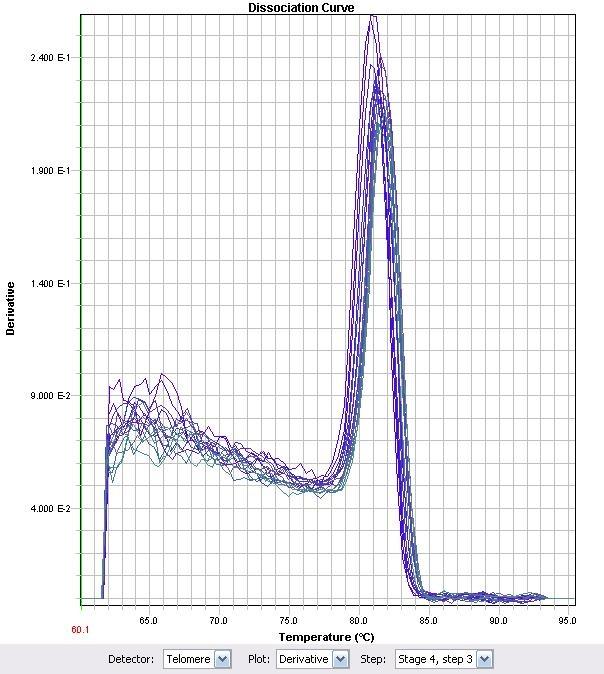
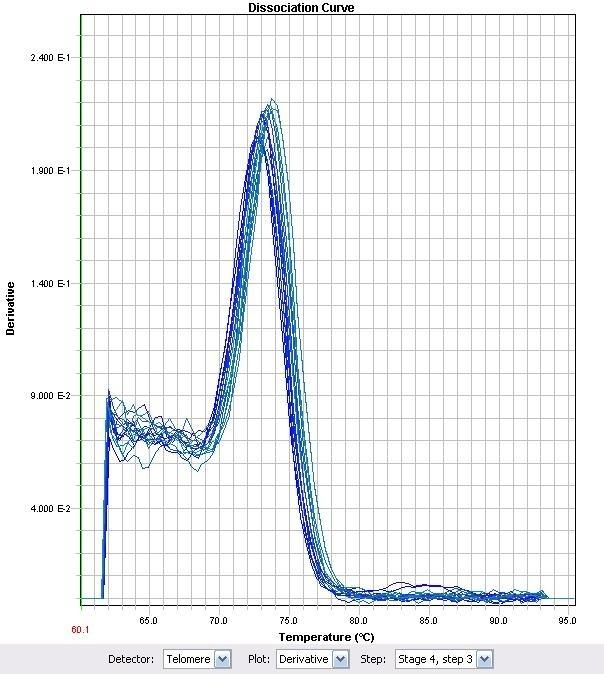
Only the control RNA primers, 16S-RNA, showed PCR amplification proportional to RNA concentration. The remaining primers either failed to PCR anything or in the case of LysR1, showed a false positive, wherebye primers amplified a single product that did not proportionately change with DNA concentration.
We decided to perform primer optimization with conventional PCR altering the ratios of Fw to Rv primer to try to amplify the product more efficiently.
Robert’s gel: If necessary, it is somewhere in the ether.
Again, the only significant product was from the16S-RNA gene and the others failed to PCR.
September 13, 2011
Author: Stephen Dixon
After meeting with the iGEM team to discuss administrative details, I ran into Peter Qi and we did some additional bioinformatics using the Pseudomonas.com database. The database offers a comparative search between putida and fluorescens with which we obtained a new list. Peter and I, as a pair, went through the list and short-listed some more genes to test, in case the ones from the Dark Horse database failed. One of the most fascinating candidates was annotated as "glyoxalase/bleomycin resistance protein/dioxygenase"; when BLAST'ed, it turned out to be related to a gene involved in Ring Cleavage!
September 10-16
Author: Margaret
New primers were designed using Primer Express software. Also some new candidates were added to the list, as well as another control gene whose sequence was previously published.
| Gene Name | Function | Fw Primer | Rv Primer | Melting Temp |
|---|---|---|---|---|
| XRE family | Transcription factor | AGTGCGTTCGCCAAGTTGA | AGTTCCCAATCCTGCAACGT | 59 & 58 |
| Acyl-CoA | Acyl-CoA synthetase | CCCGTTTGGCAAGTGATCTAG | GCAACGCAGGCCAGCTT | 58 & 60 |
| Lys R 1 | Transcriptional Regulator | CCTGCTGGTGGTGCTTGAT | CCGTGCGGGTGACATGT | 58 & 58 |
| LysR2 | Transcriptional Regulator | TGCGCGCCCTTGAGAA | GCGTGTACTGCGGGCAAT | 60 & 59 |
| ECH | enoyl-CoA hydratase | GGCCTGTTTTGCCGACAT | GCAGGTAACGCCGAACGA | 58 & 59 |
| Glyoxalase 1 | dioxygenase | GTGAACGCTTCTACGTCGATGT | TCCTCATTGGCGCGATTC | 58 & 59 | Glyoxalase 2 | dioxygenase | CGATATCCAGGCCGAATACAC | TTGGTGGCCGGATGAACT | 58 & 58 |
| Lppl | lipoprotein | CCAGAAAGGCCCGCTGTAT | GTGTGCGCTTTGCCGTTAT | 59 & 58 |
| OsmE | DNA binding transcriptional activator | GCAACGACTACATCCTCAACCA | GCATCGAAGCGCACGTAATA | 59 & 59 |
September 17-23
Author: Margaret
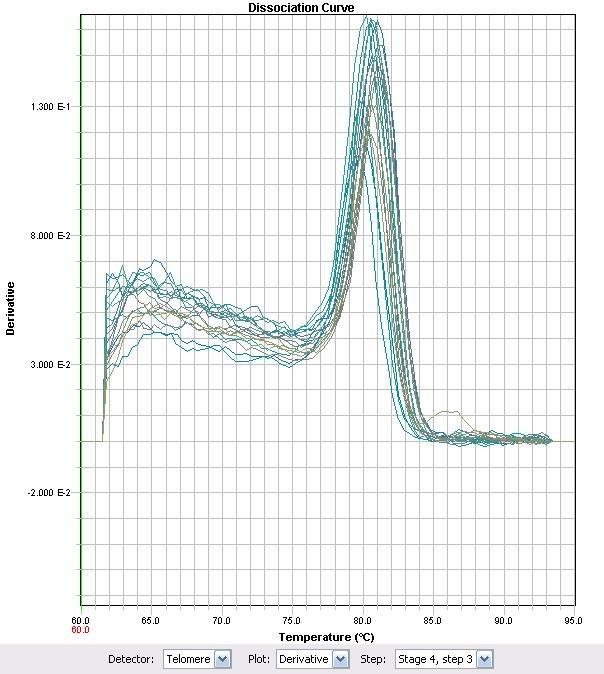
In an effort to characterize the primers, RT-PCR was used with some of the previously synthesized cDNA. The primer set ECH (Enoyl-CoA Hydratase) demonstrated that the Ct values proportionately changed with different cDNA levels of the strain LD2.
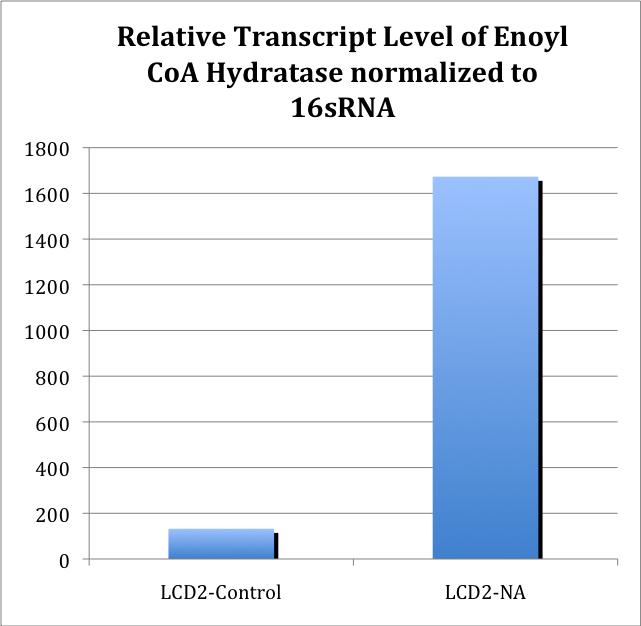
Further characterization of newly synthesized cDNA demonstrated the linear range at which the primers worked. cDNA was synthesized for all treatments (with and without NA treatment), and qRT-PCR was performed to test whether there was an increase in amplification between NA treated cells and cells not treated with NAs.
To obtain the values from Figure 5, 16S-DNA Ct values were subtracted from ECH Ct values for the same treatment. The standard Relative Quantitation formula was then applied to the ΔCt values, in which the Ct value is an exponent of 2 (http://www.ambion.com/techlib/basics/rtpcr/index.html).
Further experiments are needed to confirm whether this difference is consistent, as well as whether this is a general stress response.
September 24-28
Author: Margaret
To test whether I could duplicate previous results that implied that the gene ECH was amplified in cells treated with Naphthenic acids, RNA extraction was performed from strain LD2 in untreated cells, cells treated with 40mg/L, 80mg/L and 160mg/L of NA, as well as cells treated with 1mM hydrogen peroxide. The purpose of hydrogen peroxide was to stress the cells with a characterized stress inducing agent, to determine if up-regulation of enoyl-CoA is attributable to a general stress response. Unfortunately, the amount of RNA extracted to perform the experiment was insufficient, so confirmation of enoyl-CoA upregulation upon NA treatment will need to occur at a later date.
Oct 12th to Oct 14th, 2011
Author: Peter Qi and Margaret Renaud-Young
Summary of Activities:
Treatment of Pseudomonas LD2 in stress conditions (1 mM H2O2), cyclohexane pentanoic acid (a naphthenic acid/NA) (80mg/L), decanoic acid (a fatty acid/FA) (80mg/L in ethanol), and control (no treatment, water only).
Isolations of RNA from four Pseudomonas LD2 cultures/treatment groups, 2*108 cells (1 OD= 2*108 cells/mL). This is a repeat from previous RNA isolations, which did not work likely because of low cell concentrations, insufficient lysis of cells before RNA extraction. No RNA was isolated from the H2O2 culture, as the culture did not grow. The isolated RNA was not DNAse treated or run through the genomic DNA grab columns. The samples were treated with DNAse the following week (see next entry), the gel below shows RNA samples without DNAse treatment:
The 5kb bands indicates DNA contamination. The isolated RNA (not treated by DNAse) is reverse transcrited using Quanta RT kit. The reverse transcribed product is serially diluted for the RT-PCR. The RNA samples were treated with DNAse the following week, and the PCR results are identical (see next entry).
Real time PCR experiment measuring enoyl CoA hydrotase (ECH) gene expression relative to 16s rDNA expressions, and compare across control (no treatment), NA treated, and decanoic acid treated groups. See previous entry for calculation methods. A mistake was found in the previous calculations of gene expression levels, which reversed the trends (i.e. an upregulation in expression calculated before is actually a down-regulation). Corrected calculations show a down-regulation of ECH in response to NA, and a up-regulation of ECH when exposed to the FA, compared to the control group.
Oct 17th to 21st, 2011
Author: Peter Qi and Margaret Renaud-Young
Summary of Activities:
Fresh total RNA is extracted from the same four treatment groups as before, with the addition of cinnamic acid/CA treatment (CA is a known substrate of ECH). DNA (genomic and plasmid) is removed from the RNA extractions using RNAse free DNAse kits, instead of the genomic DNA trap columns used before. RNA treated with DNAss and untreated RNA samples are run on a 0.8% agarose gel for 15 minutes, yielding the following results:
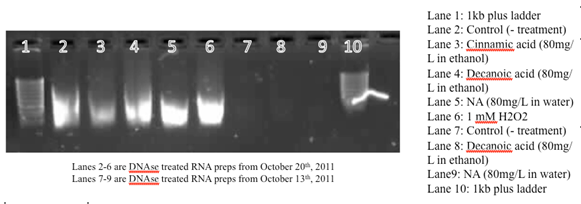
Figure 8. 0.8% Agarose Gel run at 110V for 15 minutes for RNA preps (DNAse treated) from Pseudomonas LD2 treated with cinnamic acid (80mg/L), napthenic acid/cyclohexane pentanoic acid (80mg/L), decanoic acid (80mg/L), H2O2 (1mM) and no treatment (control), and RNA preps from Oct 13, 2011 (Lane 7-9).
The RT-PCR yielded the following results:
The results are not as expected, as ECH expression is not upregulated in response to NA exposure, but instead upregulated in response to H2O2 and cinnamic acid treatment. The response to cinnamic acid is expected, since it is a natural substrate, but the response to hydrogen peroxide may indicate that the gene may be a general stress response gene, which requires further investigation to clarify.
Oct 24th to 28th, 2011
Author: Peter Qi and Margaret Renaud-Young
Summary of Activities:
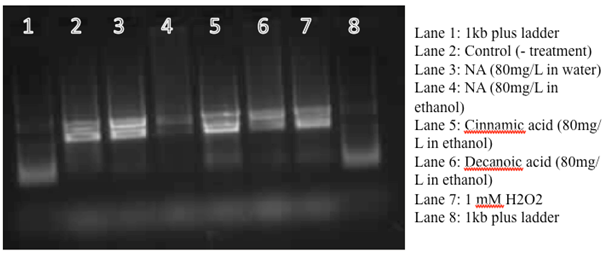
It was noticed last week that napthenic acids do not dissolve in water very well, and may not be homogenously mixed into culture. Also, it was discovered that ethanol may cause a general stress response, as it is observed in E coli. Thus, all treatments are now dissolved in ethanol before exposing to culture, and the control contains 5 uL of 95% ethanol. RNA is again isolated from the treated cultures using revised protocols as per last week. The RNA is run on agarose gel for confirmation, see gel below:
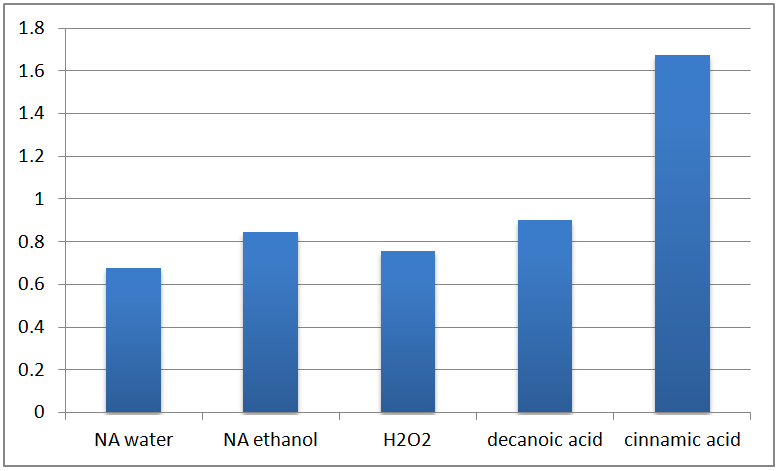
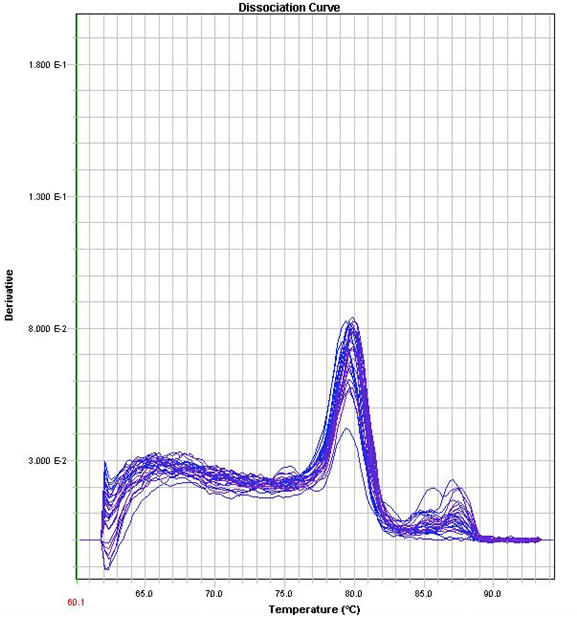
Serial dilutions of reversed transcribed products (from isolated RNA) is run on RT-PCR plates, for gene expression of ECH, and 16s rDNA. The following results are obtained:
The results are relative consistent with last week, except that the ECH is no longer upregulated by H2O2, and ECH expression in the hydrogen peroxide treatment is lower than that of NA treatment. However, no difference in gene expression is observed between FA and NA treatment, which suggests the response of ECH expression may not be specific to NA exposure.

 "
"


