Team:Washington/Magnetosomes/Magnet Results
From 2011.igem.org
(→A table of Translational Efficiency) |
|||
| (44 intermediate revisions not shown) | |||
| Line 6: | Line 6: | ||
=='''What’s in the Magnetosome Toolkit?'''== | =='''What’s in the Magnetosome Toolkit?'''== | ||
| - | * Our favorite genes in pGA vectors | + | * A set of 10 gene clusters from the essential mamAB operon of strain AMB-1 |
| - | + | * Our favorite genes as translational fusions with superfolder <i>gfp</i> in pGA vectors | |
* A table compiling individual gene functions from our literature search | * A table compiling individual gene functions from our literature search | ||
| + | * A table of Translational Efficiency using RBS calculator | ||
| + | |||
<br> | <br> | ||
| - | ----- <br/> | + | -----<br> |
| + | |||
| + | == '''Superfolder GFP-magnetosome gene protein fusions'''== | ||
| + | |||
| + | The two genes we characterized as fusions with superfolder GFP are <i>mamK</i> and <i>mamI</i>. They each perform core functions of magnetosome formation. MamK is a bacterial actin-like cytoskeleton protein required for proper alignment of the magnetosomes in a chain. MamI is a membrane-localized protein required for magnetosome vesicle formation that has also been shown to localize on the MamK filament. For more information, see the <i>mamAB</i> description [https://2011.igem.org/Team:Washington/Magnetosomes/mamDescriptions page]. Using our two genes of interest, we created C-terminal sfGFP fusions so we could track the localization of each gene separately within ''E.coli.'' | ||
| + | |||
| + | ===sfGFP-MamK: Scaffold formation=== | ||
| + | <br> | ||
| + | <center> [[File:Washington igem11 MamK fusion full 01.jpg|400px|middle]][[File:Washington igem11 MamK fusion gfp 01.jpg||400px|middle]]</center> | ||
| + | |||
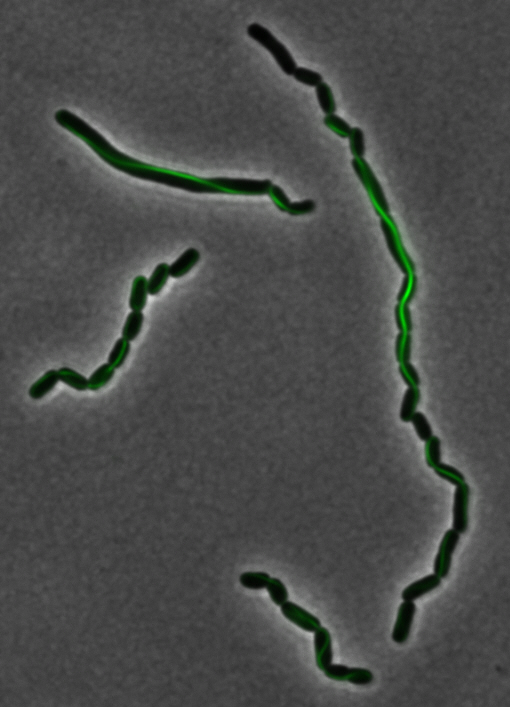
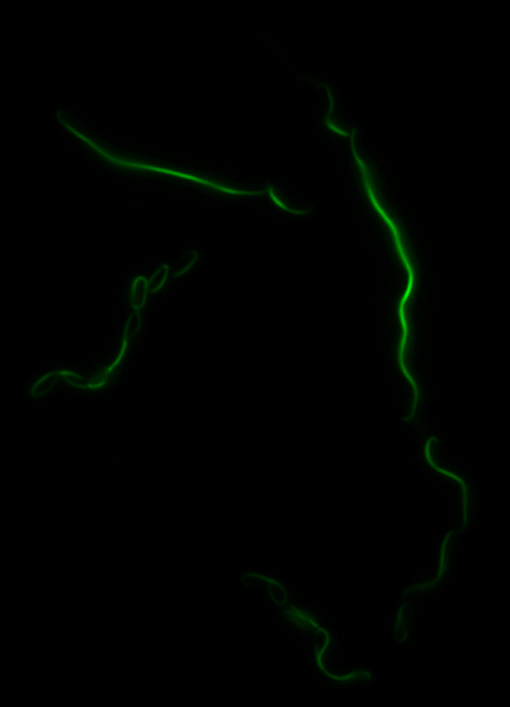
| + | The results we obtained with our sfGFP fusions inside ''E. coli'' were comparable to those done through other studies in the host organism ''Magnetospirillum magneticum''. Within AMB-1, MamK is a filament which runs along the long axis of the bacteria. In the our images of sfGFP-MamK, scaffold-like structures can be clearly seen running through the length of most of the cells, in some cases looping back within a single cell for "figure-8" shaped filaments. In other cases, the filaments seem to prevent the cells from dividing properly, resulting in long chains of ''E. coli''. In our experimental result, there was an over- expression of mamK which connected the ''E.coli'' cells together. | ||
| - | + | Here is a video showing the filaments connecting the growing ''E. coli'': | |
| - | + | <html><center><iframe width="420" height="315" src="http://www.youtube.com/embed/BLLyUHrrcV4" frameborder="0" allowfullscreen></iframe></center></html> | |
| - | + | ||
| - | + | With the presence of [http://en.wikipedia.org/wiki/IPTG IPTG], transcription of lac operon was triggered hence the expression of mamK. On the other hand, in the absence of IPTG, the production of mamK filament was not observed. | |
| - | + | ||
| - | |||
| - | <gallery widths=180px heights=150px caption=" | + | <gallery widths=180px heights=150px caption="More images of E.coli with sfGFP mamK fusion" > |
File:Washington igem11 SfGFP-K-1A3-100iptg-02(20ms exp) crop.jpg | File:Washington igem11 SfGFP-K-1A3-100iptg-02(20ms exp) crop.jpg | ||
File:Washington igem11 SfGFP-K-1A3-100iptg-02(20ms exp) gfp.jpg | File:Washington igem11 SfGFP-K-1A3-100iptg-02(20ms exp) gfp.jpg | ||
| Line 33: | Line 42: | ||
</gallery> | </gallery> | ||
| - | <br> | + | <br> |
| - | + | ||
| - | + | ===sfGFP-MamI: Membrane localization=== | |
| - | For mamI, the gene product | + | <center>[[File:Washington igem11 MamIfusion full.jpg|200px]][[File:Washington_igem11_MamIfusion_GFP.jpg|200px]][[File:Washington_igem11_mamI_graph.png|350px]] </center> |
| + | |||
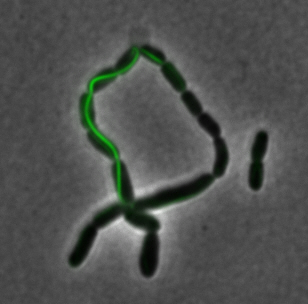
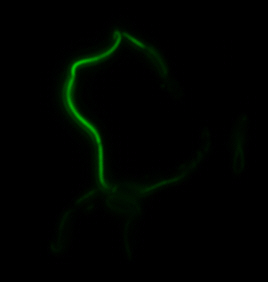
| + | For <i>mamI</i>, the gene product localizes to the cell membrane, consistent with its known role in inner membrane vesicle invagination. The membrane localization is easily seen by the fluorescence profile analysis seen on the panel on the right. The graph shows that the fluorescence levels peak near the cell membrane and decrease to a minimum in the middle of the cytoplasm. | ||
<br> <br> | <br> <br> | ||
| Line 45: | Line 55: | ||
=='''Construction of the R5 region of the Magnetosome Island in ''E.coli'' '''== | =='''Construction of the R5 region of the Magnetosome Island in ''E.coli'' '''== | ||
| - | After | + | After verifying that the construction of the sfGFP-MamK scaffold worked as expected, we proceeded to create a full assembly of the <i>mamAB</i> operon by building three super-assemblies: ''mamHIEJKL'', ''mamMNOPA'', and ''mamQRBSTUV''. The PCR products of these intermediate assemblies are shown below. The ''mamHIEJKL'' and ''mamQRBSTUV'' have been partially sequence-confirmed, and we are currently working on designing primers to fill in the gap sequences. Despite these gaps, when cells with the ''mamHIEJKL'' construct were imaged, they appeared to be forming chains.<br/> |
<center>[[File:Washington_iGEM2011_magentosome_HIEJKL3k3.png|500px|middle]]:[[File:Washington_iGEM2011_magentosome_MNOPA.png|100px|middle]][[File:Washington_iGEM2011_magentosome_QRBSTUV.png|100px|middle]] | <center>[[File:Washington_iGEM2011_magentosome_HIEJKL3k3.png|500px|middle]]:[[File:Washington_iGEM2011_magentosome_MNOPA.png|100px|middle]][[File:Washington_iGEM2011_magentosome_QRBSTUV.png|100px|middle]] | ||
</center> | </center> | ||
| + | <br/><br/> | ||
| - | + | == '''A set of the 18 genes from the mamAB operon essential for magnetosome formation'''== | |
| - | + | ||
| - | == '''A set of the 18 essential | + | |
Before piecing together the 16 kb genome of the mamAB gene cluster within the magnetosome island (MAI), we extracted out the genes in the following groups: | Before piecing together the 16 kb genome of the mamAB gene cluster within the magnetosome island (MAI), we extracted out the genes in the following groups: | ||
| - | [[File:Washington_iGEM2011_magentosome_all_gel.png|right|thumb|700px|Gel | + | [[File:Washington_iGEM2011_magentosome_all_gel.png|right|thumb|700px|Gel extracts of magnetosome gene clusters]] |
{| class="wikitable" | {| class="wikitable" | ||
|- | |- | ||
| Line 91: | Line 100: | ||
| 1002 | | 1002 | ||
|- | |- | ||
| - | |}. | + | |}. |
| - | + | ||
== '''A table of individual gene functions ''' == | == '''A table of individual gene functions ''' == | ||
| - | Please see | + | Please see our <i>mamAB</i> genes description [https://2011.igem.org/Team:Washington/Magnetosomes/mamDescriptions page]. |
| + | |||
| + | == ''' A table of Translational Efficiency''' == | ||
| + | Using the RBS Calculator developed by the Salis, Mirsky, and Voigt ([https://salis.psu.edu/software/doReverseRBS Link]), we were able to estimate the relative translation rate of each gene from the mamAB operon. | ||
| + | |||
| + | {| class="wikitable" |left | ||
| + | |- | ||
| + | ! Gene | ||
| + | ! AMB-1 | ||
| + | ! E.coli | ||
| + | ! Change in % | ||
| + | ! Actual sequence inputted in the calculator (first 9nt and last 9nt) | ||
| + | |- | ||
| + | | mamH | ||
| + | | 10821.63 | ||
| + | |10821.63 | ||
| + | | 0% | ||
| + | | TCGGAGGTG......CCAGCACAA | ||
| + | |- | ||
| + | | mamI | ||
| + | | 88.93 | ||
| + | | 88.93 | ||
| + | | 0% | ||
| + | | TCGCTCTGC.....ATTGCTGGG | ||
| + | |- | ||
| + | | mamE | ||
| + | | 37.82 | ||
| + | | 37.82 | ||
| + | | 0% | ||
| + | | ATGGCCATG.....CTATCTGAT | ||
| + | |- | ||
| + | | mamJ | ||
| + | | 105.9 | ||
| + | | 105.9 | ||
| + | | 0% | ||
| + | | ACCGCAATG.....CCAGGGTGA | ||
| + | |- | ||
| + | | mamK | ||
| + | | 1056.92 | ||
| + | | 1056.92 | ||
| + | | 0% | ||
| + | | GTCATTTAG.....TGGCATCGA | ||
| + | |- | ||
| + | | mamL | ||
| + | | 584.21 | ||
| + | | 584.21 | ||
| + | | 0% | ||
| + | | CGGGGATAC.....CGTGCTGTT | ||
| + | |- | ||
| + | | mamM | ||
| + | | 930.1 | ||
| + | | 930.1 | ||
| + | | 0% | ||
| + | | GTCGGGGCT.....CGGCCTGGC | ||
| + | |- | ||
| + | | mamN | ||
| + | | 413.73 | ||
| + | | 230.48 | ||
| + | | -44.29% | ||
| + | | GAAGTCATG.....CGCCGTTAT | ||
| + | |- | ||
| + | | mamO | ||
| + | | 138.73 | ||
| + | | 138.73 | ||
| + | | 0% | ||
| + | | TCCGAATGA.....CGTGTTTTG | ||
| + | |- | ||
| + | | mamP | ||
| + | | 198.85 | ||
| + | | 198.85 | ||
| + | | 0% | ||
| + | | TGATGATCA.....TGTTCTGGC | ||
| + | |- | ||
| + | | mamA | ||
| + | | 14.29 | ||
| + | | 14.29 | ||
| + | | 0% | ||
| + | | TAAAGTGAT.....CGAGGTCAC | ||
| + | |- | ||
| + | | mamQ | ||
| + | | 22.41 | ||
| + | | 12.49 | ||
| + | | -44.27% | ||
| + | | CCTTGCCGC.....TCCTTCATA | ||
| + | |- | ||
| + | | mamR | ||
| + | | 8.04 | ||
| + | | 8.04 | ||
| + | | 0% | ||
| + | | TCTCAACCA.....CGTGCAGGG | ||
| + | |- | ||
| + | | mamB | ||
| + | | 16.56 | ||
| + | | 16.56 | ||
| + | | 0% | ||
| + | | TCCAATCTT.....TGGGCCTTT | ||
| + | |- | ||
| + | | mamS | ||
| + | | 32.86 | ||
| + | | 25.09 | ||
| + | | -23.65% | ||
| + | | CACGGGCCT.....GATGGCCGA | ||
| + | |- | ||
| + | | mamT | ||
| + | | 81.16 | ||
| + | | 81.16 | ||
| + | | 0% | ||
| + | | TGGTGCAGT.....CTTGGGGAT | ||
| + | |- | ||
| + | | mamU | ||
| + | | 33.58 | ||
| + | | 33.58 | ||
| + | | 0% | ||
| + | | CGCTGACCA.....CGCCTGCCT | ||
| + | |- | ||
| + | | mamV | ||
| + | | 1.61 | ||
| + | | 1.61 | ||
| + | | 0% | ||
| + | | AATAAACCA.....TCGTGACCG | ||
| + | |}. | ||
| + | |||
| + | We tested this against the anti-Shine-Dalgarno 16S rRNA regions from ''E. coli'' and AMB-1, which differ only by one base – ACCTCCTTA and ACCTCCTTT, respectively. Furthermore, by modifying the native sequences, the translation initiation rates could be changed to get the proper expression levels. | ||
| + | |||
| + | Each number in the table represents the translation initiation rate (au) on a proportional scale from 0.1 to 100,00+. The higher the number the more proteins are translated per mRNA. It is important to keep in mind that this RBS calculator gives an estimation of translational efficiency only. | ||
| + | |||
| + | Due to the similarity in 16S rRNA sequences between the two strains, we expected to see a similar translation rates in ''E. coli'' compared with AMB-1 and the predictions fall within those expectations. However, mamN, mamQ, and mamS may have significantly lower translation rates in ''E. coli'' than AMB-1. | ||
| + | |||
| + | With the use the RBS calculator, the activity of individual genes’ can be estimated thus the level gene expression can be varied by sequence modification. | ||
Latest revision as of 00:26, 29 October 2011
What’s in the Magnetosome Toolkit?
- A set of 10 gene clusters from the essential mamAB operon of strain AMB-1
- Our favorite genes as translational fusions with superfolder gfp in pGA vectors
- A table compiling individual gene functions from our literature search
- A table of Translational Efficiency using RBS calculator
Superfolder GFP-magnetosome gene protein fusions
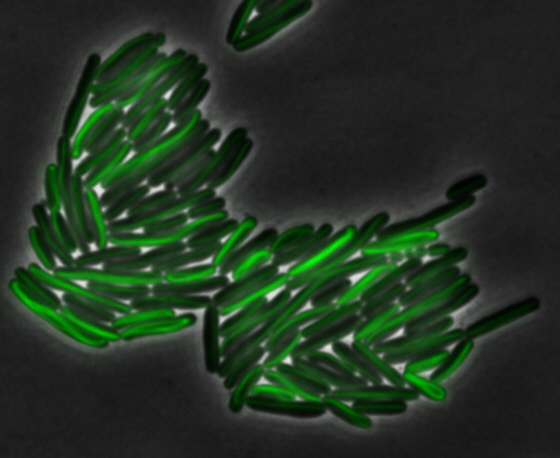
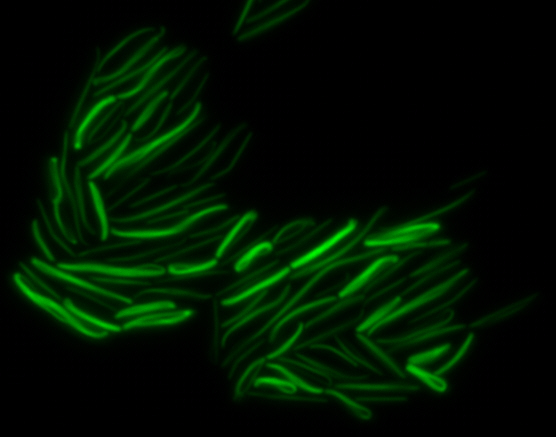
The two genes we characterized as fusions with superfolder GFP are mamK and mamI. They each perform core functions of magnetosome formation. MamK is a bacterial actin-like cytoskeleton protein required for proper alignment of the magnetosomes in a chain. MamI is a membrane-localized protein required for magnetosome vesicle formation that has also been shown to localize on the MamK filament. For more information, see the mamAB description page. Using our two genes of interest, we created C-terminal sfGFP fusions so we could track the localization of each gene separately within E.coli.
sfGFP-MamK: Scaffold formation
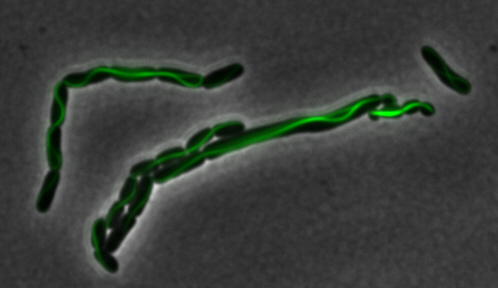
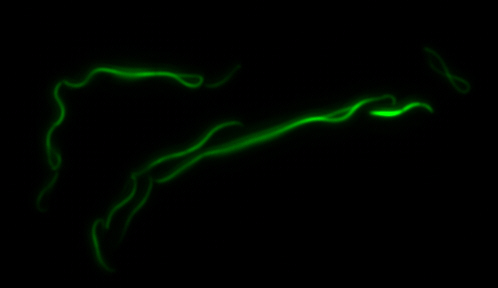
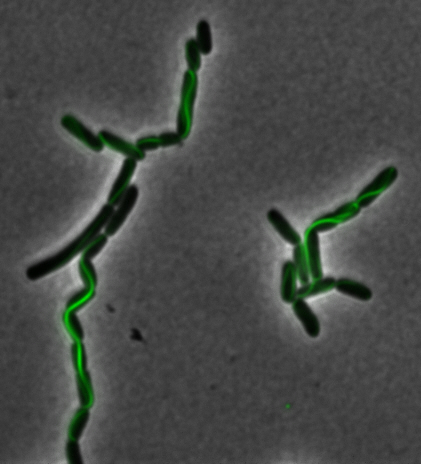
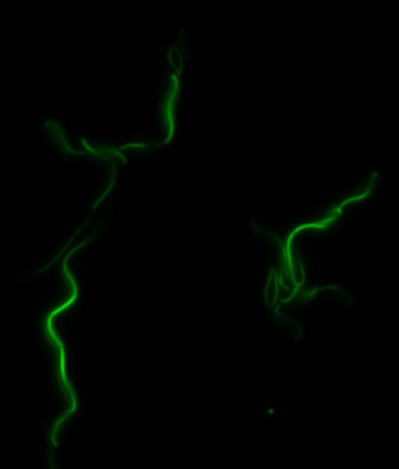
The results we obtained with our sfGFP fusions inside E. coli were comparable to those done through other studies in the host organism Magnetospirillum magneticum. Within AMB-1, MamK is a filament which runs along the long axis of the bacteria. In the our images of sfGFP-MamK, scaffold-like structures can be clearly seen running through the length of most of the cells, in some cases looping back within a single cell for "figure-8" shaped filaments. In other cases, the filaments seem to prevent the cells from dividing properly, resulting in long chains of E. coli. In our experimental result, there was an over- expression of mamK which connected the E.coli cells together.
Here is a video showing the filaments connecting the growing E. coli:
With the presence of [http://en.wikipedia.org/wiki/IPTG IPTG], transcription of lac operon was triggered hence the expression of mamK. On the other hand, in the absence of IPTG, the production of mamK filament was not observed.
sfGFP-MamI: Membrane localization
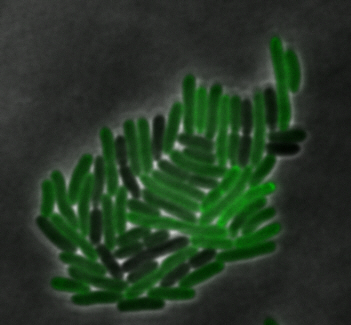
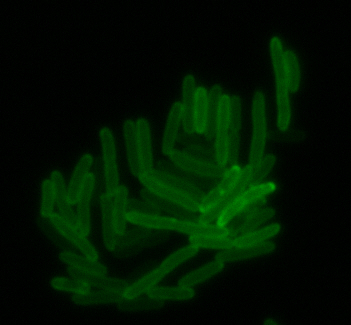
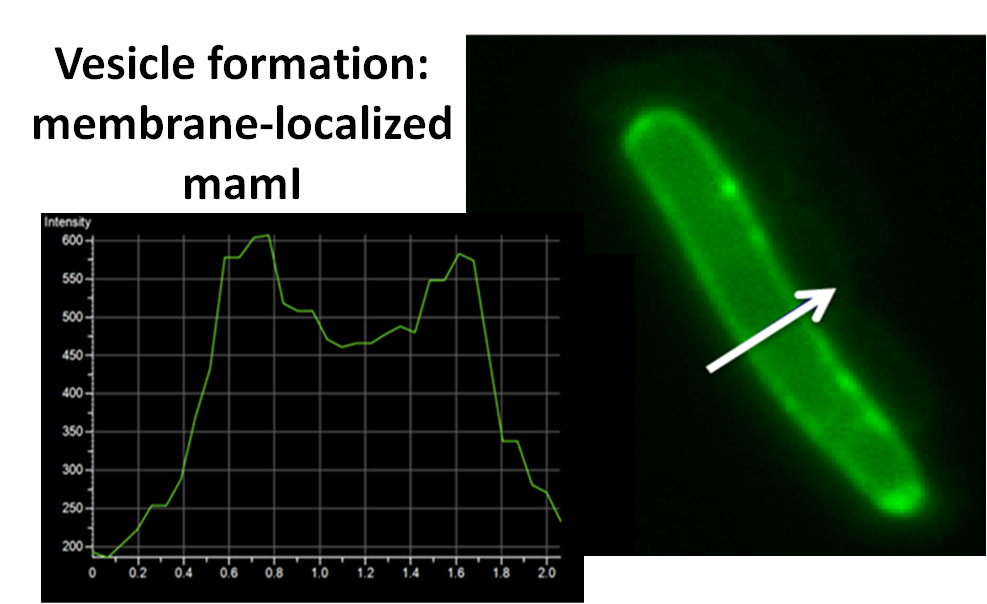
For mamI, the gene product localizes to the cell membrane, consistent with its known role in inner membrane vesicle invagination. The membrane localization is easily seen by the fluorescence profile analysis seen on the panel on the right. The graph shows that the fluorescence levels peak near the cell membrane and decrease to a minimum in the middle of the cytoplasm.
Construction of the R5 region of the Magnetosome Island in E.coli
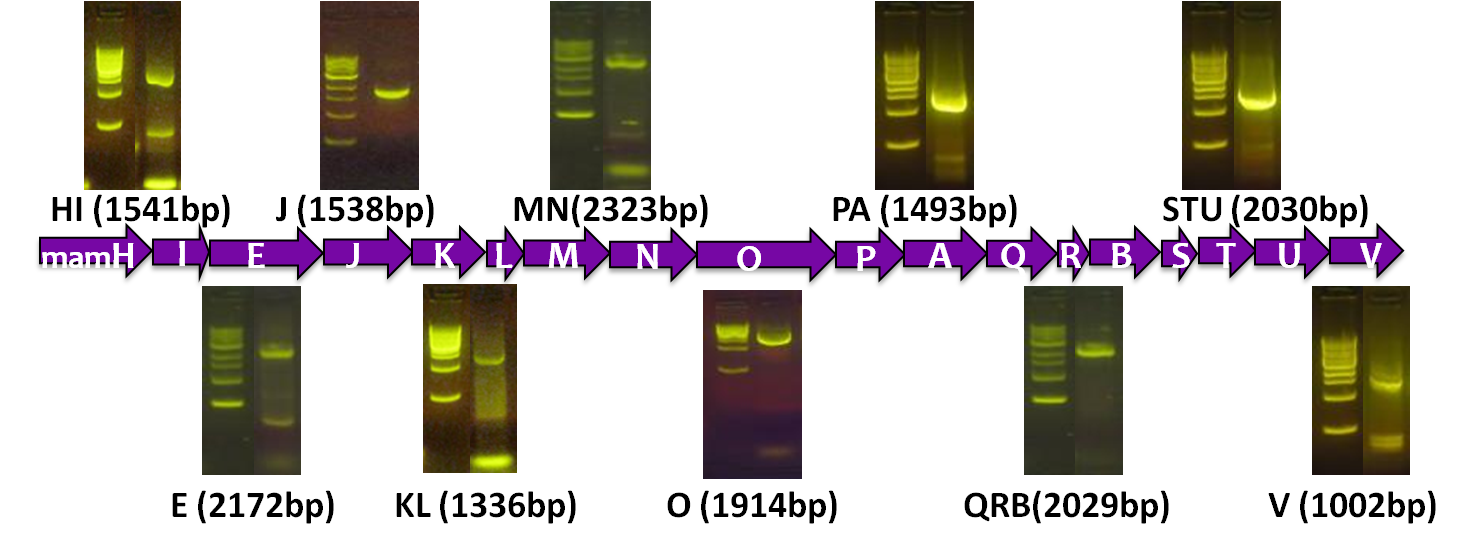
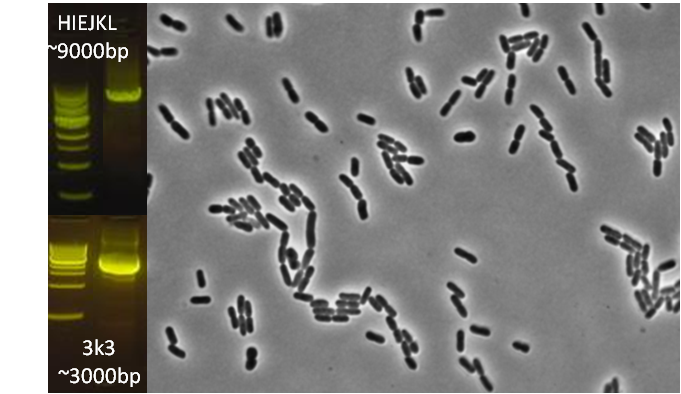
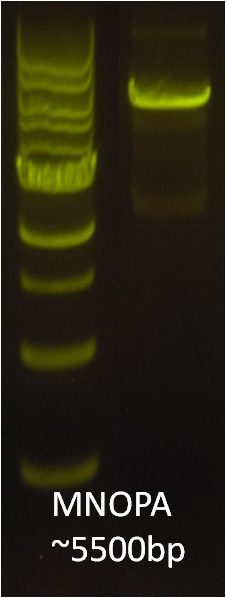
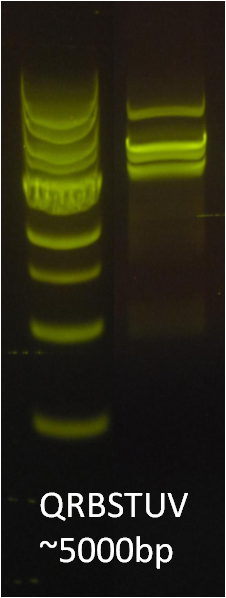
After verifying that the construction of the sfGFP-MamK scaffold worked as expected, we proceeded to create a full assembly of the mamAB operon by building three super-assemblies: mamHIEJKL, mamMNOPA, and mamQRBSTUV. The PCR products of these intermediate assemblies are shown below. The mamHIEJKL and mamQRBSTUV have been partially sequence-confirmed, and we are currently working on designing primers to fill in the gap sequences. Despite these gaps, when cells with the mamHIEJKL construct were imaged, they appeared to be forming chains.
 :
:
A set of the 18 genes from the mamAB operon essential for magnetosome formation
Before piecing together the 16 kb genome of the mamAB gene cluster within the magnetosome island (MAI), we extracted out the genes in the following groups:
| Gene groups | Length (bp) |
|---|---|
| mamHI | 1541 |
| mamE | 2172 |
| mamJ | 1538 |
| mamKL | 1336 |
| mamMN | 2323 |
| mamO | 1914 |
| mamPA | 1493 |
| mamQRB | 2029 |
| mamSTU | 2030 |
| mamV | 1002 |
A table of individual gene functions
Please see our mamAB genes description page.
A table of Translational Efficiency
Using the RBS Calculator developed by the Salis, Mirsky, and Voigt (Link), we were able to estimate the relative translation rate of each gene from the mamAB operon.
| Gene | AMB-1 | E.coli | Change in % | Actual sequence inputted in the calculator (first 9nt and last 9nt) |
|---|---|---|---|---|
| mamH | 10821.63 | 10821.63 | 0% | TCGGAGGTG......CCAGCACAA |
| mamI | 88.93 | 88.93 | 0% | TCGCTCTGC.....ATTGCTGGG |
| mamE | 37.82 | 37.82 | 0% | ATGGCCATG.....CTATCTGAT |
| mamJ | 105.9 | 105.9 | 0% | ACCGCAATG.....CCAGGGTGA |
| mamK | 1056.92 | 1056.92 | 0% | GTCATTTAG.....TGGCATCGA |
| mamL | 584.21 | 584.21 | 0% | CGGGGATAC.....CGTGCTGTT |
| mamM | 930.1 | 930.1 | 0% | GTCGGGGCT.....CGGCCTGGC |
| mamN | 413.73 | 230.48 | -44.29% | GAAGTCATG.....CGCCGTTAT |
| mamO | 138.73 | 138.73 | 0% | TCCGAATGA.....CGTGTTTTG |
| mamP | 198.85 | 198.85 | 0% | TGATGATCA.....TGTTCTGGC |
| mamA | 14.29 | 14.29 | 0% | TAAAGTGAT.....CGAGGTCAC |
| mamQ | 22.41 | 12.49 | -44.27% | CCTTGCCGC.....TCCTTCATA |
| mamR | 8.04 | 8.04 | 0% | TCTCAACCA.....CGTGCAGGG |
| mamB | 16.56 | 16.56 | 0% | TCCAATCTT.....TGGGCCTTT |
| mamS | 32.86 | 25.09 | -23.65% | CACGGGCCT.....GATGGCCGA |
| mamT | 81.16 | 81.16 | 0% | TGGTGCAGT.....CTTGGGGAT |
| mamU | 33.58 | 33.58 | 0% | CGCTGACCA.....CGCCTGCCT |
| mamV | 1.61 | 1.61 | 0% | AATAAACCA.....TCGTGACCG |
We tested this against the anti-Shine-Dalgarno 16S rRNA regions from E. coli and AMB-1, which differ only by one base – ACCTCCTTA and ACCTCCTTT, respectively. Furthermore, by modifying the native sequences, the translation initiation rates could be changed to get the proper expression levels.
Each number in the table represents the translation initiation rate (au) on a proportional scale from 0.1 to 100,00+. The higher the number the more proteins are translated per mRNA. It is important to keep in mind that this RBS calculator gives an estimation of translational efficiency only.
Due to the similarity in 16S rRNA sequences between the two strains, we expected to see a similar translation rates in E. coli compared with AMB-1 and the predictions fall within those expectations. However, mamN, mamQ, and mamS may have significantly lower translation rates in E. coli than AMB-1.
With the use the RBS calculator, the activity of individual genes’ can be estimated thus the level gene expression can be varied by sequence modification.
 "
"


