Team:Calgary/Notebook/Journals/NA viability
From 2011.igem.org
| (12 intermediate revisions not shown) | |||
| Line 2: | Line 2: | ||
{{Team:Calgary/Notebookbar| | {{Team:Calgary/Notebookbar| | ||
| - | TITLE = Testing the | + | TITLE = Testing the Survival and Viability of Bacteria in NAs| |
BODY = | BODY = | ||
<html> | <html> | ||
<h2><i>E. coli</i> viability assays</h2> | <h2><i>E. coli</i> viability assays</h2> | ||
| - | <p>In total three assays were carried out to assess the viability of <i>E. coli</i> in NAs. In the first one <i>E. coli</i> were treated with different concentrations of two types NAs in distilled water, tailings samples received from Dr. Gieg and distilled water. 1M NaOH was added to each f these samples bringing the pH to ~7.</p> | + | <p>In total three assays were carried out to assess the viability of <i>E. coli</i> in NAs. In order to see whether or not the <i> E. coli</i> could be used as the chassis for the electrochemical system we first had to determine how well the E. coli survived in high concentrations of NAs. In the first one <i>E. coli</i> were treated with different concentrations of two types NAs in distilled water, tailings samples received from Dr. Gieg and distilled water. 1M NaOH was added to each f these samples bringing the pH to ~7.</p> |
| - | <p>In the second assay | + | <p>In the second assay was similar to the first one except that the <i>E. coli</i> were treated with NA dilutions which were not pH adjusted.</p> |
<p> In the third assay the NAs, this time only the mixture supplied by Sigma-Aldrich, were diluted in PBS (phosphate saline) buffer which kept the pH about 7.<p> | <p> In the third assay the NAs, this time only the mixture supplied by Sigma-Aldrich, were diluted in PBS (phosphate saline) buffer which kept the pH about 7.<p> | ||
<h2>Brief Methods:</h2> | <h2>Brief Methods:</h2> | ||
| - | <p><i>E. coli</i> cells were subcultured until log phase then divided into 2mL tubes and pelleted. The supernatant was removed and 2mL of the treatment was added and the cells were resuspended. Immediately at this point | + | <p><i>E. coli</i> cells were subcultured until log phase then divided into 2mL tubes and pelleted. The supernatant was removed and 2mL of the treatment was added and the cells were resuspended. Immediately at this point 20uL samples of the mixtures were taken and diluted 10 times, 100 times, 1000 times, and finally 10 000 times. The diluted samples were then spotted on LB plates. The mixture was then placed in a 37 degree shaker to be removed when the time arose to repeat the above dilutions and plate spotting.</p> |
<p> These plates were then incubated for the same amount of time and the number of colonies for each treatment and dilution were recorded.</p> | <p> These plates were then incubated for the same amount of time and the number of colonies for each treatment and dilution were recorded.</p> | ||
| Line 20: | Line 20: | ||
<li> TW denotes tailings water</li> | <li> TW denotes tailings water</li> | ||
<li> CHPA denotes cyclohexane pentanoic acid</li> | <li> CHPA denotes cyclohexane pentanoic acid</li> | ||
| - | <li> "lawn" denotes massive growth on the plate which cannot be counted</li></ul> | + | <li> "lawn" denotes massive growth on the plate which cannot be counted</li> |
| + | <li>Unless otherwise stated, all treatment samples contain cells</li></ul> | ||
<br></br> | <br></br> | ||
| - | </html>[[Image:UCalgary 2011MSQTable 1. first NA assay.png|thumb|610px|left|<b>Table 1.</b> Results of the first <i>E. coli</i> viability assay in NAs (June 25, 2011). The NAs were diluted in | + | </html>[[Image:UCalgary 2011MSQTable 1. first NA assay.png|thumb|610px|left|<b>Table 1.</b> Results of the first <i>E. coli</i> viability assay in NAs (June 25, 2011). The NAs were diluted in ddH<sub>2</sub>O then pH adjusted.]]<html> |
| - | </html>[[Image:UCalgary2011 MSQTable 2. second NA assay.png|thumb|610px|left|<b>Table 2.</b> Results of the second <i>E. coli</i> viability assay in NAs (July 5, 2011).</i> The NAs were diluted in | + | </html>[[Image:UCalgary2011 MSQTable 2. second NA assay.png|thumb|610px|left|<b>Table 2.</b> Results of the second <i>E. coli</i> viability assay in NAs (July 5, 2011).</i> The NAs were diluted in ddH<sub>2</sub>O, which was not pH adjusted.]]<html> |
</html>[[Image:UCalgary2011 MSQTable 3. third NA assay.png|thumb|610px|left|<b>Table 3.</b> Results of the third <i>E. coli</i> viability assay in NAs (July 22, 2011). The NAs were diluted in PBS buffer (pH ~7).]]<html> | </html>[[Image:UCalgary2011 MSQTable 3. third NA assay.png|thumb|610px|left|<b>Table 3.</b> Results of the third <i>E. coli</i> viability assay in NAs (July 22, 2011). The NAs were diluted in PBS buffer (pH ~7).]]<html> | ||
| Line 33: | Line 34: | ||
<h2>Discussion</h2> | <h2>Discussion</h2> | ||
| - | <The <i>E. coli </i> | + | <p>The <i>E. coli </i>could not survive in NAs diluted in 10,000 mg/L in pure ddH<sub>2</sub>O (Table 2) but could survive in concentrations of up to 30,000 mg/L (though not well) when diluted in PBS buffer which kept the pH constant around 7 and also kept a balance of salts and minerals in the solution. The major conclusion that can be drawn from this data is that concentrations upwards of 10,000 or even 10,000, in the case of the NAs diluted in ddH2O, are not conducive to the growth or survival of <i>E. coli</i>. The <i>E. coli</i> did however appear to survive quite well in the tailings ponds water (Table 1 and Table 2), possibly due to low concentration of NAs in the sample used. In addition, recent experiences with NAs have indicated that they do not freely dissolve in water or buffer but form micelles separating themselves from much of the aqueous solution. Thus it is possible that the survival of <i>E. coli</i> in concentrations of up to 10,000 mg/L was due to the fact that the NAs may have separated from the rest of the solution and formed micelles. Further experiments will have to be done to determine whether this is the case. The concentration of NAs in tailings ponds may vary greatly between samples but are generally well below the concentrations tested in these assays. However, it is still safe option to use a species native to the tailings ponds in the reporter system since it would have a mechanism to survive in the concentrations of NAs found in tailings ponds.<p> |
| + | <h2><i>Pseudomonas</i> Viability Assays</h2> | ||
| + | </html>[[Image:UofC2011_GrapshSet2.png|thumb|350px|left|<b>Table 4.</b> The OD measurement of each culture was measured at a variety of temperatures over a series of times. This data suggests that the co-culture grows better than LD1 or LD2 individually.]]<html> | ||
| + | |||
| + | <p>Our team based our naphthenic acid sensing chassis on the two species of <i>Pseudomonas</i> identified in Moore et al. (2006). These two species named LD1 and LD2 corresponded to <i>Pseudomonas putida</i> and <i>Pseudomonas fluorescens</i> respectively. Together, they were found to degrade naphthenic acids significantly better than when cultured independently. See the chassis section for more information on our selection.</p> | ||
| + | |||
| + | <p>Although these species may be able to degrade naphthenic acids in co-culture, there were no assays completed to show that growth was effected by naphthenic acid concentration. In order to identify the ability of these species of <i>Pseudomonas</i> to thrive in naphthenic acids we performed a series of experiments to identify there growth. | ||
| + | |||
| + | Solutions of 5 mL minimal Focht media (K<sub>2</sub>HPO<sub>4</sub> 10 mM, NaH<sub>2</sub>PO<sub>4</sub> 3 mM, (NH<sub>4</sub>)<sub>2</sub>SO<sub>4</sub> 10 mM, MgSO<sub>4</sub> 1 mM, Ca(NO<sub>3</sub>)<sub>2</sub> 0.1 mM, Fe(NO<sub>3</sub>)<sub>2</sub> 0.01 mM, MnSO<sub>4</sub> 0.001 mM, ZnSO<sub>4</sub> 0.001 mM, CuSO<sub>4</sub> 0.001 mM, NiSO<sub>4</sub> 0.0001 mM, CoSO<sub>4</sub> 0.0001 mM, Na<sub>2</sub>MoO<sub>4</sub> 0.0001 mM) was incubated with naphthenic acids at a concentration of 80 mg/L. 200 uL of LD1 or LD2 were subcultured into the media either separately or together and the samples were incubated immediately after for the time and temperature indicated on the graph.</p> | ||
| + | |||
| + | <p>The results show that LD1 and LD2 do indeed grow better in co-culture at a variety of temperatures. This agrees with the results of the Moore et al. (2006) paper. | ||
| + | <style> | ||
| + | #titlebar{margin-top: -6px;} | ||
| + | #pagetitle{padding-top: 17px;} | ||
| + | #bodycontainer{padding-top: 6px;} | ||
| + | </style> | ||
</html> | </html> | ||
}} | }} | ||
Latest revision as of 04:41, 29 September 2011





Testing the Survival and Viability of Bacteria in NAs

E. coli viability assays
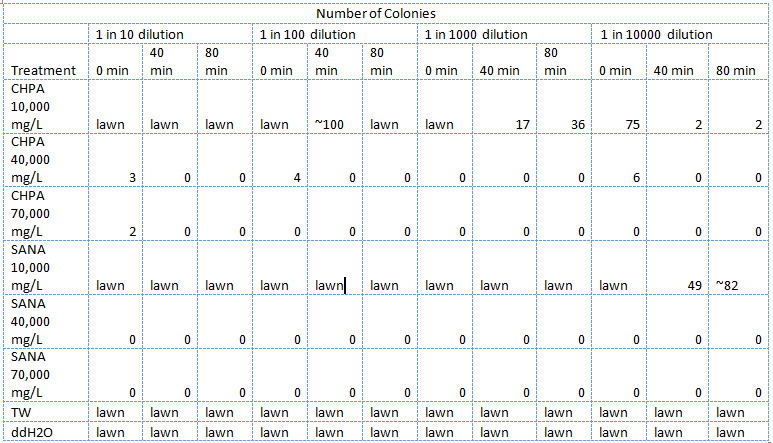
In total three assays were carried out to assess the viability of E. coli in NAs. In order to see whether or not the E. coli could be used as the chassis for the electrochemical system we first had to determine how well the E. coli survived in high concentrations of NAs. In the first one E. coli were treated with different concentrations of two types NAs in distilled water, tailings samples received from Dr. Gieg and distilled water. 1M NaOH was added to each f these samples bringing the pH to ~7.
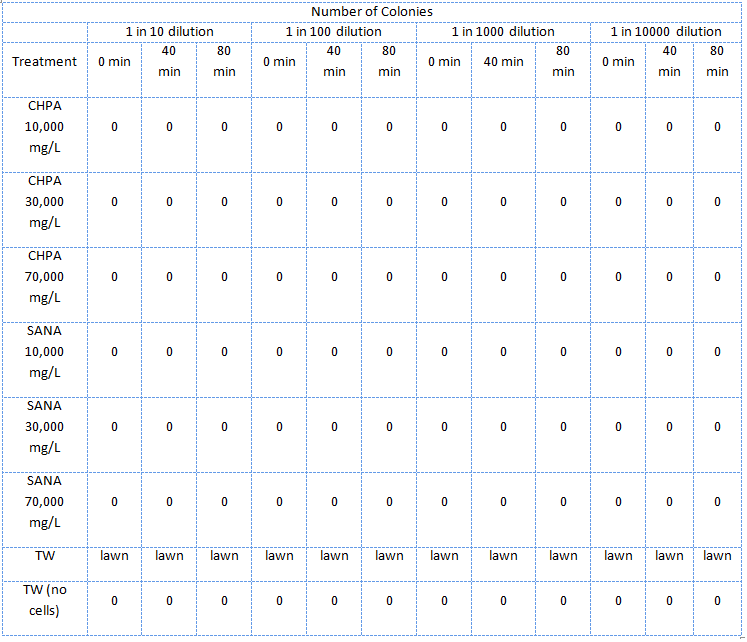
In the second assay was similar to the first one except that the E. coli were treated with NA dilutions which were not pH adjusted.
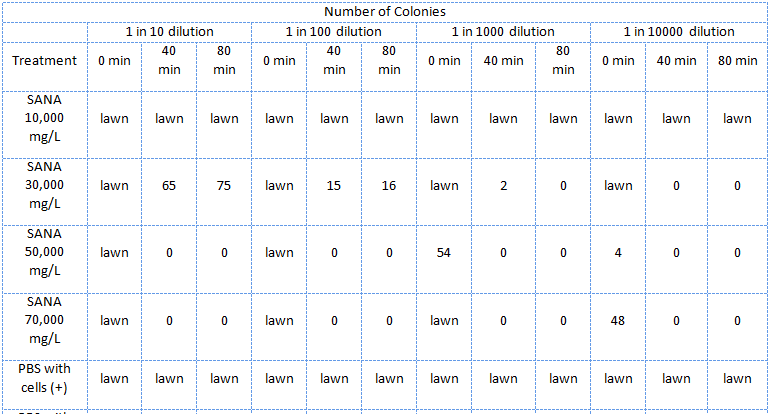
In the third assay the NAs, this time only the mixture supplied by Sigma-Aldrich, were diluted in PBS (phosphate saline) buffer which kept the pH about 7.
Brief Methods:
E. coli cells were subcultured until log phase then divided into 2mL tubes and pelleted. The supernatant was removed and 2mL of the treatment was added and the cells were resuspended. Immediately at this point 20uL samples of the mixtures were taken and diluted 10 times, 100 times, 1000 times, and finally 10 000 times. The diluted samples were then spotted on LB plates. The mixture was then placed in a 37 degree shaker to be removed when the time arose to repeat the above dilutions and plate spotting.
These plates were then incubated for the same amount of time and the number of colonies for each treatment and dilution were recorded.
Results:
Guide to the tables:
- SANA denotes Sigma-Aldrich Naphthenic Acids
- TW denotes tailings water
- CHPA denotes cyclohexane pentanoic acid
- "lawn" denotes massive growth on the plate which cannot be counted
- Unless otherwise stated, all treatment samples contain cells
Discussion
The E. coli could not survive in NAs diluted in 10,000 mg/L in pure ddH2O (Table 2) but could survive in concentrations of up to 30,000 mg/L (though not well) when diluted in PBS buffer which kept the pH constant around 7 and also kept a balance of salts and minerals in the solution. The major conclusion that can be drawn from this data is that concentrations upwards of 10,000 or even 10,000, in the case of the NAs diluted in ddH2O, are not conducive to the growth or survival of E. coli. The E. coli did however appear to survive quite well in the tailings ponds water (Table 1 and Table 2), possibly due to low concentration of NAs in the sample used. In addition, recent experiences with NAs have indicated that they do not freely dissolve in water or buffer but form micelles separating themselves from much of the aqueous solution. Thus it is possible that the survival of E. coli in concentrations of up to 10,000 mg/L was due to the fact that the NAs may have separated from the rest of the solution and formed micelles. Further experiments will have to be done to determine whether this is the case. The concentration of NAs in tailings ponds may vary greatly between samples but are generally well below the concentrations tested in these assays. However, it is still safe option to use a species native to the tailings ponds in the reporter system since it would have a mechanism to survive in the concentrations of NAs found in tailings ponds.
Pseudomonas Viability Assays
Our team based our naphthenic acid sensing chassis on the two species of Pseudomonas identified in Moore et al. (2006). These two species named LD1 and LD2 corresponded to Pseudomonas putida and Pseudomonas fluorescens respectively. Together, they were found to degrade naphthenic acids significantly better than when cultured independently. See the chassis section for more information on our selection.
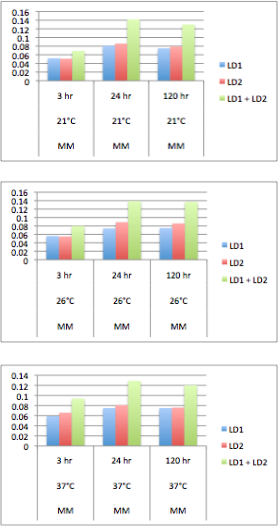
Although these species may be able to degrade naphthenic acids in co-culture, there were no assays completed to show that growth was effected by naphthenic acid concentration. In order to identify the ability of these species of Pseudomonas to thrive in naphthenic acids we performed a series of experiments to identify there growth. Solutions of 5 mL minimal Focht media (K2HPO4 10 mM, NaH2PO4 3 mM, (NH4)2SO4 10 mM, MgSO4 1 mM, Ca(NO3)2 0.1 mM, Fe(NO3)2 0.01 mM, MnSO4 0.001 mM, ZnSO4 0.001 mM, CuSO4 0.001 mM, NiSO4 0.0001 mM, CoSO4 0.0001 mM, Na2MoO4 0.0001 mM) was incubated with naphthenic acids at a concentration of 80 mg/L. 200 uL of LD1 or LD2 were subcultured into the media either separately or together and the samples were incubated immediately after for the time and temperature indicated on the graph.
The results show that LD1 and LD2 do indeed grow better in co-culture at a variety of temperatures. This agrees with the results of the Moore et al. (2006) paper.

 "
"


