Team:Lethbridge/Results
From 2011.igem.org
Liszabruder (Talk | contribs) |
|||
| (46 intermediate revisions not shown) | |||
| Line 18: | Line 18: | ||
<th> | <th> | ||
| - | <image src="https://static.igem.org/mediawiki/2011/e/e6/Picture_22.jpg" height="340px"/> | + | <image src="https://static.igem.org/mediawiki/2011/e/e6/Picture_22.jpg" width="500px" height="340px"/> |
</th> | </th> | ||
| Line 33: | Line 33: | ||
<br> | <br> | ||
<BLOCKQUOTE> | <BLOCKQUOTE> | ||
| + | |||
| + | =<font color=”black”>Part:BBa_K542008 - Lumazine Synthase Microcompartment Device= | ||
| + | |||
| + | <font color="black">Datasheet for <html><a href="http://partsregistry.org/Part:BBa_K542008"><font color="blue">Part BBa_K542008</font></a></html> in <i>E. coli</i> strain DH5alpha. | ||
| + | <br> | ||
| + | [[image:uoflECdatasheet.png|center|150px]] | ||
| + | |||
| + | ==Introduction== | ||
| + | The intended purpose of the Lumazine Synthase microcompartment device is to specifically target proteins that have been tagged with a positively charged oligopeptide into the cavity formed by the microcompartment. Furthermore, multiple unique proteins may be targeted into the cavity (1) for the purposes of increasing the efficiency of a metabolic pathway, to name just one example. This test construct is designed to demonstrate that proteins with positively charged tags can be localized into the cavity of the microcompartment formed by the oligomerization of Lumazine Synthase monomers. | ||
| + | <br><br> | ||
| + | The expression of Lumazine Synthase and the fluorescent proteins are independently regulated by two separate promoters. Lumazine Synthase is regulated by the pLacI promoter and the fluorescent proteins are regulated by the pBAD inverter. Since the two are independently controlled, Lumazine Synthase microcompartments may be formed in the presence or absence of the fluorescent proteins (ie. absence or presence of arabinose, respectively). | ||
| + | <br><br> | ||
| + | Because the fluorescent proteins are tagged with a positively-charged poly-arginine tag and the Lumazine Synthase is mutated with a negative interior (BBa_K249002 and Lethbridge 2009 Modeling), enhanced cyan fluorescent protein (ECFP) and enhanced yellow fluorescent protein (EYFP) should be targeted into the microcompartments. ECFP and EYFP are a well known FRET pair. | ||
| + | ===Construct=== | ||
| + | Part Number BBa_K542008 | ||
| + | <br><br> | ||
| + | The construct was made by assembling BBa_K542004 with BBa_K542005. | ||
| + | [[image:uoflconstruct.png|center|600px]] | ||
| + | <br><br> | ||
| + | <b>Figure 1.</b> BBa_K542008. This construct contains pLacI Regulated Lumazine Synthase and pBAD Inverse-Regulated Arg-tagged ECFP and EYFP. | ||
| + | |||
| + | ==Characterization== | ||
| + | ===Electron Microscopy=== | ||
| + | <i>E. coli</i> DH5α cells expressing BBa_K542008 and controls were viewed using Transmission Electron Microscopy (TEM). | ||
| + | ====Materials and Methods==== | ||
| + | <i>E. coli</i> DH5α cells containing BBa_K542008 as well as control cultures containing only plasmid pSB1C3 were grown overnight at 37°C. Approximately 400 mL of these cells were then resuspended in 5 mL SOC media, and induced with 5 mL or 10 mL of 1 M IPTG. Cells were again incubated at 37°C for approximately 4 hours. Cells were then spun down at 6000 x g for 2 min. | ||
| + | <br><br> | ||
| + | Cells were resuspended in 500 mL gluteraldehyde/formaldehyde fixative and incubated at room temperature for 2 hours. The solution was then spun at 6000 x g for 2 min. | ||
| + | <br><br> | ||
| + | The cell pellet was resuspended in 0.1 M sodium cacodylate buffer and incubated for 10 min. The solution was centrifuged for 2 min at 6000 x g. This step was repeated an additional 2 times. Cells were then resuspended in 1% osmium tetroxide fixative in 0.1 M CaC buffer and incubated at room temperature for 1 hour. The solution was centrifuged at 6000 x g for 2 min. Cells were then resuspended in MilliQ H2O. | ||
| + | <br><br> | ||
| + | The cells were spun down at 10000 x g for 5 min, and resuspended in 4% BIO-RAD standard low melting temperature agarose at 60°C. A drop of this cell-agarose mixture was then added to slides in order to harden, and incubated in MilliQ H<sub>2</sub>O overnight. | ||
| + | <br><br> | ||
| + | Agarose-cell mixtures were cut into cubes of approximately 1 mm x 1 mm x 1 mm. They were then incubated in increasing alcohol concentrations up to 100% anhydrous ethyl alcohol. The cubes were then incubated in decreasing concentrations of alcohol and increasing concentrations of resin, up to 100% resin. The cubes were left in 100% resin to harden overnight. | ||
| + | <br> | ||
| + | The resin-embedded cubes of cells were thin-sectioned and placed on a carbon grid. They were stained with uranyl acetate and then positively stained with lead citrate and viewed under TEM. | ||
| + | ====Results==== | ||
| + | [[image:uoflECEM1.png|center|400px]] | ||
| + | <br><br> | ||
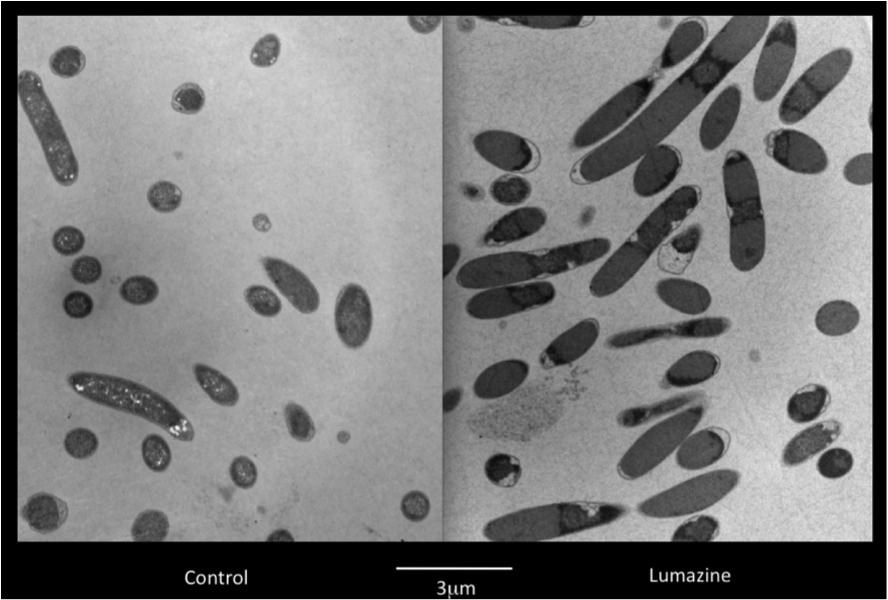
| + | <b>Figure 2.</b> <i>E. coli</i> DH5α control cells (left) and cells expressing BBa_K542008 (right) as viewed under transmission electron microscope. | ||
| + | [[image:uoflECEM2.png|center|400px]] | ||
| + | <br><br> | ||
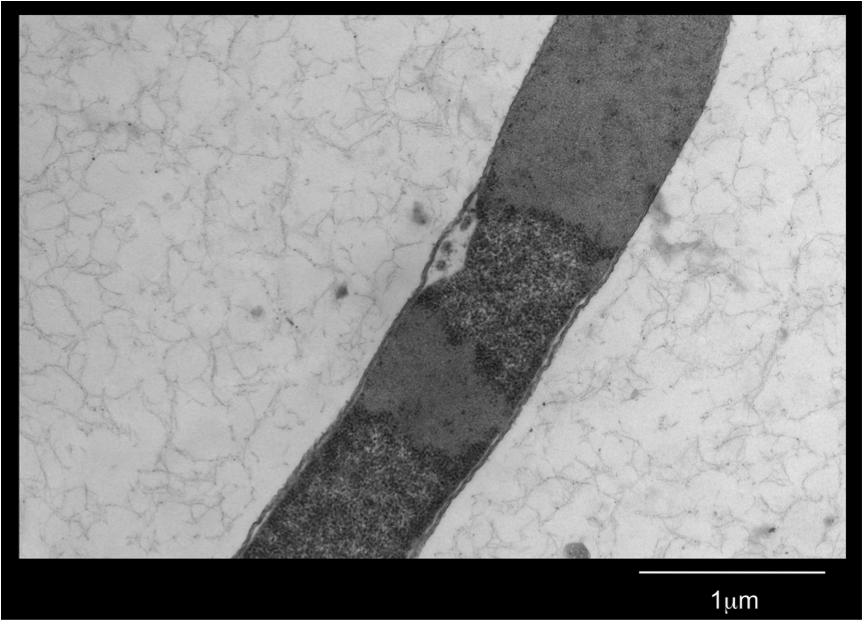
| + | <b>Figure 3.</b> <i>E. coli</i> DH5α cells expressing BBa_K542008 as viewed under transmission electron microscope. | ||
| + | ==== Discussion and Conclusion==== | ||
| + | We found that while the controls had a fairly uniform interior, the lumazine expressing cells did not (Figure 2). In the lumazine cells there were homogenous areas of grey as well as darker spots, whereas the controls contained a more uniform interior. | ||
| + | <br><br> | ||
| + | We hypothesized that the lumazine accumulated together, which caused the isolation of other cellular elements. If this is the case, the microcompartments should most likely be the homogenous areas of grey not seen in the controls, and can’t be distinguished by contrast staining because they are aggregated together. | ||
| + | <br><br> | ||
| + | To see if this is the case we will look at cells expressing BBa_K542008 under the spectral confocal (fluorescence) microscope. We hypothesize that if the microcompartments are segregated from other cellular elements then the fluorescent proteins will also be segregated and therefore we should see areas within the cell with brighter fluorescence. | ||
| + | ===Fluorescence Microscopy=== | ||
| + | <i>E. coli</i> DH5α cells containing BBa_K542008 were viewed with fluorescence microscopy. This was done in order to determine if the distribution of fluorescent proteins within the cells was similar to the homogenous grey regions seen in the cells under TEM. | ||
| + | ====Materials and Methods==== | ||
| + | <i>E. coli</i> DH5α cells containing the BBa_K542008 construct were grown overnight at 37°C. They were spun down at 10,000 rpm and then resuspended in 1X phosphate buffer saline (PBS). The solution was centrifuged at 10,000 rpm, decanted and resuspended in 4% paraformaldehyde (PFA) overnight. This solution was then centrifuged at 10000 rpm and cells were resuspended in glycerol. The glycerol-cell mixtures were then placed on slides, coverslipped and sealed. | ||
| + | <br><br> | ||
| + | The slides were viewed with an Olympus FV1000 spectral confocal at 60X magnification. Pictures were taken using the ECFP and EYFP filters. | ||
| + | ====Results==== | ||
| + | [[image:uoflECFluorescence.png|center|400px]] | ||
| + | <br> | ||
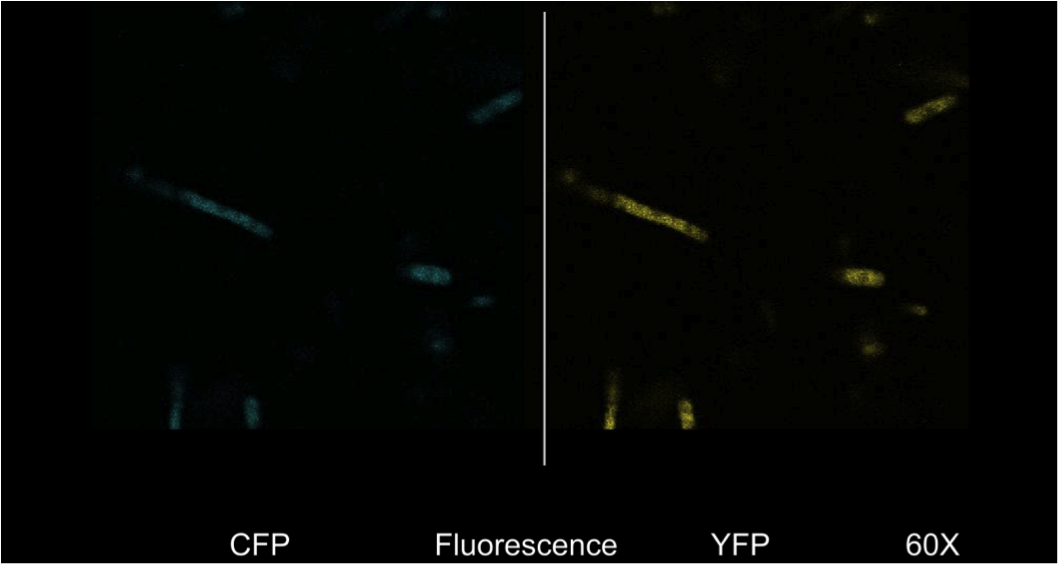
| + | <b>Figure 4.</b> <i>E. coli</i> DH5a cells containing the BBa_K542008 construct as viewed under spectral confocal microscope with 60X magnification. The left picture corresponds to the ECFP filter and the right picture corresponds to the EYFP filter. | ||
| + | |||
| + | ====Conclusion==== | ||
| + | Figure 4 shows that the fluorescent proteins were expressed in the cells. It is also evident that the fluorescence was segmented in a way that looks similar to that found in the homogenous grey areas in the TEM micrographs of the cells. | ||
| + | |||
| + | ===Scanning Electron Microscopy=== | ||
| + | |||
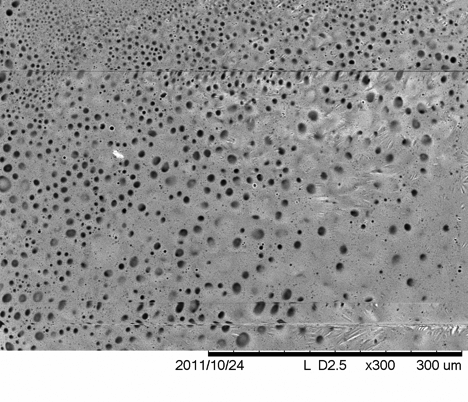
| + | We attempted to view lumazine synthase microcompartments under scanning electron microscopy. However, because our microcompartments were in solution, the moisture remaining caused the electron beam to heat the sample. This destroyed the entire sample, including the carbon material it was placed on. | ||
| + | |||
| + | [[image:uoflsem.png|center]] | ||
| + | |||
| + | <b>Figure 1.</b> Scanning electron micrograph of lumazine synthase. The microcompartments are not visible due to the electron beam destroying the sample, as seen in the above dark spots. | ||
| + | |||
| + | ===Fluorescent Resonance Energy Transfer (FRET)=== | ||
| + | ====Materials and Methods==== | ||
| + | <i>Preparation of Cell Cultures and Controls</i><br> | ||
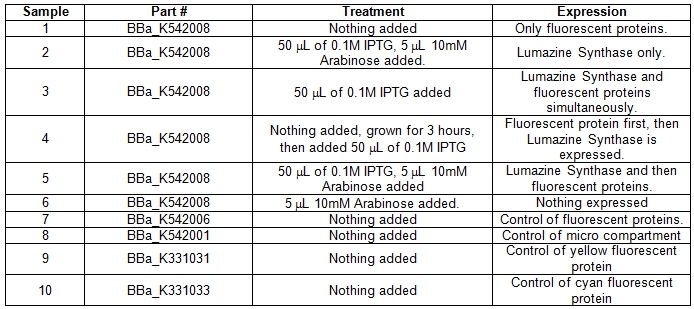
| + | A total of six 5ml cell cultures of Escherichia coli DH5α cells containing the BBa_K542008 construct were grown under different conditions overnight at 37°C. As controls parts BBa_K542006, BBa_K331031, BBa_K331033, BBa_K542001 were grown normally overnight at 37°C.<br> | ||
| + | |||
| + | <b>Table 1.</b> E.coli DH5α cells cultures grown in LB media and incubated overnight with shaking at 37°C. Samples #1-6 was grown up differently with specific treatments for the expression of certain parts within the BBa_K542008 construct. Samples #7-10 was grown as controls. <br> | ||
| + | [[image:UolFRETTable1.jpg|center|600px]]<br><br> | ||
| + | |||
| + | The following morning, six 50mL cultures were inoculated with 1mL of overnight culture grown to sample 6 (with nothing expressed), and four 50mL cultures were inoculated with samples 7-10. The 50mL cultures were allowed to grow with shaking at 37oC until they reached an OD600 of 0.6 (approximately 3 hours). Samples 1-3 and 6-10 were immediately pelleted by centrifugation (4oC, 5000xg, 20min) and placed on ice. Samples 4 and 5 were treated as described in table above. Pellets were weighed, and resuspended in 10mL/mg wet weight of the following buffer: | ||
| + | *50mM TrisHCl (pH8.0) | ||
| + | *250mM NaCl | ||
| + | *5mM 2ME | ||
| + | In order to evaluate expression levels, 1mL of cells was removed from each culture, and analysed using SDS-PAGE (12%).<br><br> | ||
| + | |||
| + | <i>Lysis of Cells and Clearing of Cell Lysate</i><br> | ||
| + | Resuspended cell cultures were incubated on ice, and subjected to 3x20 pulse sonication bursts, with 3 minute rests on ice.<br> | ||
| + | Lysate was cleared by centrifugation (4C, 30000xg, 1 hour). Cleared cell lysate was removed and retained for fluorescent analysis.<br><br> | ||
| + | <i>Scanning of Cell Lysate using a Spectrofluorometer</i><br> | ||
| + | Using a spectrofluorometer, 3 mL of cell lysate was used for each scan. Each scan was done at 5nm excitation and 5nm emission slits. For the analysis of the expression of Förster resonance energy transfer (FRET) within the micro compartment, each cell lysate was excited at 439nm and the emission spectra was read from 444nm to 650nm. | ||
| + | |||
| + | ====Results==== | ||
| + | <i>Expression levels of Lumazine Synthase and fluorescent proteins</i><br><br> | ||
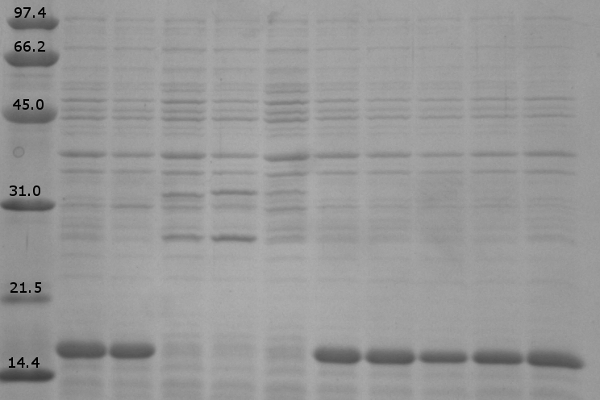
| + | Load order for the 12% denaturing polyacrylamide gel is as follows:<br> | ||
| + | # Low Range Molecular Marker | ||
| + | # K542008 – No Expression (Sample 6) | ||
| + | # K542001 – Lumazine Synthase Control (Sample 8) | ||
| + | # K331031 – YFP Control (Sample 9) | ||
| + | # K331033 – CFP Control (Sample 10) | ||
| + | # K542006 – Fluorescent Proteins (Both YFP and CFP) Control (Sample 7) | ||
| + | # K542008 – Expression of fluorescent proteins only (Sample 1) | ||
| + | # K542008 – Expression of Lumazine Synthase only (Sample 2) | ||
| + | # K542008 – Co-expression of Lumazine Synthase and fluorescent proteins (Sample 3) | ||
| + | # K542008 – Fluorescent proteins first, then Lumazine Synthase (Sample 4) | ||
| + | # K542008 – Lumazine Synthase first, then fluorescent proteins (Sample 5) | ||
| + | [[image:UolK542008ExpressionPatterns.jpg|center|400px]] | ||
| + | <b>Figure 1.</b> Expression patterns of K542008 and controls<br><br> | ||
| + | In every K542008 sample, regardless of treatment, lumazine synthase (16.6kDa) is expressed. This means that we are unable to control production of lumazine synthase as we had hoped. By altering the promoter, we hope to be able to control the production of lumazine synthase in order to evaluate how the expression patterns of lumazine synthase and arginine tagged proteins affect efficiency of co-localization of tagged proteins within the compartment.<br><br> | ||
| + | The expression of the fluorescent proteins (each approximately 27kDa) can easily been seen in lanes 2 and 3. Although it is difficult to see fluorescent proteins in K542008 samples, fluorescence observed in FRET experiments suggests that protein is expressed.<br> <br><br> | ||
| + | |||
| + | <i>FRET</i><br><br> | ||
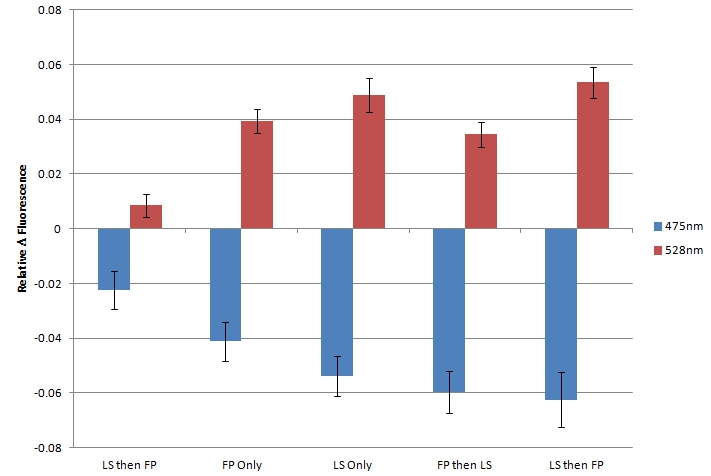
| + | By using sample 7 (fluorescent protein control; BBa_K542006) as the baseline for expression of fluorescent proteins in the cleared cell lysates, we evaluated samples 1-5 for FRET by comparing fluorescence at 475nm (CFP) and 528nm (YFP). <br> | ||
| + | [[image:UolK542008FRET.jpg|center|600px]] | ||
| + | <b>Figure 2.</b> Relative change in fluorescence at 475nm and 528nm, when excited by light at 439nm. "LS then FP" is Sample 5; "FP Only" is Sample 1; "LS Only" is Sample 2; "FP then LS" is Sample 3; "LS then FP" is Sample 4.<br><br> | ||
| + | |||
| + | In each sample, we observed a decrease in fluorescence at 475nm and a simultaneous increase in fluorescence at 528nm. We believe that this decrease in CFP fluorescence (observed at 475nm) and concomitant increase in YFP fluorescence (observed at 528nm) is indicative of FRET interactions occurring between CFP and YFP. The presence of FRET interactions naturally leads us to the conclusion that the oligo-arginine-tagged CFP and YFP are being co-localized within the lumazine synthase microcompartment. <br> | ||
| + | Within the FRET results, the condition where lumazine synthase was expressed before the fluorescent proteins were expressed shows lower levels of fluorescent change than the other conditions, suggesting that fluorescent proteins have difficulty entering the completely formed microcompartments. | ||
| + | |||
| + | ====Conclusion==== | ||
| + | |||
| + | # Proteins that have an oligo-arginine tail fused to their C-termini are localized within the microcompartment formed by the oligomerization of lumazine synthase proteins | ||
| + | # Proteins can localize within the compartment more easily when they are co-expressed with lumazine synthase | ||
| + | :::Proteins have a more difficult time entering the compartment when the compartment is fully formed | ||
| + | |||
| + | ====Discussion==== | ||
| + | While we hoped to be able to control the expression of the fluorescent proteins and lumazine synthase temporally, our SDS-PAGE gel indicates that even in the absence of IPTG, the <i>lac</i>-inducible lumazine synthase is being expressed. This means we are not able to achieve one of our conditions – fluorescent proteins expressed first, then lumazine synthase. The constant expression of lumazine synthase gave us several measurements with co-expression of lumazine synthase and fluorescent proteins. Furthermore, co-expression approximates the condition we were attempting for our first condition – namely, the formation of microcompartments around tagged proteins. We were also able to measure the condition where lumazine synthase was expressed in the absence of fluorescent proteins, which were expressed after the production of the lumazine synthase microcompartments. We interpret the results to indicating that tagged proteins have more difficulty entering pre-formed lumazine synthase microcompartments.<br><br> | ||
| + | |||
| + | ==References== | ||
| + | (1) Seebeck, F., Woycechowsky, K., Zhuang, W., Rabe, J., and Hilvert, D. (2006). A simple tagging system for protein encapsulation. Journal of the American Chemical Society. 128: 4516-4517. | ||
| + | <br><br><br> | ||
=<font color="black">Part: BBa_K542010 - Enhanced Lumazine Synthase (ELS)= | =<font color="black">Part: BBa_K542010 - Enhanced Lumazine Synthase (ELS)= | ||
| - | Datasheet for <html><a href="http://partsregistry.org/Part:BBa_K542010"><font color="blue">Part | + | Datasheet for <html><a href="http://partsregistry.org/Part:BBa_K542010"><font color="blue">Part BBa_K542010</font></a></html> in <i>E. coli</i> strain BL21 (DE3). |
<br> | <br> | ||
[[image:uoflELSdatasheet.png|center|150px]] | [[image:uoflELSdatasheet.png|center|150px]] | ||
| Line 88: | Line 218: | ||
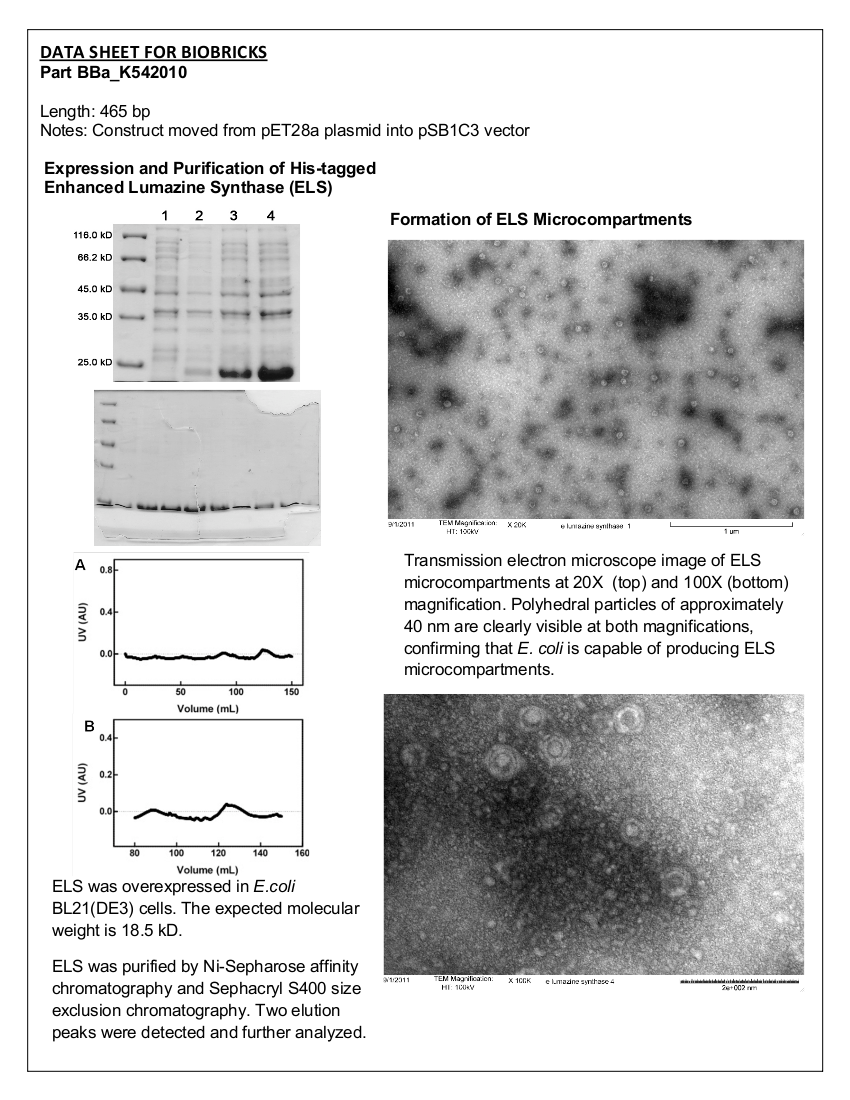
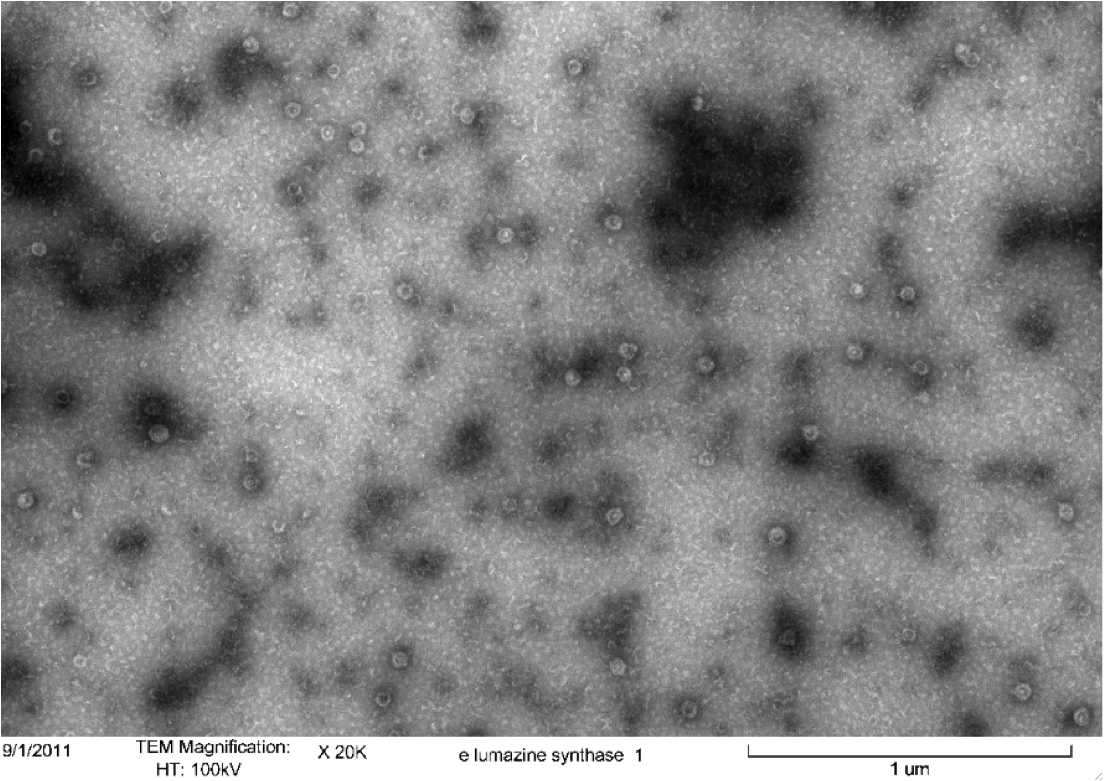
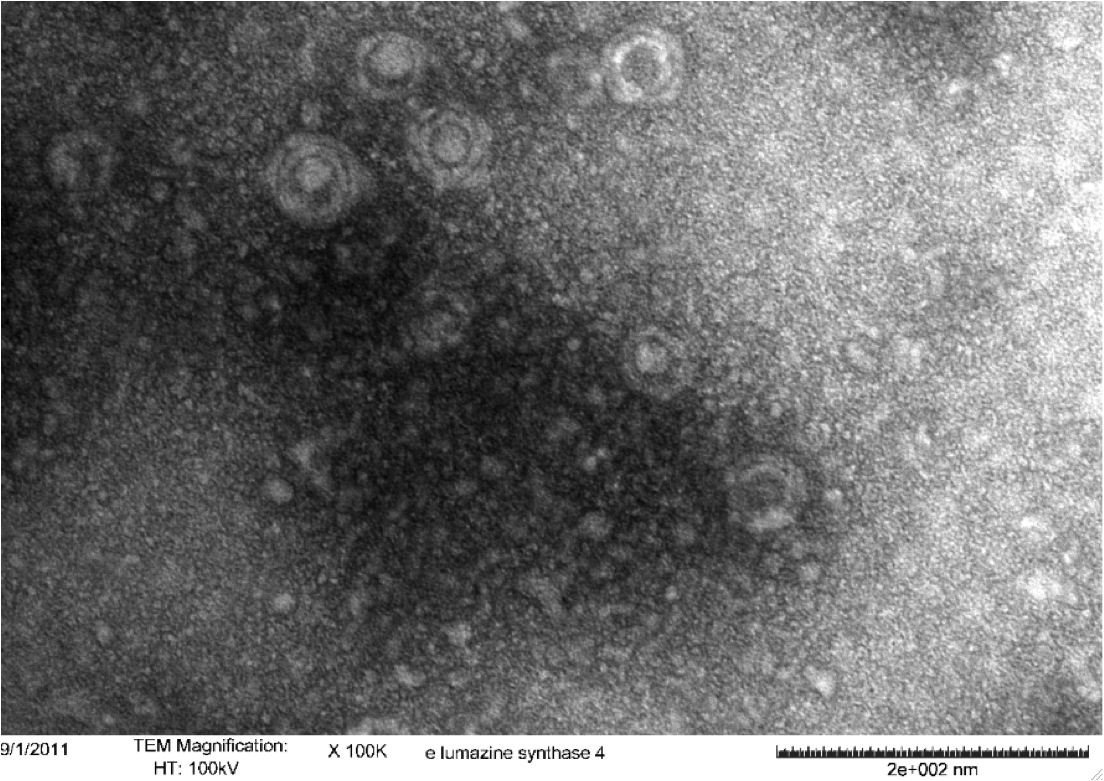
<b>Figure 5.</b> Transmission electron microscopy of Enhanced Lumazine Synthase microcompartments. Microcompartments of approximately 40 nm can be seen at x 100K magnification. | <b>Figure 5.</b> Transmission electron microscopy of Enhanced Lumazine Synthase microcompartments. Microcompartments of approximately 40 nm can be seen at x 100K magnification. | ||
====Conclusion==== | ====Conclusion==== | ||
| - | As expected, TEM micrographs show polyhedral particles of approximately 40 nm, corresponding to the size described by Wörsdörfer et al. (2011). This confirms that E. coli is capable of producing enhanced lumazine synthase. | + | As expected, TEM micrographs show polyhedral particles of approximately 40 nm, corresponding to the size described by Wörsdörfer et al. (2011). This confirms that ''E. coli'' is capable of producing enhanced lumazine synthase. |
| + | |||
==References== | ==References== | ||
(1) Viadiu H, Aggarwal AK (2000). Structure of BamHI bound to nonspecific DNA: a model for DNA sliding. Mol. Cell 5 (5): 889-895. | (1) Viadiu H, Aggarwal AK (2000). Structure of BamHI bound to nonspecific DNA: a model for DNA sliding. Mol. Cell 5 (5): 889-895. | ||
<br> | <br> | ||
| - | (2) | + | (2) Wörsdörfer, B., Woycechowsky, K.J., and Hilvert, D. (2011). Directed Evolution of a Protein Container. Science. 331: 589-592. |
| + | <br><br><br> | ||
| + | =<font color=”black”>Part: BBa_K542009 – Antigen 43= | ||
| + | Datasheet for <html><a href="http://partsregistry.org/Part:BBa_K542009"><font color="blue">Part BBa_K542009</font></a></html> in <i>E. coli</i> strain BL21 (DE3). | ||
| + | <br><br> | ||
| + | [[image:uoflag43datasheet.png|center|150px]] | ||
| + | ==Introduction== | ||
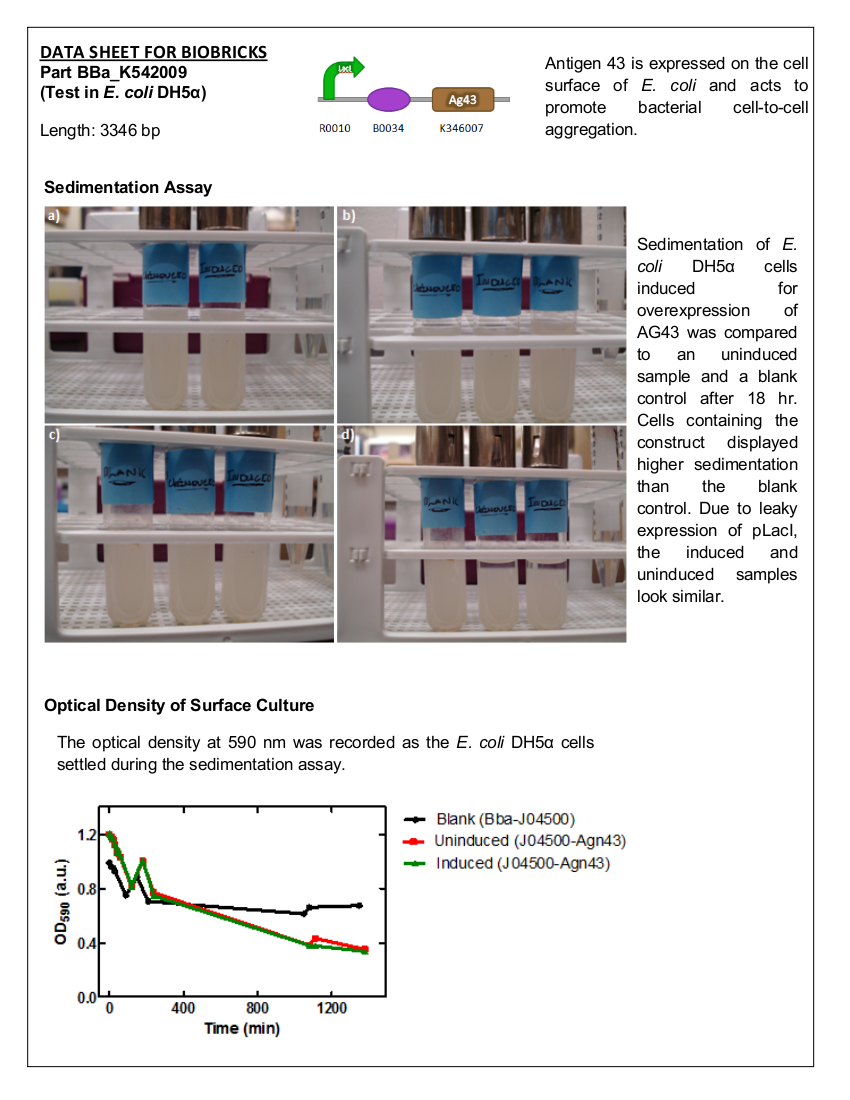
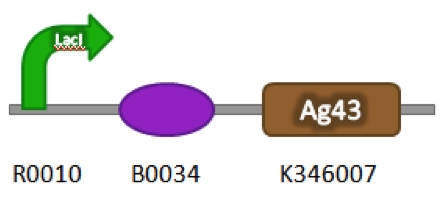
| + | The Peking 2010 iGEM team characterized Antigen 43 (AG43) using a T7 promoter expression system in <i>E. coli</i> BL21(DE3) strain and submitted the coding sequence with no promoter or ribosome binding site (RBS) to the parts registry (BBa_K364007). In order for AG43 to be used, BBa_K542009 was assembled to include the required regulatory elements. The pLacI promoter and RBS were added to the coding sequence for AG43. | ||
| + | ==Construct== | ||
| + | Part Number: BBa_K542009 | ||
| + | [[image:uoflagfigure1.png|center|400px]] | ||
| + | <br><br> | ||
| + | <b>Figure 1.</b> BBa_K542009. The inductive aggregation construct was made by assembling BBa_J04500 and BBa_K346007. | ||
| + | ==Sedimentation by Antigen 43== | ||
| + | <i>E. coli</i> DH5α cells expressing BBa_K542009 were monitored for sedimentation and compared to sedimentation of uninduced cells. | ||
| + | ===Materials and Methods=== | ||
| + | Overnight cultures <i>E. coli</i> DH5α containing BBa_K542009 or BBa_J04500 (blank control) were grown with the appropriate antibiotics. Three 50 mL LB cultures – BBa_J04500 (control), BBa_K542009 (induced), and BBa_K542009 (uninduced) – with the appropriate antibiotics were inoculated to an OD<sub>600</sub> of 0.1 and incubated at 37°C with shaking. | ||
| + | <br><br> | ||
| + | At OD<sub>600</sub> of 0.4-0.6, the cultures were induced (excluding one of the BBa_K542009 cultures) with IPTG to a concentration of 0.001% and growth was monitored to a final OD<sub>600</sub> of 1. The cells were centrifuged at 5000 x g for 5 min and the supernatant discarded. The cells were resuspended with 5 mL of 1% PBS (with 0.15 mM NaCl) and transferred into test tubes. The cells in the test tubes were agitated and 100 µL was taken ~0.5 cm from the surface every 10 min for the first 60 min; then every hour for the next 3 hours and again at 18 hours and 18.5 hours. The samples were also subjected to OD<sub>590</sub> measurements using a microplate and the SoftMax Pro Software. | ||
| + | ===Results=== | ||
| + | [[image:uoflagfigure2.png|center|400px]] | ||
| + | <br><br> | ||
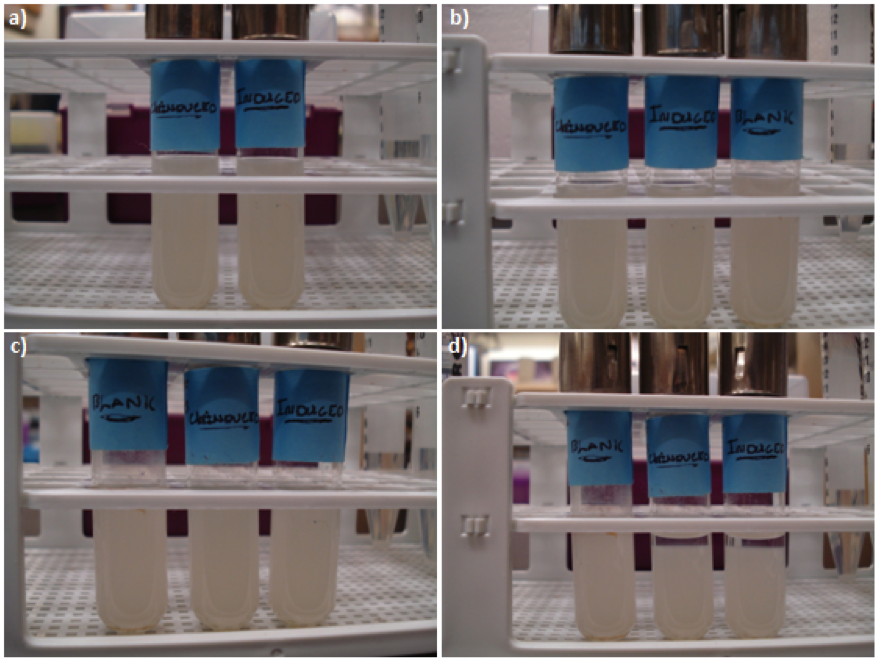
| + | <b>Figure 2.</b> <i>E. coli</i> DH5a cells containing BBa_K542009. Cultures were first agitated and then sedimentation rates were monitored. (a) Initial reading at the beginning of the experiment for the induced and uninduced. (b) Initial reading for the blank and 30 min after agitation for the induced and uninduced. (c) 3.5 hr after agitation for the blank and 4 hr after agitation for the induced and uninduced. (d) 17.5 hr after agitation for the blank and 18 hr after agitation for the induced and uninduced. | ||
| + | <br><br> | ||
| + | [[image:uoflagfigure3.png|center|400px]] | ||
| + | <br><br> | ||
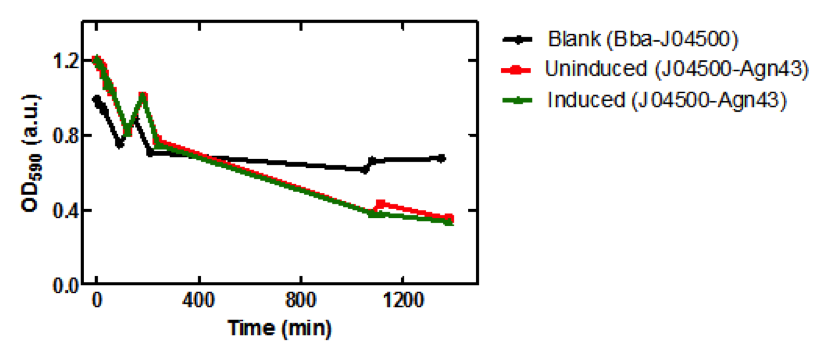
| + | <b>Figure 3.</b> Microplate readings at 590nm for samples taken from the sedimentation assay using SoftMax Pro Software. Increase in absorbance at 150 min may have been due to the aggregation of the cells on the microplate prior to taking the measurement. | ||
| + | ===Conclusion=== | ||
| + | There is a significant difference between the aggregation of cells with the Antigen43 construct (BBa_K542009) and the cells without the construct after 18 hours. The pLacI promoter is known to be leaky. This was illustrated by the similarity between the uninduced and induced samples (Figures 2 and 3). These experiments support the conclusion that BBa_K542009 works as expected and the induced cells exhibit sedimentation. | ||
| + | <br><br><br> | ||
| - | =<font color="black">Part: BBa_I716462 – <i>Bam</i>= | + | =<font color="black">Part: BBa_I716462 – <i>Bam</i>HI= |
| - | + | ||
Datasheet for <html><a href="http://partsregistry.org/Part:BBa_I716462"><font color="blue">Part BBa_I716462</font></a></html> in <i>E. coli</i> strain DH5alpha. | Datasheet for <html><a href="http://partsregistry.org/Part:BBa_I716462"><font color="blue">Part BBa_I716462</font></a></html> in <i>E. coli</i> strain DH5alpha. | ||
[[image:uoflBamHIdatasheet.png|100px|center]] | [[image:uoflBamHIdatasheet.png|100px|center]] | ||
| - | |||
==Introduction== | ==Introduction== | ||
| - | + | Part I716462 was previously characterized by the UC Berkeley iGEM team in 2007. The purpose of this part was to prevent unwanted cell proliferation by engineering a genetic self-destruct mechanism into bacteria that upon induction would express a genetic material-degrading toxin, the endonuclease BamHI that would kill cells yet preserve their physical integrity. <i>Bam</i>HI has a restriction cut site of G'GATCC, generating sticky ends (1). The restriction endonuclease was placed under the control of the arabinose- inducible promoter, pBAD. In 2007, the UC Berkeley iGEM team was able to show that cells lost their ability to reproduce but did not lyse upon induction with arabinose (2). The University of Lethbridge 2011 iGEM team wished to further characterize this part to degrade the genomic DNA of E. coli in order to have a functional chassis for our tailings pond clean-up kit without the risk of DNA contamination. In this way, tight control and regulation over our engineered bacterial cells is possible. | |
| - | Part I716462 was previously characterized by the UC Berkeley iGEM team in 2007. The purpose of this part was to prevent unwanted cell proliferation by engineering a genetic self-destruct mechanism into bacteria that upon induction would express a genetic material-degrading toxin, the endonuclease BamHI that would kill cells yet preserve their physical integrity. | + | <br><br> |
| - | + | Registry Entry - BBa_I716462 | |
| + | <br><br> | ||
| + | Length – 1918 bp | ||
==Characterization== | ==Characterization== | ||
===Cell Survival=== | ===Cell Survival=== | ||
| Line 110: | Line 270: | ||
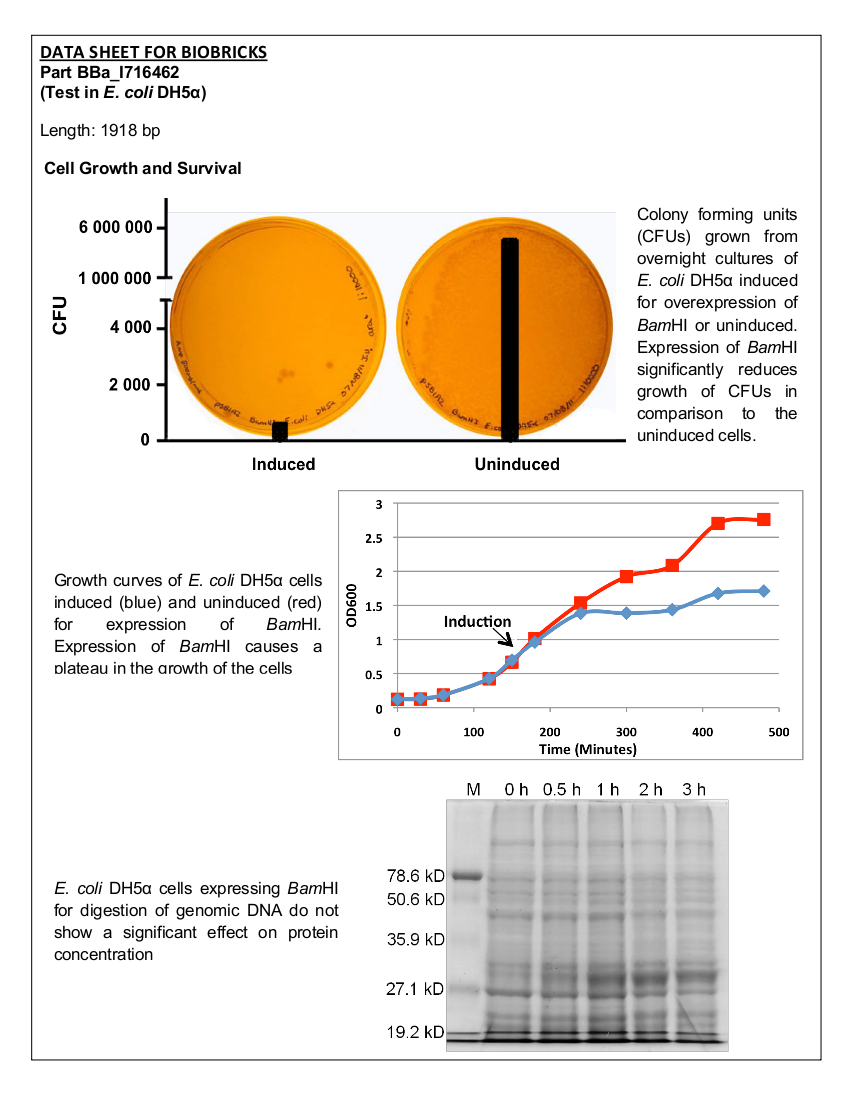
The <i>Bam</i>HI construct was overexpressed in <i>E. coli</i> DH5α cells. Cultures were induced with arabinose at an OD<sub>600</sub> of 0.6 and grown overnight. Samples of the induced culture and an uninduced culture were plated on LB agar plates to monitor growth of colony forming units. | The <i>Bam</i>HI construct was overexpressed in <i>E. coli</i> DH5α cells. Cultures were induced with arabinose at an OD<sub>600</sub> of 0.6 and grown overnight. Samples of the induced culture and an uninduced culture were plated on LB agar plates to monitor growth of colony forming units. | ||
====Results==== | ====Results==== | ||
| - | [[image:uoflBamHIgrowthcurve.png|center]] | + | [[image:uoflBamHIgrowthcurve.png|center|400px]] |
<br><br> | <br><br> | ||
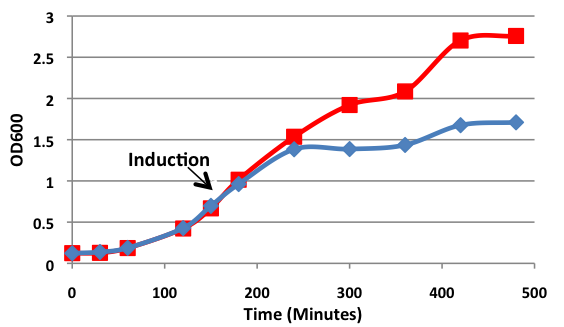
| - | <b>Figure 1.</b> | + | <b>Figure 1.</b> Growth curves of <i>E. coli</i> DH5α cells induced (blue) and uninduced (red) for expression of <i>Bam</i>HI. Cultures were induced at an OD<sub>600</sub> of 0.60. |
<br><br> | <br><br> | ||
| - | [[image:uoflBamHICFU.png|center]] | + | [[image:uoflBamHICFU.png|center|400px]] |
<br><br> | <br><br> | ||
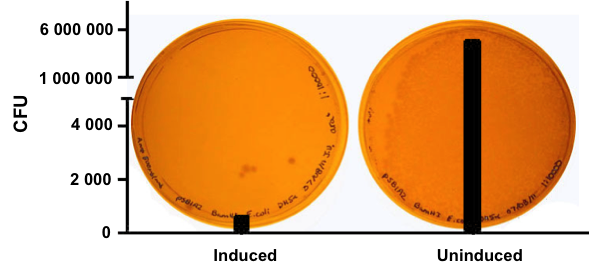
| - | <b>Figure 2. </b><i>E.coli</i>DH5α cells containing the <i>Bam</i>HI construct from overnight cultures. The samples were plated on LB agar plates and the number of colony forming units (CFU) was counted. Left: culture induced for | + | <b>Figure 2. </b><i>E. coli</i> DH5α cells containing the <i>Bam</i>HI construct from overnight cultures. The samples were plated on LB agar plates and the number of colony forming units (CFU) was counted. Left: culture induced for <i>Bam</i>HI expression with arabinose, right: uninduced culture. |
===Analysis of Genomic DNA=== | ===Analysis of Genomic DNA=== | ||
====Materials and Methods==== | ====Materials and Methods==== | ||
| - | <i>E. coli</i> DH5α cells were grown and induced to overexpress one of three samples: <i>Bam</i>HI construct induced with arabinose ( | + | <i>E. coli</i> DH5α cells were grown and induced to overexpress one of three samples: <i>Bam</i>HI construct induced with arabinose (10µM) at an OD<sub>600</sub> of 0.6, <i>Bam</i>HI construct uninduced, non-<i>Bam</i>HI construct induced with arabinose (10µM) at OD<sub>600</sub> of 0.6. Cells were grown in LB media with 100 ng/mL ampicillin. |
<br><br> | <br><br> | ||
| - | Qiagen Blood and Tissue Kit was used to isolate the genomic DNA of gram-negative bacteria. A 0.8% agarose gel was ran at 150 V for 90 minutes to separate the genomic DNA of <i>E. coli</i> DH5α cells collected at different time points (pre-induced and 30 min, 1 hr, 2 hr, and 3 hr post induction) for all three samples. | + | Qiagen Blood and Tissue Kit was used to isolate the genomic DNA of gram-negative bacteria. A 0.8% agarose gel was ran at 150 V for 90 minutes to separate the genomic DNA of <i>E. coli</i> DH5α cells collected at different time points (pre-induced and 30 min, 1 hr, 2 hr, and 3 hr post induction) for all three samples. One absorbance unit of cells were collected and analyzed by SDS-PAGE to monitor cellular protein levels. |
====Results==== | ====Results==== | ||
| - | [[image:uoflBamHIgenomicDNA.png|center]] | + | [[image:uoflBamHIgenomicDNA.png|center|400px]] |
<br> | <br> | ||
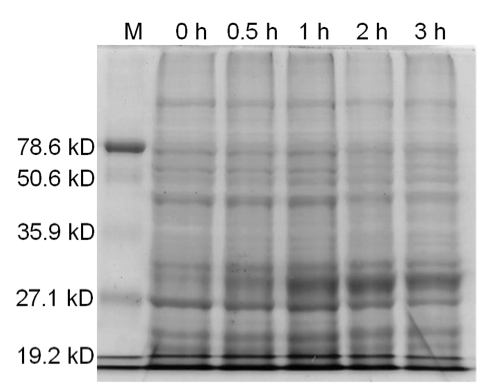
| - | <b>Figure 3.</b> | + | <b>Figure 3.</b> Induced <i>Bam</i>HI. 12% SDS-PAGE of cell lysate from <i>E. coli</i> DH5α cells containing BBa_I716462 induced for overexpression of <i>Bam</i>HI. Left to right: protein marker, 0 h, 0.5 h, 1 h, 2 h, and 3 h after induction with lactose. |
| - | + | [[image:uoflBamHIfigure4.png|center|400px]] | |
| - | + | ||
| - | + | ||
<br> | <br> | ||
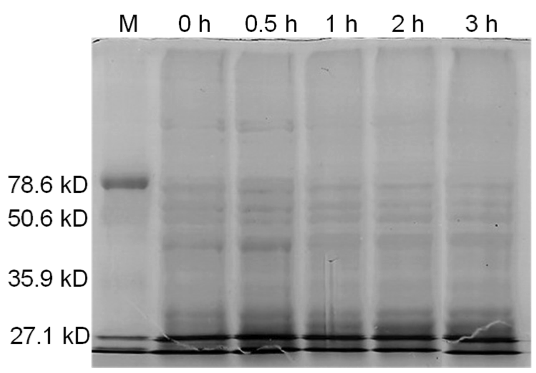
| - | + | <b>Figure 4.</b> Induced <i>Bam</i>HI. 12% SDS-PAGE of cell lysate from uninduced <i>E. coli</i> DH5α cells containing BBa_I716462. Left to right: protein marker, 0 h, 0.5 h, 1 h, 2 h, and 3 h after induction with lactose. | |
| - | + | <br><br> | |
| + | [[image:uoflBamHIfigure5.png|center|400px]] | ||
| + | <br> | ||
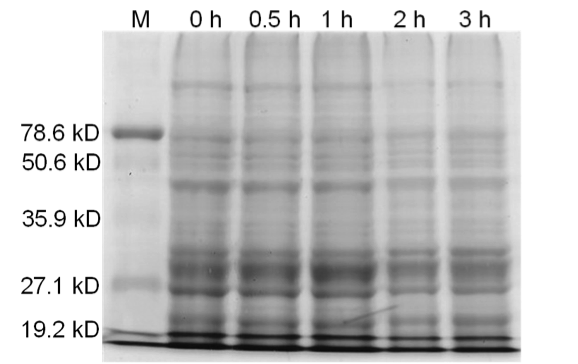
| + | <b>Figure 5.</b> Uninduced <i>Bam</i>HI. 12% SDS-PAGE of cell lysate from <i>E. coli</i> DH5α cells. Left to right: protein marker, 0 h, 0.5 h, 1 h, 2 h, and 3 h after induction with lactose. | ||
| + | <br><br> | ||
| + | ==Conclusion== | ||
| + | Upon induction with arabinose, <i>E. coli</i> DH5α cells containing the <i>Bam</i>HI construct did not reproduce as the overexpression of the <i>Bam</i>HI endonuclease digested the genomic DNA of the host cell. This is why in Figure 2 there are only 4 colonies seen as opposed to the control which shows a lawn of growth. In Figure 1, the optical density of the <i>Bam</i>HI expressing cells reaches a plateau; however, the same sample which has not been induced kept increasing, which indicates that the expression of <i>Bam</i>HI is affecting normal growth of the cells. | ||
| + | <br><br> | ||
| + | Samples analyzed by SDS-PAGE after induction of <i>Bam</i>HI expression show that protein concentration is not significantly affected (Figures 3-5). | ||
==References== | ==References== | ||
| - | |||
(1) Viadiu H, Aggarwal AK (2000). Structure of BamHI bound to nonspecific DNA: a model for DNA sliding. Mol. Cell 5 (5): 889-895. | (1) Viadiu H, Aggarwal AK (2000). Structure of BamHI bound to nonspecific DNA: a model for DNA sliding. Mol. Cell 5 (5): 889-895. | ||
<br> | <br> | ||
| - | (2) iGEM 2007. (2011, May 10). BerkiGEM2007Present5. Retrieved from | + | (2) iGEM 2007. (2011, May 10). BerkiGEM2007Present5. Retrieved from https://2007.igem.org/BerkiGEM2007Present5. |
| + | <br><br><br> | ||
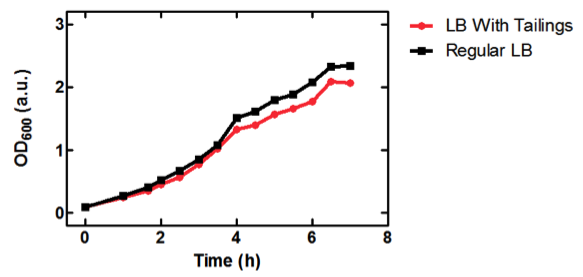
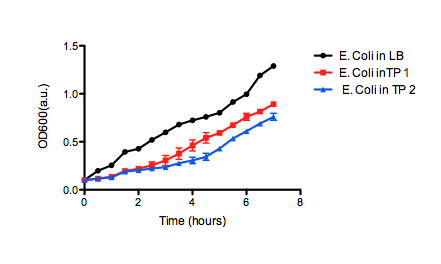
| + | =Collaboration - Cell Viability in Tailings Pond Water= | ||
| + | We were asked by the Calgary iGEM team to to test the viability of their chassis to survive in tailings pond water. If <i>E. coli</i> DH5α cells containing one of their constructs can grow normally in medium prepared with tailings water, we can be confident that the chassis can be applied to tailings pond water in general. | ||
| + | ==Materials and Methods== | ||
| + | 50 mL of LB medium was made with tailings water and filtered through MILLEX filter Unit GS MF-Millipore MCE Membrane 0.22 µm in order to sterilize it and appropriate antibiotics were added. The tailings LB was inoculated with <i>E. coli</i> DH5α cells containing BBa_K331009 to an OD<sub>600</sub> of 0.1. The flask was incubated at 37˚C with shaking for 7 hours, during which photometric readings were taken every 30. Photometric readings were taken using the Pharmacia Biotech Ultrospec 3000, as the OD<sub>600</sub> readings reached 1.0 the solutions was diluted with LB media to keep the OD<sub>600</sub> reading between 0.1 and 1.0. The same protocol was used to observe cell growth of <i>E. coli</i> DH5α cells containing BBa_K331009 in 50 mL of LB medium made with MilliQ H<sub>2</sub>O. | ||
| + | ==Results== | ||
| + | [[image:uofltailings.png|center|400px]] | ||
| + | <b>Figure 1.</b> OD<sub>600</sub> of <i>E. coli</i> DH5α cells containing BBa_K331009 cultured in LB medium made with tailings water (red) and LB medium made with MilliQ H<sub>2</sub>O (black). Performed by our team. | ||
| + | <br><br> | ||
| + | [[image:uofltailings2.png|center|400px]] | ||
| + | <b>Figure 2.</b> OD<sub>600</sub> of <i>E. coli</i> DH5α cells containing BBa_K331009 cultured in LB medium made with tailings water (red and blue) and LB medium made with MilliQ H<sub>2</sub>O (black). Performed independently by the 2011 Calgary iGEM Team. | ||
| + | ==Conclusion== | ||
| + | As seen in Figure 1, <i>E. coli</i> DH5α cells were able to grow in LB medium made with tailings water, suggesting that the chassis will survive for use in tailings pond water. | ||
<br> | <br> | ||
<br> | <br> | ||
Latest revision as of 17:06, 12 April 2012
|
|
|
|---|
 "
"


