Team:UC Davis/LacI
From 2011.igem.org
(Difference between revisions)
| (15 intermediate revisions not shown) | |||
| Line 18: | Line 18: | ||
<h1>LacI</h1> | <h1>LacI</h1> | ||
<div class="floatbox3"> | <div class="floatbox3"> | ||
| - | <p> | + | <p><iframe src="http://player.vimeo.com/video/27753866?title=0&byline=0&portrait=0" width="400" height="300" frameborder="0" align="left" style="margin-right:15px"></iframe>The lac repressor is responsible for regulating the metabolism of lactose. In the absence of lactose, LacI forms a tetramer with identical subunits which appears as two dimers. Each dimer binds in the major groove of the DNA binding region which subsequently blocks the RNA polymerase from binding. In nature, allolactose will bind the repressor leading to transcription of the lac operon. Using IPTG as an inducer has the same effect as allolactose. </p> |
| - | <p>To the | + | <p>To the left is a small render of the LacI tetramer bound to its operator.</p> |
</div> | </div> | ||
| Line 32: | Line 32: | ||
<div class="floatbox2"> | <div class="floatbox2"> | ||
| - | <h2>Mutant | + | <h2>Mutant Screening</h2> |
<center> | <center> | ||
<a href="https://static.igem.org/mediawiki/2011/d/d9/UCD_Mut_graph_lacI.png"> | <a href="https://static.igem.org/mediawiki/2011/d/d9/UCD_Mut_graph_lacI.png"> | ||
| Line 39: | Line 39: | ||
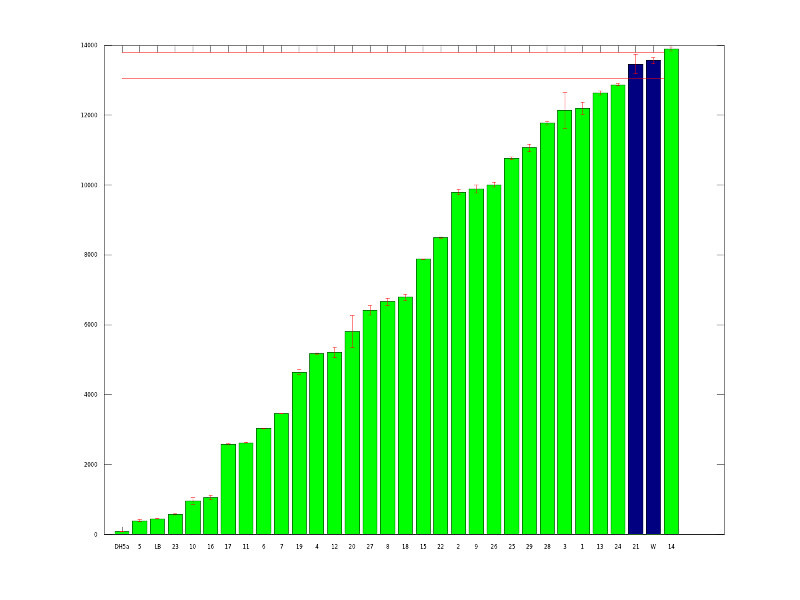
The above graph shows our initial mutants. We picked 87 potential mutants from transformation plates and ran them in our plate reader to quantitatively measure fluorescence. The green bars represent variants that are at least 1.5 standard deviations from the average wildtype expression level.<br><br> | The above graph shows our initial mutants. We picked 87 potential mutants from transformation plates and ran them in our plate reader to quantitatively measure fluorescence. The green bars represent variants that are at least 1.5 standard deviations from the average wildtype expression level.<br><br> | ||
<center> | <center> | ||
| - | <a href=" | + | <a href="http://farm7.static.flickr.com/6025/6190729663_9400b621df_b.jpg"> |
| - | <img src="http://farm7.static.flickr.com/6025/6190729663_9400b621df_b.jpg" width="400" height=" | + | <img src="http://farm7.static.flickr.com/6025/6190729663_9400b621df_b.jpg" width="400" height="212"></a><br><br> |
</center> | </center> | ||
| - | After gathering this data, we picked 29 mutants which represented a good range of expression. From there we did more fluorescence tests to obtain a final 7 mutants. After choosing our mutants, we did more rigorous characterization as outlined on our Data page.<br><br> | + | After gathering this data, we picked 29 mutants which represented a good range of expression. From there we did more fluorescence tests to obtain a final 7 mutants. After choosing our mutants, we did more rigorous characterization as outlined on our<a href="https://2011.igem.org/Team:UC_Davis/Data"> Data page</a>.<br><br> |
</div> | </div> | ||
<div class="floatbox2"> | <div class="floatbox2"> | ||
| - | <h2>DNA | + | <h2 id="dnaseq">DNA Sequences</h2> |
<center> | <center> | ||
<img src="https://static.igem.org/mediawiki/2011/9/9f/UCD_R10mut_seq_REDMUTS_09242011.png"> | <img src="https://static.igem.org/mediawiki/2011/9/9f/UCD_R10mut_seq_REDMUTS_09242011.png"> | ||
</center><br><br> | </center><br><br> | ||
| - | The sequences above show our 7 LacI mutants. There are between 1 and 7 mutations in each sequence as indicated by the red bases. All 7 sequences have mutations between bases 100 and 200 which | + | The sequences above show our 7 LacI mutants. There are between 1 and 7 mutations in each sequence as indicated by the red bases. All 7 sequences have mutations between bases 100 and 200 which contain the known locations of the CAP binding site(bases 88-127) and LacI binding site (bases 166-200). |
| + | |||
| + | Read more about our mutants on their Parts Registry pages. | ||
| + | <ul> | ||
| + | <li><a href="http://partsregistry.org/Part:BBa_K611021">Mutant 1 BBa_K611021</a> </li> | ||
| + | <li><a href="http://partsregistry.org/Part:BBa_K611022">Mutant 2 BBa_K611022</a> </li> | ||
| + | <li><a href="http://partsregistry.org/Part:BBa_K611023">Mutant 3 BBa_K611023</a> </li> | ||
| + | <li><a href="http://partsregistry.org/Part:BBa_K611024">Mutant 4 BBa_K611024</a> </li> | ||
| + | <li><a href="http://partsregistry.org/Part:BBa_K611025">Mutant 5 BBa_K611025</a> </li> | ||
| + | <li><a href="http://partsregistry.org/Part:BBa_K611026">Mutant 6 BBa_K611026</a> </li> | ||
| + | <li><a href="http://partsregistry.org/Part:BBa_K611027">Mutant 7 BBa_K611027</a> </li> | ||
| + | </ul> | ||
| + | |||
</div> | </div> | ||
Latest revision as of 02:31, 29 September 2011
Start a Family
Got a favorite BioBrick? Check our our process for expanding basic parts into part families.Criteria
View our judging criteria for iGEM 2011 here.
LacI
The lac repressor is responsible for regulating the metabolism of lactose. In the absence of lactose, LacI forms a tetramer with identical subunits which appears as two dimers. Each dimer binds in the major groove of the DNA binding region which subsequently blocks the RNA polymerase from binding. In nature, allolactose will bind the repressor leading to transcription of the lac operon. Using IPTG as an inducer has the same effect as allolactose.
To the left is a small render of the LacI tetramer bound to its operator.
Mutant Screening

The above graph shows our initial mutants. We picked 87 potential mutants from transformation plates and ran them in our plate reader to quantitatively measure fluorescence. The green bars represent variants that are at least 1.5 standard deviations from the average wildtype expression level.

DNA Sequences

The sequences above show our 7 LacI mutants. There are between 1 and 7 mutations in each sequence as indicated by the red bases. All 7 sequences have mutations between bases 100 and 200 which contain the known locations of the CAP binding site(bases 88-127) and LacI binding site (bases 166-200). Read more about our mutants on their Parts Registry pages.
 "
"


