Team:Calgary/Project/Promoter/Bioinformatics
From 2011.igem.org
| (96 intermediate revisions not shown) | |||
| Line 6: | Line 6: | ||
<html> | <html> | ||
| - | < | + | <!-- --> |
| - | < | + | <h2>Introduction</h2> |
| - | < | + | <p>Several species of bacteria have been found to survive in toxic tailing pond environments. Only recently however, have environmental researchers begun to identify the strains and species of these microorganisms. In a study directed by Moore <i>et al.</i> 2006, two species of <i> Pseudomonas</i> (<i>putida</i> and <i>fluorescens</i>) were shown to degrade naphthenic acids in co-culture to a much greater degree than culturing each species individually. The percentage of remaining naphthenic acids in a solution after four weeks of bacteria culturing is shown in Figure 1.</p> |
| - | + | </html>[[image:Calgary2011_Del_Rio_NA_Degradation.JPG|thumb|600px|center|<b>Figure 1</b> Naphthenic Acid Degradation Profile after 4 weeks of degradation by <i> Pseudomonas </i> strains LD1 and LD2. Source: Del Rio, Hadwin, Pinto, MacKinnon, & Moore, 2006]]<html> | |
| + | <p>This result would suggest that each strain of <i>Pseudomonas</i> provides a unique set of degradation machinery (likely in the form of enzymes) to complete the breakdown of naphthenic acids. Figure 2 shows how the degradation affected the concentrations of specific naphthenic acids of varying carbon number and saturation, as measured by GC-MS. The chart on the left of figure 2 shows the initial concentrations of each of the naphthenic acids, and the chart on the right shows the concentration of the naphthenic acids after four weeks of a LD1-LD2 co-culture. Based on the decreased height and scale, the figure demonstrates that naphthenic acids were more or less indiscriminately degraded by the co-culture. In terms of the development of a detection system for naphthenic acids, the indescriminate nature of this degradation would be advantageous in detecting a large group of NAs. | ||
| + | </html>[[image:Calgary2011_Del_Rio_Degradation_Profile.JPG|thumb|600px|center|<b>Figure 2</b> Naphthenic acid degradation profile after 4 weeks of degradation, shown with respect to saturation and carbon numbers. Source: Del Rio, Hadwin, Pinto, MacKinnon, & Moore, 2006]]<html> | ||
| + | <p></p> | ||
| + | <p>When both figure 1 and 2 are taken together, the most likely conclusion is that the genes responsible for the degradation are spread across the two species. Furthermore, there exists a collection of essential genes in this degradation pathway which are unique to one species and not present in the other. The degradation pathway has not been experimentally confirmed, but it is believed to be a metabolic pathway which involves beta-oxidation (Moore <i>et al.</i> 2006). The promoters upstream of these essential genes would be likely places to find a naphthenic acid promoter. A weakness of the bioinformatics search was that LD1 and LD2 have not yet been sequenced, and therefore we assume similarity between them and corresponding strains that have been sequenced; this weakness complicated primer design but was not prohibitive to the project.</p> | ||
| + | <h2>Abstract</h2> | ||
| + | <p>Three online databases (<a href="http://darkhorse.ucsd.edu/">DarkHorse</a>, <a href="http://157.86.176.108/ProteinWorldDB/index.php">ProteinWorld DB</a>, and <a href="http://www.pseudomonas.com/">Pseudomonas.com</a>) were used to find target gene candidates <i>in silico</i>, and a fourth (<a href="http://mummer.sourceforge.net/">MUMmer</a>) was used to confirm experimental hypotheses. Using the data from these sources, we were able to construct a short list of gene candidates which were then processed through a quantitative Real-Time Polymerase Chain Reaction (qRT-PCR) to verify gene expression as a response to naphthenic acids. The qRT-PCR found that a putative Enoyl CoA Hydratase (GeneID=YP_260124), from <i>Pseudomonas fluorescens</i>, was expressed as a response to naphthenic acids. </p> | ||
| + | <h2>DarkHorse and ProteinWorld DB Results</h2> | ||
| + | <p><a href="http://darkhorse.ucsd.edu/">DarkHorse</a> is an online database for finding phylogenetically atypical proteins in various microbial species. Generally, phylogenetic atypicality can be useful for predicting the horizontal transfer of genes; for our purposes, the algorithm identified relatively unique genes for various strains of <i>Pseudomonas putida</i> and <i>fluorescens</i>. We conjectured that genes also found in tailing pond microorganisms, or involved in the degradation of naphthenic acids and similar acids, were the most suitable for further investigation. DarkHorse uses only genomic DNA and does not include any of the super plasmids (up to 100kb) known to be carried by different strains of <i>Pseudomonas</i>. The exclusion of these superplasmids limit the scope of our screening, but allowed us to focus on investigating the roles of the gene candidates and their source species in relevant degradation pathways.</p> | ||
| + | </html>[[image:Calgary2011_Dark_Horse_Sample_Window.jpg|thumb|600px|center|<b>Figure 3</b> Diagram showing how to search for horizontally transferred genes using the DarkHorse database. Source: http://darkhorse.ucsd.edu/search.shtml</a>.</p>]]<html> | ||
| + | <p>Figure 3 shows a sample of the input used for our DarkHorse Query. The list returned by querying the database for phylogenetically atypical genes in LD1 and LD2 was 258 records long. Each record contained the GI number, strain, and gene annotation for the query species and its best phylogenetic match. To sort through the data, we started by collecting data about the best match species and the gene annotations. Using the data about the species, we found that some of them had known degradation pathways and were naturally occurred in tailings ponds. We were especially interested in such species when they donated a predicted transcription factor or degrative enzyme related to fatty acid degradation. Fatty acids are structurally similar to naphthenic acids and therefore may have similar promoters, or enzymes that would interact with this class of compounds. One putative short-listed gene, enoyl CoA hydratase, was selected due to its very low RPI score (0.001) - which suggests a strong likelihood that it was horizontally transferred - and also because of it was a member of a gene family involved in degrading compounds similar to naphthenic acids, such as caffeic and cinnanoic acid (Fiedler <i>et. al.</i> 2004 Journal of Applied Microbiology). A predicted Acyl-CoA-ligase with a LPI score of 0.401 also appeared to be involved in caffeic acid degradation, and was also short-listed. To view our DarkHorse bioinformatics results as a whole please <a href="https://2011.igem.org/File:UofC2011_DarkHorse.pdf">click here</a>. </p> | ||
| + | <p>Additionally we used <a href="http://157.86.176.108/ProteinWorldDB/index.php">Protein World DB</a>, a database for finding unique genes across a set of compared species. This program was useful for identifying potential metabolic genes unique to one species, which our hypothesis suggested is the case for the desired promoter. We used the only available <i>Pseudomonas</i> strains in their registry, <i>putida</i> KT2440 and <i>fluorescens</i> Pf-5, in our search.</p> | ||
| + | </html>[[image:Calgary2011_ProteinWorld_Sample_Window.jpg|thumb|600px|center|<b>Figure 4.</b>Picture showing the layout of the ProteinWorld database website. Source: <a href="http://darkhorse.ucsd.edu/search.shtml">http://darkhorse.ucsd.edu/search.shtml/</a>]]<html> | ||
| + | <p>ProteinWorld DB returned 55 unique hits for both species of bacteria. Visual inspection and classification of these hits revealed a number of transcription factors known to be involved metabolic signaling in a variety of other organisms. In particular, two LysR based transcription factors, and a theoretical protein seemed to BLAST against other known transcription factors found in various species of bacteria. What was interesting, was the involvement of these transcription factor hits in metabolic pathways particularly in beta-oxidation. For this reason, we added these to a list for further examination. A thioesterase which might also be involved in naphthenic acid degradation was also short-listed onto our list. Please <a href="https://2011.igem.org/File:UofC2011_ProteinWorld.pdf">click here</a> for a complete list of our Protein World DB hits.</p> | ||
| - | < | + | <p>After examining both the DarkHorse and Protein World DB hits, our team was able to short-list six genes which we thought to be potentially involved in naphthenic acid detection and potentially degradation. These genes are listed below:</p> |
| - | + | ||
| + | </html>[[image:Calgary2011_qRT_PCR_List1.jpg|thumb|600px|center|<b>Figure 5. </b>List of genes short-listed for qRT-PCR verification, as queried from DarkHorse and ProteinWorldDB.]]<html> | ||
| + | |||
| + | <h2>Quantitative RT-PCR Results</h2> | ||
| + | |||
| + | <p>In order to validate that our short-listed genes were involved in naphthenic acid sensing, we designed and implemented a qRT-PCR approach to analyzing changes in mRNA expression for these genes in the prescence of naphthenic acids. </p> | ||
| + | |||
| + | <p>Untreated cells and cells treated with 80mg/L of NAs were subjected to Qiagen RNA bacterial extraction protocol (see protocols section). Reverse transcription PCR using random primers and Reverse Transcriptase was performed to generate cDNAs from RNA.</p> | ||
| + | |||
| + | <p>The cDNAs generated were then used for quantitative real time PCR (qRT-PCR). During the PCR, we used primers which specifically bound to the transcribed region of the each gene, generating small DNA sequences later bound by SYBR Green, a DNA binding fluorophore. The binding of SYBR is directly proportional to the amount of DNA generated in the PCR reaction. A fluorescent scanner in the qRT-PCR machine periodically measures the fluorescence of the reaction as the PCR proceeds. Initial concentrations are regressively and indirectly determined when the fluorescence passes a predefined intensity threshold. The threshold is known as a the concentration threshold (Ct), and the Ct value refers to the cycle at which this threshold is surpassed. Because the amount of DNA in a PCR doubles every cycle, the Ct value can be used to determine the amount of cDNA, and therefore mRNA, produced as a result of reverse transcription and gene transcription respectively. As a further control, differences in transcription of a tested gene are normalized to the transcription of a control gene expressed at the same rate in both treated and untreated samples. Control genes are generally transcripts that do not vary significantly with different treatments. If the Ct value of candidate genes differ from each other more than the control genes, then the evidence suggests that the differences in expression are a result of the treatment given to the cells. </p> | ||
| + | |||
| + | </html>[[Image:UofC2011_ECHdissociation_curve.jpg|thumb|300px|center|<b>Figure 6</b> RT-PCR melt curve of ECH primer set with LD2 cDNA ]]<html> | ||
| + | |||
| + | <p>Before conclusions can be drawn, it is important to determine if the primers accurately represent the changes in RNA levels of one gene exclusively. The quality of the primer can be determined using a melt curve. If the primers work properly, then a melt curve analysis will yield only one melting point. In an effort to characterize the primers, RT-PCR was used with some of the previously synthesized cDNA. The primer set ECH (Enoyl-CoA Hydratase) demonstrated that the Ct values proportionately changed with different cDNA levels of the strain LD2, as demonstrated in figure 6. The ECH primers showed a strong dissociation curve with a single peak suggesting that a single target was being synthesized. Primers used for ECH were as follows:</p> | ||
| + | <ul> | ||
| + | <li> Forward: 5'-GGCCTGTTTTGCCGACAT-3'</li> | ||
| + | <li> Reverse: 5'-GCAGGTAACGCCGAACGA-3'.</li> | ||
| + | </ul> | ||
| + | |||
| + | </html>[[Image:UofC2011_ECHAmplification_plot.jpg|thumb|300px|center|<b>Figure 7</b> RT-PCR melt curve of ECH primer set with LD2 cDNA ]]<html> | ||
| + | |||
| + | <p>Primers for the Polymerase Chain Reaction (PCR) were designed with the following guidelines in mind:</p> | ||
| + | <ul> | ||
| + | <li> Melting Temperature: 70-74°C (optimally 72°C)</li> | ||
| + | <li> Primer Length: 22-24 (optimally 24)</li> | ||
| + | <li> Product Length: 150-250 base pairs (optimally 200)</li> | ||
| + | <li> No runs of 4 or more of the same nucleotide letter in either the forward or reverse primer.</li> | ||
| + | <li> The primers have a GC clamp at the end (ie. end with G, C, GC, or CG)</li> | ||
| + | <li> The last 5 nucleotides contain 3 or 4 GC's.</li> | ||
| + | <li> GC Content between 40-60% (optimally 50%)</li> | ||
| + | <li> All unintentional matches calculated using Primer Blast are at least 25% mismatched.</li> | ||
| + | </ul> | ||
| + | |||
| + | <p>We attempted to optimize the other five genes from the short list, but unfortunately we are still in the process of characterizing their primers. Further characterization of newly synthesized ECH cDNA demonstrated the linear relationship between the amount of cDNA and the amount of mRNA. cDNA was synthesized for all treatments (with and without NA treatment), and qRT-PCR was performed to test whether there was an increase in amplification between NA treated cells and cells not treated with NAs. </p> | ||
| + | |||
| + | |||
| + | </html>[[Image:UofC2011_Quant.png|thumb|300px|center|<b>Figure 8</b> Relative transcript levels of Enoyl CoA Hydratase normalized to 16S RNA, showing an increase in expression between control cells and those treated with Naphthenic Acids. ]]<html> | ||
| + | |||
| + | <p> To obtain the values for Figure 8, 16S-DNA Ct values were subtracted from ECH Ct values for the same treatment. The standard Relative Quantitation formula was then applied to the ΔCt values, in which the Ct value is an exponent of POWER2.</p> | ||
| + | |||
| + | <p>Based on this information, it appears that the putative Enoyl Coa Hydratase is upregulated when cells are incubated with naphthenic acids. Further validation is required to ensure that this response is specific to a variety of conditions including general stress response, heat stress, and fatty acid degradation by regular beta-oxidation. These control experiments have been planned however there was insufficient time before the Americas regional wiki freeze to complete this.</p> | ||
| + | |||
| + | <h2>Further Characterization of ECH/fad-2 Gene Expression</h2> | ||
| + | |||
| + | <p>In the course of pursuing a naphthenic acid inducible promoter, we decided to continue investigating the putative enoyl-CoA hydratase orthologue, fad-2. After performing the first experiment, fad-2 appeared to be enriched 1600-fold compared to untreated control when naphthenic acids were exposed to the <i>Pseudomonas fluorescens</i> strain LD2.</p> | ||
| + | |||
| + | </p>However, upon further examination of the RT-PCR experiment, we found an error in previous calculations, showing that fad-2 transcript levels decreased upon NA exposure instead of increasing as we originally thought, and the fold difference is not as substantial. The method currently adopted is based on Pfaffl et al., (2001), using the following website for further guidance (http://pathmicro.med.sc.edu/pcr/realtime-home.htm). Whether transcription is activated or inactivated, we believed that the change in activity itself was worth investigating in the hopes of finding a regulatory element. </p> | ||
| + | |||
| + | </html>[[Image:Calgary2011 Fig9 RTPCR 2.jpg|thumb|600px|center|<b>Figure 9</b> <p>A calculation error revealed that the enoyl-CoA hydratase orthologue fad-2 is downregulated not upregulated in response to ~80mg/L naphthenic acid treatment. (correction for Figure 8).</p>]]<html> | ||
| + | |||
| + | <p>We examined the chromosomal region surrounding fad-2 and observed that it was likely part of an operon, with another putative operon on the opposite strand. We reasoned that if NA consistently represses fad-2 expression, it may be transitioning expression to genes on the opposite strand. We adopted the strategy to determine if repression of fad-2 in the presence of naphthenic acids was a consistent result, and if it was, did that mean that the opposite strand operon was being activated, thereby causing the repression of the fad-2 operon? Due to time constraints, we have not been able to characterize amplification of genes on the opposite strand and went straight to synthesis of the putative promoter to position it before a response element and test if it was inducible.</p> | ||
| + | |||
| + | </html>[[Image:Calgary2011 Fig9 RTPCR.jpg|thumb|600px|center|<b>Figure 10</b> <p>Chromosomal map of fad-2 and neighboring genes and intergenic regions. Source: http://www.pseudomonas.com</p>]]<html> | ||
| + | |||
| + | <br></br> | ||
| + | <p><b>Is fad-2 consistently repressed by naphthenic acids?</b></p> | ||
| + | <p>Repeats of these experiments demonstrated that similar to the initial experiment, NA treated samples have a lower enrichment of fad-2 transcript than the control sample, however there was only a 2-fold expression difference instead of the original 6. The reason for this is possibly because more recent experiments were performed using different conditions from the original. In both experiments, cells were treated with 80mg/L of NA and other stimuli between 6 and 10 hours and were harvested while in exponential growth phase. The original experiment used cultures that were treated for a longer time course and may have been in stationary phase, which potentially resulted in a greater amount of fad-2 mRNA transcripts.</p> | ||
| + | |||
| + | </html>[[Image:Calgary2011 Fig11 RTPCR 2.jpg|thumb|600px|center|<b>Figure 11</b> <p>The regulation of Fad-2 by naphthenic acid treatment appears to be consistent, although much less than what was found in the first experiment. Decanoic acid, a straight chained fatty acid appears to increase the amount of Fad-2 transcript. Expression levels are relative to 16s rDNA levels, and normalized to untreated control (relative quantiation=1).</p>]]<html> | ||
| + | |||
| + | <p>To determine if the regulation we were seeing is specific to naphthenic acids, we performed the experiment with other chemical treatments: decanoic acid, a straight chained fatty acid; cinnamic acid, a naphthenic acid with an aromatic ring followed by an unsaturated fatty acid tail, which is a known substrate for enoyl CoA hydratase, and is thus used as a positive control treatment; and hydrogen peroxide, an oxidizing agent that produces a general cellular stress response. Chemical structures of the chemicals used are shown in the figure below.</p> | ||
| + | |||
| + | </html>[[Image:Calgary2011 Fig12 RTPCR.jpg|thumb|600px|center|<b>Figure 12</b> <p> <i>Pseudomonas LD2</i> cultures were exposed to cinnamic acid, decanoic acid, naphthenic acid (cyclohexane pentanoic acid) or hydrogen peroxide (not shown) prior to total RNA isolation</p>]]<html> | ||
| + | |||
| + | <p>In this experiment, the decrease in Fad-2 due to naphthenic acids was not substantial. Cinnamic acid has been previously described as being modified by enoyl-CoA hydratase. In cells treated with cinnamic acid, a 1.6 fold increase in fad-2 transcript was observed. Decanoic acid exposure did not appear to increase fad-2 transcript in this experiment. The lack of response to decanoic acid indicates that fad-2 expression probably decreases specifically to NA exposure, and fatty acids, which is a similar class of hydrophobic compounds with a carboxylic acid group, cannot elicit the same change. Hydrogen peroxide did not alter Fad-2 transcript levels either, suggesting that fad-2 or ECH is likely not a general stress response gene. There is a continual loss of amplification as we have performed these experiments. Coincident with this is the appearance of a small second peak in the melt curve that did not appear during primer optimization studies (<a href="https://2011.igem.org/Team:Calgary/Notebook/Calendar/Binf#RTPCR">see figure here</a>). These experiments need to be repeated when new primers are ordered.</p> | ||
| + | |||
| + | </html>[[Image:Calgary2011 Fig13 RTPCR 2.jpg|thumb|600px|center|<b>Figure 13</b> <p>Relative Quantitation of Fad-2 Transcript upon exposure to naphthenic acids (dissolved in water or ethanol), decanoic acid, cinnamic acid, and H2O2 after normalization to control (relative quantiation=1).</p>]]<html> | ||
| + | |||
| + | <b>Future experiments in characterization of NA response:</b> | ||
| + | <p>Future characterization experiments would explore enrichment of opposite strand transcripts of the fad-2 operon. Although they are all putative proteins, BLINK analysis (Source: NCBI) demonstrated that the first 2 predicted ORFs encode a lipoprotein and a choloyl glycine hydratase. These proteins may be altering the composition of the plasma membrane in response to the naphthenic acid surfactant properties.</p> | ||
| + | |||
| + | <p>We would also continue to modify the culture conditions for NA treated cells. In these experiments, we did not optimize the use of minimal media, which is more suited to experiments for RNA extraction, compared to LB. </p> | ||
| + | |||
| + | <p>Lastly, there were other candidate genes to investigate by bioinformatics screen that we were unsuccessful in developing PCR primers for. We are interested in sequencing the environmental isolate strains LD1 and LD2 to refine our screen and perhaps be able to design better primers for this line of investigation. </p> | ||
| + | |||
| + | <h2>Cloning putative naphthenic acid responsive promoter elements</h2> | ||
| + | |||
| + | <p>According to the chromosomal map (Figure 10), fad-2 (gene coding for ECH) appear to be in a gene cluster or operon, where transcription of the genes in the operon would be theoretically controlled by a single promoter element upstream of the operon. Three intergenic regions in the vicinity of the genes were explored for possible promoter sequences that are responsive to naphthenic acid exposure. First, in the chromosomal map, the fad-2 gene is read from right to left, and thus the intergenic region (Tax ID: 220664) (Source: http://www.pseudomonas.com) on the right of fad-2 in the chromosomal map is directly upstream of fad-2. The sequence (178bp) of this region (in the right direction) is :</p> | ||
| + | |||
| + | <center> | ||
| + | <p>GGTGCTGATTCCTGTTTTATTCGGCCGAGACGGCGC</p> | ||
| + | <p>GGGTCTCTGAACTCATACCAGTCTTTTTCCTTGTCA</p> | ||
| + | <p>AGAAAGCCCGGAGTGACCTGAAAATCGCCATAGCCT</p> | ||
| + | <p>CACTTTTAGCACTGCCTATACTGGATTGCGCAGCCG</p> | ||
| + | <p>TTTCACCGCAGGACACACATAAACAGGAGCGTTT</p> | ||
| + | |||
| + | </center> | ||
| + | <p>The second promoter candidate is further upstream of the fad-2 gene, and is the next intergenic region available. Similar to the first candidate, a promoter region may be present in this region, which controls a cluster of related genes or a operon. The sequence (329bp) of this intergenic region is:</p> | ||
| + | |||
| + | <center> | ||
| + | <p>TGTTGTTCCTCACGCATAGGGCGAAGTGTTTCGCCGGGGTAATGGCCATG</p> | ||
| + | <p>ATCGAGAGGTCATGAAAACGGCAGGACGTCCCTTTCCAGCCAAGCTTCAG</p> | ||
| + | |||
| + | <p>GTCGGTTGCATTTCACGGGAGCGGCCAAGGCGCCAAGGAAAGTCCTCCAC</p> | ||
| + | <p>CCTGGGCAAAATTCAAAAACAGCAATGAAATATTTTTTTGAATCAAATAG</p> | ||
| + | |||
| + | <p>CTGGCAATCTCCGATCGGTCAAGGCTCCCCATCGGCCTTCAACCCTGTGG</p> | ||
| + | <p>CAAGCCTGCCGGGGGGCCTGTTAGGCTAACCCGCCCACCGCGTCGCCGCG</p> | ||
| + | |||
| + | <p>GTCTCTACAGCTCTTCGCGGAACCGCACC </p> | ||
| + | |||
| + | </center> | ||
| + | |||
| + | <p>The third candidate for the NA-responsive promoter is downstream of fad-2 gene, and is more likely to be a promoter that is selectively activated in the presence of naphthenic acids. Since fad-2 is down-regulated with NA-exposure, and other genes in the cluster, including PFL_3017 (hypothetical protein) and PFL_3019 (choloylglycine hydrolase) (Source: http://www.pseudomonas.com), are transcribed in the opposite direction as fad-2, these genes (PFL_3017 and PFL_3017) are likely up-regulated in response to NAs. Thus, this intergenic region can act as a promoter that can be activated in response to NAs. The sequence (350bp) of this intergenic region (Tax ID: 220664) (Source: http://www.pseudomonas.com) is:</p> | ||
| + | |||
| + | <center> | ||
| + | <p>TCACTGATTTTGATCAAGGCACAGCTTCAGTTTGCTTTGGATACCCAGGA</p> | ||
| + | <p>ATCACTGAGAAATACAGTATTGTCAGTCCATCTCCTCAGGATGACCTGGT</p> | ||
| + | <p>AGTTTTGGAGCTGGCTGGCAAACCGATTTTCAGACTTTGGCAGCGAGATT</p> | ||
| + | <p>CGGATGATTTGAGCATTGGTGCACCGGTTACGGTGAGCCAAGGCGAATTC</p> | ||
| + | <p>GACCGGAGTCAGGGCCGTGTTACCCGACGAACCTGGTCATAGATGGAGGG</p> | ||
| + | <p>CCATGAATGCTGGTCTCTTCGGCTTCCTATGTATTCAGATATCTTATAAC</p> | ||
| + | <p>TAAACTAAATGAATATTTAGTTTAGTTATATTGGATATCAGGAGTTACCC</p> | ||
| + | </center> | ||
| + | |||
| + | <p>We submitted the first candidate promoter to the Parts Registry (BBa_K640008) as a stand-alone part, as well as a composite part (BBa_K640006) with LacZ used for electrochemical assays, as well as oriT and ori1600 for the transfer of the reporter system into <i>Pseudomonas spp.</i>. We are in the process of biobricking the other two promoter elements and performing more electrochemical assays to test the reporter system in the presence of naphthenic acids. </p> | ||
| + | |||
| + | |||
| + | <h2>Appendix A: Pseudomonas.com Results</h2> | ||
| + | |||
| + | <p>The genes found from a subsequent bioinformatic search on Pseudomonas.com were not used in the RT-PCR, but have been included as an appendix for the iGEM community. Pseudomonas.com is a database specializing in the annotation and collection of information related to the <i>Pseudomonas</i> genus, but it also has a comparative genome search tool which claims to allow the location of genes unique to one species and not the other. The list, which has not been completely processed yet, can be found <a href="https://static.igem.org/mediawiki/2011/2/2e/Calgary2011_Unique_Genes_from_Pseudomonas.zip" > in this .zip file</a> in both .xls and .xlsx format (the latter is recommended). One of the most interesting genes found on the list is annotated as <a href="http://pseudomonas.com/getAnnotation.do?locusID=PP_4705">glyoxalase/bleomycin resistance protein/dioxygenase</a>, but is similar to a ring-cleaving dioxygenase also found in <i>P. putida</i>.</p> | ||
| + | |||
| + | <h2>Appendix B: MUMmer Findings</h2> | ||
| + | |||
| + | <p><a href="http://mummer.sourceforge.net/">MUMmer</a> is an open source program which can align genomes within a matter of seconds. We used MUMmer to verify our assumption that there was a substantial degree of homology between <i>Pseudomonas putida</i> and <i>fluorescens</i>. This assumption is important, because its corollary is that there is a limited number of genes unique to either species. The fewer unique genes there are, the easier it is to find the right one.</p> | ||
| + | |||
| + | </html>[[image:Calgary2011_MummerPlot.jpg|thumb|600px|center|<b>Figure 6</b><p>Figure 6 shows the alignment between <i>Pseudomonas putida</i> (x-axis) and <i>fluorescens</i> (y-axis). Linear regions are more conserved and scattered regions are less conserved.</p>]]<html> | ||
| + | |||
| + | <p>The graph above shows the genome alignment between <i>P. putida</i> and <i>P. fluorescens</i>, where the former is on the x-axis and the latter on the y-axis. Regions conserved between both species form a straight line going from the bottom left corner to the top right corner; the line going from the top left corner to the bottom right corner is also a conserved region between both species, except that it is backwards. Areas with a more scattered distribution indicate a more random, and therefore less homologous, aligned region between the two species.</p> | ||
| + | |||
| + | <!-- | ||
| + | <br></br> | ||
<h2>Using RT-qPCR to Detect Upregulation of Genes in Response to NAs</h2> | <h2>Using RT-qPCR to Detect Upregulation of Genes in Response to NAs</h2> | ||
| - | <p>The | + | |
| + | |||
| + | <img style="float: right; width: 150px; padding-left: 10px; padding-bottom: 5px; padding-top: 5px;" src="https://static.igem.org/mediawiki/2011/f/f2/UCalgary2011_PromoterFredComputer.png"></img> | ||
| + | |||
| + | <p>The <i>Pseudomonas</i> strains (P. putida and P. fluorescens) were exposed to NAs to see if the genes selected through the bioinformatics search were in any way upregulated when compared with ordinary levels of expression. If they were upregulated it would indicate whether or not they contained NA responsive regions and hence a possible NA responsive promoter. </p> | ||
<p>After treating the cells they were then preserved by exposure to an RNA stabilizing chemical, lysed and the RNA extracted. Next the RNA was converted to cDNA using random short primers and reverse transcriptase. The cDNA was then subjected to RT-PCR with primers that would amplify select genes of interest as well as control primers that amplify 16S-RNA sequences whose levels were expected to be stable. </p> | <p>After treating the cells they were then preserved by exposure to an RNA stabilizing chemical, lysed and the RNA extracted. Next the RNA was converted to cDNA using random short primers and reverse transcriptase. The cDNA was then subjected to RT-PCR with primers that would amplify select genes of interest as well as control primers that amplify 16S-RNA sequences whose levels were expected to be stable. </p> | ||
<p>To date no data has been obtained from the PCRs because the primers have not been amplifying the genes. Trouble shooting and optimization are ongoing at this point to determine the best parameters for the primers to work. MAKE CHANGES HERE NEW DATA HAS BEEN OBTAINED | <p>To date no data has been obtained from the PCRs because the primers have not been amplifying the genes. Trouble shooting and optimization are ongoing at this point to determine the best parameters for the primers to work. MAKE CHANGES HERE NEW DATA HAS BEEN OBTAINED | ||
!!!!!!!!!!!!!!!!!!!!!!!!!!!!!!!!!!!!!</p> | !!!!!!!!!!!!!!!!!!!!!!!!!!!!!!!!!!!!!</p> | ||
| + | |||
| + | <h1> Promoter Characterization</h1> | ||
| + | <a name="promoterCharacterization"/> | ||
| + | <p>THIS SECTION SHOULD CONTAIN CHARACTERIZATION FOR THE PROMOTER, IF IT EXISTS.</p> | ||
| + | --> | ||
| + | <style> | ||
| + | #titlebar{margin-top: -6px;} | ||
| + | #pagetitle{padding-top: 17px;} | ||
| + | #bodycontainer{padding-top: 6px;} | ||
| + | </style> | ||
</html> | </html> | ||
}} | }} | ||
Latest revision as of 04:02, 29 October 2011





NA-Sensitive Promoters using Bioinformatics and qRT-PCR

Introduction
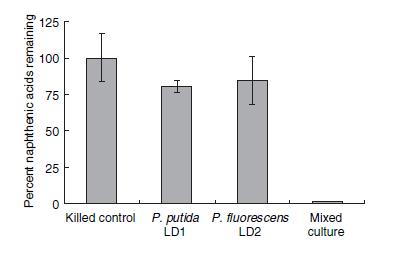
Several species of bacteria have been found to survive in toxic tailing pond environments. Only recently however, have environmental researchers begun to identify the strains and species of these microorganisms. In a study directed by Moore et al. 2006, two species of Pseudomonas (putida and fluorescens) were shown to degrade naphthenic acids in co-culture to a much greater degree than culturing each species individually. The percentage of remaining naphthenic acids in a solution after four weeks of bacteria culturing is shown in Figure 1.
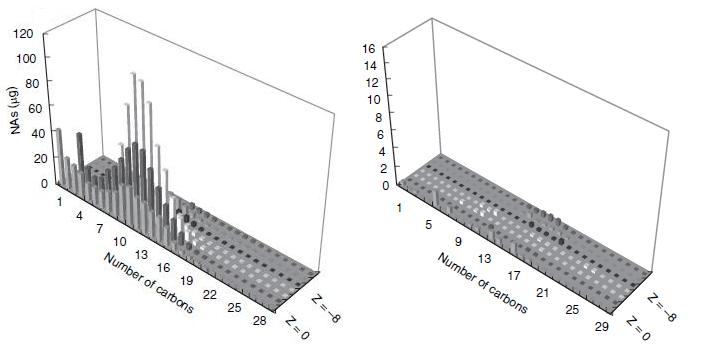
This result would suggest that each strain of Pseudomonas provides a unique set of degradation machinery (likely in the form of enzymes) to complete the breakdown of naphthenic acids. Figure 2 shows how the degradation affected the concentrations of specific naphthenic acids of varying carbon number and saturation, as measured by GC-MS. The chart on the left of figure 2 shows the initial concentrations of each of the naphthenic acids, and the chart on the right shows the concentration of the naphthenic acids after four weeks of a LD1-LD2 co-culture. Based on the decreased height and scale, the figure demonstrates that naphthenic acids were more or less indiscriminately degraded by the co-culture. In terms of the development of a detection system for naphthenic acids, the indescriminate nature of this degradation would be advantageous in detecting a large group of NAs.
When both figure 1 and 2 are taken together, the most likely conclusion is that the genes responsible for the degradation are spread across the two species. Furthermore, there exists a collection of essential genes in this degradation pathway which are unique to one species and not present in the other. The degradation pathway has not been experimentally confirmed, but it is believed to be a metabolic pathway which involves beta-oxidation (Moore et al. 2006). The promoters upstream of these essential genes would be likely places to find a naphthenic acid promoter. A weakness of the bioinformatics search was that LD1 and LD2 have not yet been sequenced, and therefore we assume similarity between them and corresponding strains that have been sequenced; this weakness complicated primer design but was not prohibitive to the project.
Abstract
Three online databases (DarkHorse, ProteinWorld DB, and Pseudomonas.com) were used to find target gene candidates in silico, and a fourth (MUMmer) was used to confirm experimental hypotheses. Using the data from these sources, we were able to construct a short list of gene candidates which were then processed through a quantitative Real-Time Polymerase Chain Reaction (qRT-PCR) to verify gene expression as a response to naphthenic acids. The qRT-PCR found that a putative Enoyl CoA Hydratase (GeneID=YP_260124), from Pseudomonas fluorescens, was expressed as a response to naphthenic acids.
DarkHorse and ProteinWorld DB Results
DarkHorse is an online database for finding phylogenetically atypical proteins in various microbial species. Generally, phylogenetic atypicality can be useful for predicting the horizontal transfer of genes; for our purposes, the algorithm identified relatively unique genes for various strains of Pseudomonas putida and fluorescens. We conjectured that genes also found in tailing pond microorganisms, or involved in the degradation of naphthenic acids and similar acids, were the most suitable for further investigation. DarkHorse uses only genomic DNA and does not include any of the super plasmids (up to 100kb) known to be carried by different strains of Pseudomonas. The exclusion of these superplasmids limit the scope of our screening, but allowed us to focus on investigating the roles of the gene candidates and their source species in relevant degradation pathways.
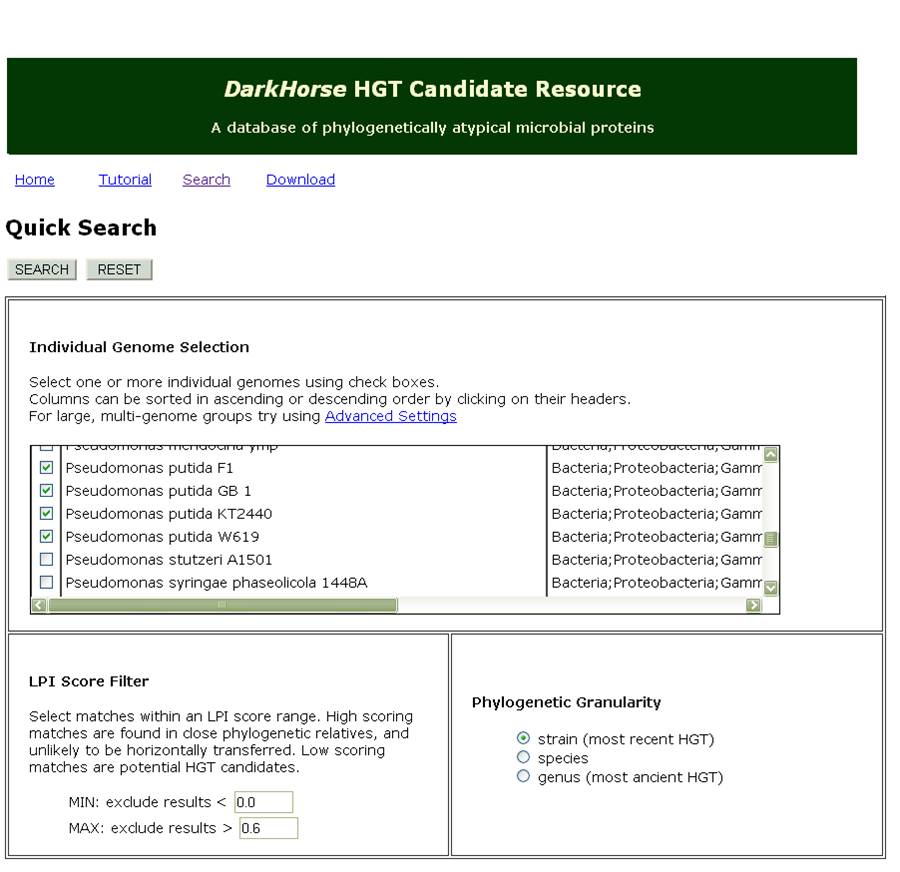
Figure 3 shows a sample of the input used for our DarkHorse Query. The list returned by querying the database for phylogenetically atypical genes in LD1 and LD2 was 258 records long. Each record contained the GI number, strain, and gene annotation for the query species and its best phylogenetic match. To sort through the data, we started by collecting data about the best match species and the gene annotations. Using the data about the species, we found that some of them had known degradation pathways and were naturally occurred in tailings ponds. We were especially interested in such species when they donated a predicted transcription factor or degrative enzyme related to fatty acid degradation. Fatty acids are structurally similar to naphthenic acids and therefore may have similar promoters, or enzymes that would interact with this class of compounds. One putative short-listed gene, enoyl CoA hydratase, was selected due to its very low RPI score (0.001) - which suggests a strong likelihood that it was horizontally transferred - and also because of it was a member of a gene family involved in degrading compounds similar to naphthenic acids, such as caffeic and cinnanoic acid (Fiedler et. al. 2004 Journal of Applied Microbiology). A predicted Acyl-CoA-ligase with a LPI score of 0.401 also appeared to be involved in caffeic acid degradation, and was also short-listed. To view our DarkHorse bioinformatics results as a whole please click here.
Additionally we used Protein World DB, a database for finding unique genes across a set of compared species. This program was useful for identifying potential metabolic genes unique to one species, which our hypothesis suggested is the case for the desired promoter. We used the only available Pseudomonas strains in their registry, putida KT2440 and fluorescens Pf-5, in our search.
ProteinWorld DB returned 55 unique hits for both species of bacteria. Visual inspection and classification of these hits revealed a number of transcription factors known to be involved metabolic signaling in a variety of other organisms. In particular, two LysR based transcription factors, and a theoretical protein seemed to BLAST against other known transcription factors found in various species of bacteria. What was interesting, was the involvement of these transcription factor hits in metabolic pathways particularly in beta-oxidation. For this reason, we added these to a list for further examination. A thioesterase which might also be involved in naphthenic acid degradation was also short-listed onto our list. Please click here for a complete list of our Protein World DB hits.
After examining both the DarkHorse and Protein World DB hits, our team was able to short-list six genes which we thought to be potentially involved in naphthenic acid detection and potentially degradation. These genes are listed below:
Quantitative RT-PCR Results
In order to validate that our short-listed genes were involved in naphthenic acid sensing, we designed and implemented a qRT-PCR approach to analyzing changes in mRNA expression for these genes in the prescence of naphthenic acids.
Untreated cells and cells treated with 80mg/L of NAs were subjected to Qiagen RNA bacterial extraction protocol (see protocols section). Reverse transcription PCR using random primers and Reverse Transcriptase was performed to generate cDNAs from RNA.
The cDNAs generated were then used for quantitative real time PCR (qRT-PCR). During the PCR, we used primers which specifically bound to the transcribed region of the each gene, generating small DNA sequences later bound by SYBR Green, a DNA binding fluorophore. The binding of SYBR is directly proportional to the amount of DNA generated in the PCR reaction. A fluorescent scanner in the qRT-PCR machine periodically measures the fluorescence of the reaction as the PCR proceeds. Initial concentrations are regressively and indirectly determined when the fluorescence passes a predefined intensity threshold. The threshold is known as a the concentration threshold (Ct), and the Ct value refers to the cycle at which this threshold is surpassed. Because the amount of DNA in a PCR doubles every cycle, the Ct value can be used to determine the amount of cDNA, and therefore mRNA, produced as a result of reverse transcription and gene transcription respectively. As a further control, differences in transcription of a tested gene are normalized to the transcription of a control gene expressed at the same rate in both treated and untreated samples. Control genes are generally transcripts that do not vary significantly with different treatments. If the Ct value of candidate genes differ from each other more than the control genes, then the evidence suggests that the differences in expression are a result of the treatment given to the cells.
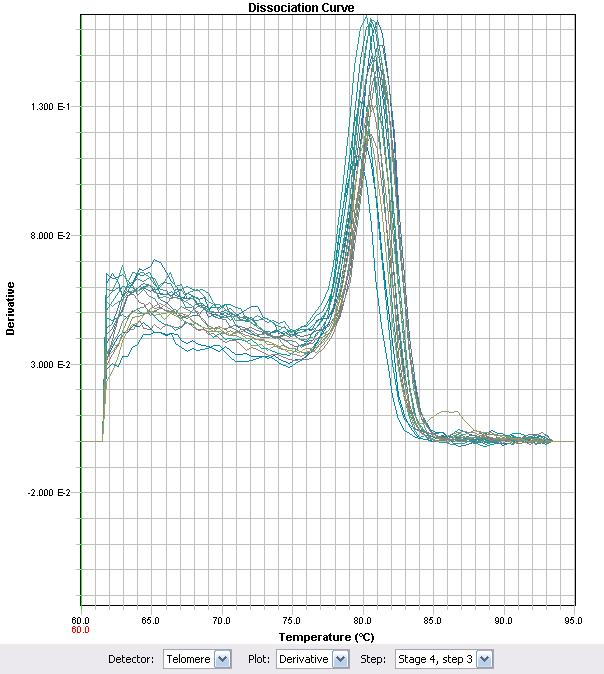
Before conclusions can be drawn, it is important to determine if the primers accurately represent the changes in RNA levels of one gene exclusively. The quality of the primer can be determined using a melt curve. If the primers work properly, then a melt curve analysis will yield only one melting point. In an effort to characterize the primers, RT-PCR was used with some of the previously synthesized cDNA. The primer set ECH (Enoyl-CoA Hydratase) demonstrated that the Ct values proportionately changed with different cDNA levels of the strain LD2, as demonstrated in figure 6. The ECH primers showed a strong dissociation curve with a single peak suggesting that a single target was being synthesized. Primers used for ECH were as follows:
- Forward: 5'-GGCCTGTTTTGCCGACAT-3'
- Reverse: 5'-GCAGGTAACGCCGAACGA-3'.
Primers for the Polymerase Chain Reaction (PCR) were designed with the following guidelines in mind:
- Melting Temperature: 70-74°C (optimally 72°C)
- Primer Length: 22-24 (optimally 24)
- Product Length: 150-250 base pairs (optimally 200)
- No runs of 4 or more of the same nucleotide letter in either the forward or reverse primer.
- The primers have a GC clamp at the end (ie. end with G, C, GC, or CG)
- The last 5 nucleotides contain 3 or 4 GC's.
- GC Content between 40-60% (optimally 50%)
- All unintentional matches calculated using Primer Blast are at least 25% mismatched.
We attempted to optimize the other five genes from the short list, but unfortunately we are still in the process of characterizing their primers. Further characterization of newly synthesized ECH cDNA demonstrated the linear relationship between the amount of cDNA and the amount of mRNA. cDNA was synthesized for all treatments (with and without NA treatment), and qRT-PCR was performed to test whether there was an increase in amplification between NA treated cells and cells not treated with NAs.
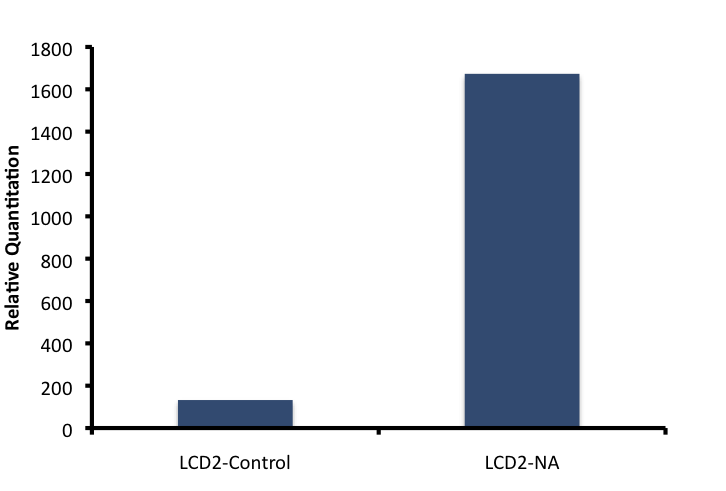
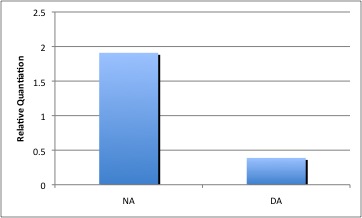
To obtain the values for Figure 8, 16S-DNA Ct values were subtracted from ECH Ct values for the same treatment. The standard Relative Quantitation formula was then applied to the ΔCt values, in which the Ct value is an exponent of POWER2.
Based on this information, it appears that the putative Enoyl Coa Hydratase is upregulated when cells are incubated with naphthenic acids. Further validation is required to ensure that this response is specific to a variety of conditions including general stress response, heat stress, and fatty acid degradation by regular beta-oxidation. These control experiments have been planned however there was insufficient time before the Americas regional wiki freeze to complete this.
Further Characterization of ECH/fad-2 Gene Expression
In the course of pursuing a naphthenic acid inducible promoter, we decided to continue investigating the putative enoyl-CoA hydratase orthologue, fad-2. After performing the first experiment, fad-2 appeared to be enriched 1600-fold compared to untreated control when naphthenic acids were exposed to the Pseudomonas fluorescens strain LD2.
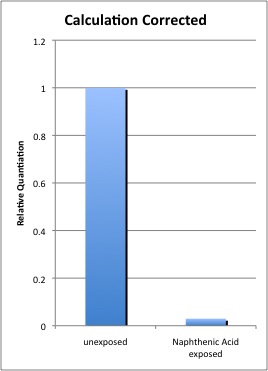
However, upon further examination of the RT-PCR experiment, we found an error in previous calculations, showing that fad-2 transcript levels decreased upon NA exposure instead of increasing as we originally thought, and the fold difference is not as substantial. The method currently adopted is based on Pfaffl et al., (2001), using the following website for further guidance (http://pathmicro.med.sc.edu/pcr/realtime-home.htm). Whether transcription is activated or inactivated, we believed that the change in activity itself was worth investigating in the hopes of finding a regulatory element.We examined the chromosomal region surrounding fad-2 and observed that it was likely part of an operon, with another putative operon on the opposite strand. We reasoned that if NA consistently represses fad-2 expression, it may be transitioning expression to genes on the opposite strand. We adopted the strategy to determine if repression of fad-2 in the presence of naphthenic acids was a consistent result, and if it was, did that mean that the opposite strand operon was being activated, thereby causing the repression of the fad-2 operon? Due to time constraints, we have not been able to characterize amplification of genes on the opposite strand and went straight to synthesis of the putative promoter to position it before a response element and test if it was inducible.
Is fad-2 consistently repressed by naphthenic acids?
Repeats of these experiments demonstrated that similar to the initial experiment, NA treated samples have a lower enrichment of fad-2 transcript than the control sample, however there was only a 2-fold expression difference instead of the original 6. The reason for this is possibly because more recent experiments were performed using different conditions from the original. In both experiments, cells were treated with 80mg/L of NA and other stimuli between 6 and 10 hours and were harvested while in exponential growth phase. The original experiment used cultures that were treated for a longer time course and may have been in stationary phase, which potentially resulted in a greater amount of fad-2 mRNA transcripts.
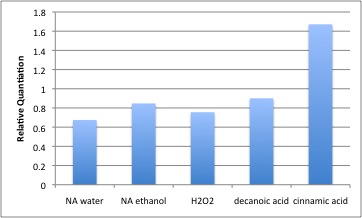
The regulation of Fad-2 by naphthenic acid treatment appears to be consistent, although much less than what was found in the first experiment. Decanoic acid, a straight chained fatty acid appears to increase the amount of Fad-2 transcript. Expression levels are relative to 16s rDNA levels, and normalized to untreated control (relative quantiation=1).
To determine if the regulation we were seeing is specific to naphthenic acids, we performed the experiment with other chemical treatments: decanoic acid, a straight chained fatty acid; cinnamic acid, a naphthenic acid with an aromatic ring followed by an unsaturated fatty acid tail, which is a known substrate for enoyl CoA hydratase, and is thus used as a positive control treatment; and hydrogen peroxide, an oxidizing agent that produces a general cellular stress response. Chemical structures of the chemicals used are shown in the figure below.
In this experiment, the decrease in Fad-2 due to naphthenic acids was not substantial. Cinnamic acid has been previously described as being modified by enoyl-CoA hydratase. In cells treated with cinnamic acid, a 1.6 fold increase in fad-2 transcript was observed. Decanoic acid exposure did not appear to increase fad-2 transcript in this experiment. The lack of response to decanoic acid indicates that fad-2 expression probably decreases specifically to NA exposure, and fatty acids, which is a similar class of hydrophobic compounds with a carboxylic acid group, cannot elicit the same change. Hydrogen peroxide did not alter Fad-2 transcript levels either, suggesting that fad-2 or ECH is likely not a general stress response gene. There is a continual loss of amplification as we have performed these experiments. Coincident with this is the appearance of a small second peak in the melt curve that did not appear during primer optimization studies (see figure here). These experiments need to be repeated when new primers are ordered.
Future characterization experiments would explore enrichment of opposite strand transcripts of the fad-2 operon. Although they are all putative proteins, BLINK analysis (Source: NCBI) demonstrated that the first 2 predicted ORFs encode a lipoprotein and a choloyl glycine hydratase. These proteins may be altering the composition of the plasma membrane in response to the naphthenic acid surfactant properties.
We would also continue to modify the culture conditions for NA treated cells. In these experiments, we did not optimize the use of minimal media, which is more suited to experiments for RNA extraction, compared to LB.
Lastly, there were other candidate genes to investigate by bioinformatics screen that we were unsuccessful in developing PCR primers for. We are interested in sequencing the environmental isolate strains LD1 and LD2 to refine our screen and perhaps be able to design better primers for this line of investigation.
Cloning putative naphthenic acid responsive promoter elements
According to the chromosomal map (Figure 10), fad-2 (gene coding for ECH) appear to be in a gene cluster or operon, where transcription of the genes in the operon would be theoretically controlled by a single promoter element upstream of the operon. Three intergenic regions in the vicinity of the genes were explored for possible promoter sequences that are responsive to naphthenic acid exposure. First, in the chromosomal map, the fad-2 gene is read from right to left, and thus the intergenic region (Tax ID: 220664) (Source: http://www.pseudomonas.com) on the right of fad-2 in the chromosomal map is directly upstream of fad-2. The sequence (178bp) of this region (in the right direction) is :
GGTGCTGATTCCTGTTTTATTCGGCCGAGACGGCGC
GGGTCTCTGAACTCATACCAGTCTTTTTCCTTGTCA
AGAAAGCCCGGAGTGACCTGAAAATCGCCATAGCCT
CACTTTTAGCACTGCCTATACTGGATTGCGCAGCCG
TTTCACCGCAGGACACACATAAACAGGAGCGTTT
The second promoter candidate is further upstream of the fad-2 gene, and is the next intergenic region available. Similar to the first candidate, a promoter region may be present in this region, which controls a cluster of related genes or a operon. The sequence (329bp) of this intergenic region is:
TGTTGTTCCTCACGCATAGGGCGAAGTGTTTCGCCGGGGTAATGGCCATG
ATCGAGAGGTCATGAAAACGGCAGGACGTCCCTTTCCAGCCAAGCTTCAG
GTCGGTTGCATTTCACGGGAGCGGCCAAGGCGCCAAGGAAAGTCCTCCAC
CCTGGGCAAAATTCAAAAACAGCAATGAAATATTTTTTTGAATCAAATAG
CTGGCAATCTCCGATCGGTCAAGGCTCCCCATCGGCCTTCAACCCTGTGG
CAAGCCTGCCGGGGGGCCTGTTAGGCTAACCCGCCCACCGCGTCGCCGCG
GTCTCTACAGCTCTTCGCGGAACCGCACC
The third candidate for the NA-responsive promoter is downstream of fad-2 gene, and is more likely to be a promoter that is selectively activated in the presence of naphthenic acids. Since fad-2 is down-regulated with NA-exposure, and other genes in the cluster, including PFL_3017 (hypothetical protein) and PFL_3019 (choloylglycine hydrolase) (Source: http://www.pseudomonas.com), are transcribed in the opposite direction as fad-2, these genes (PFL_3017 and PFL_3017) are likely up-regulated in response to NAs. Thus, this intergenic region can act as a promoter that can be activated in response to NAs. The sequence (350bp) of this intergenic region (Tax ID: 220664) (Source: http://www.pseudomonas.com) is:
TCACTGATTTTGATCAAGGCACAGCTTCAGTTTGCTTTGGATACCCAGGA
ATCACTGAGAAATACAGTATTGTCAGTCCATCTCCTCAGGATGACCTGGT
AGTTTTGGAGCTGGCTGGCAAACCGATTTTCAGACTTTGGCAGCGAGATT
CGGATGATTTGAGCATTGGTGCACCGGTTACGGTGAGCCAAGGCGAATTC
GACCGGAGTCAGGGCCGTGTTACCCGACGAACCTGGTCATAGATGGAGGG
CCATGAATGCTGGTCTCTTCGGCTTCCTATGTATTCAGATATCTTATAAC
TAAACTAAATGAATATTTAGTTTAGTTATATTGGATATCAGGAGTTACCC
We submitted the first candidate promoter to the Parts Registry (BBa_K640008) as a stand-alone part, as well as a composite part (BBa_K640006) with LacZ used for electrochemical assays, as well as oriT and ori1600 for the transfer of the reporter system into Pseudomonas spp.. We are in the process of biobricking the other two promoter elements and performing more electrochemical assays to test the reporter system in the presence of naphthenic acids.
Appendix A: Pseudomonas.com Results
The genes found from a subsequent bioinformatic search on Pseudomonas.com were not used in the RT-PCR, but have been included as an appendix for the iGEM community. Pseudomonas.com is a database specializing in the annotation and collection of information related to the Pseudomonas genus, but it also has a comparative genome search tool which claims to allow the location of genes unique to one species and not the other. The list, which has not been completely processed yet, can be found in this .zip file in both .xls and .xlsx format (the latter is recommended). One of the most interesting genes found on the list is annotated as glyoxalase/bleomycin resistance protein/dioxygenase, but is similar to a ring-cleaving dioxygenase also found in P. putida.
Appendix B: MUMmer Findings
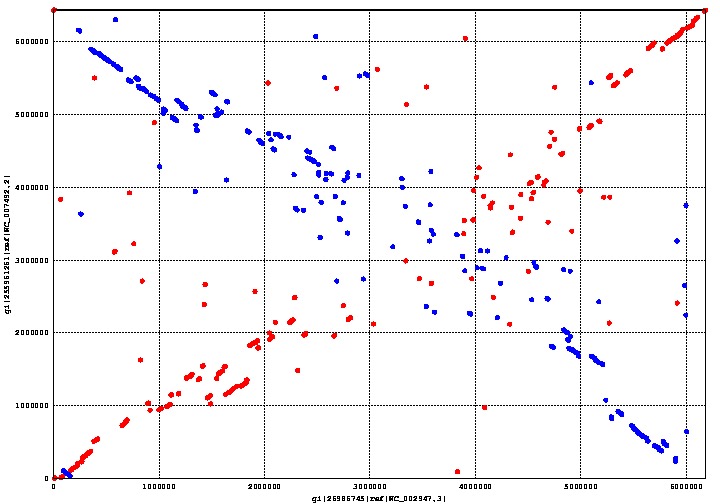
MUMmer is an open source program which can align genomes within a matter of seconds. We used MUMmer to verify our assumption that there was a substantial degree of homology between Pseudomonas putida and fluorescens. This assumption is important, because its corollary is that there is a limited number of genes unique to either species. The fewer unique genes there are, the easier it is to find the right one.
The graph above shows the genome alignment between P. putida and P. fluorescens, where the former is on the x-axis and the latter on the y-axis. Regions conserved between both species form a straight line going from the bottom left corner to the top right corner; the line going from the top left corner to the bottom right corner is also a conserved region between both species, except that it is backwards. Areas with a more scattered distribution indicate a more random, and therefore less homologous, aligned region between the two species.

 "
"


