Team:EPF-Lausanne/Our Project/T7 promoter variants/selection
From 2011.igem.org
(→Experimental Setup) |
(→Results) |
||
| (3 intermediate revisions not shown) | |||
| Line 9: | Line 9: | ||
=== Experimental Setup === | === Experimental Setup === | ||
| - | To that end, we again set up an experiment involving two flasks but this time each flask contains two types of cells. For one flask, cell type is a co-transformation of a lysis plasmid (C2) and a RFP-containing plasmid and the other is a co-transformation of a negative control plasmid (C11) with a GFP-containing plasmid. In the other flask, the reverse is true: lysis (C2) is with GFP and negative control (C11) is with RFP. This co-culture experiment was prepared by mixing equal amounts of cells from an overnight culture in one big flask. After a 1h culture, we induced lysis with 500 µM IPTG. If you would like to find out more about how IPTG induction tests work, please click [[EPF-Lausanne/Our Project/T7 promoter variants/lysis/iptg|here]]. | + | To that end, we again set up an experiment involving two flasks but this time each flask contains two types of cells. For one flask, one cell type is a co-transformation of a lysis plasmid (C2) and a RFP-containing plasmid and the other is a co-transformation of a negative control plasmid (C11) with a GFP-containing plasmid. In the other flask, the reverse is true: lysis (C2) is with GFP and negative control (C11) is with RFP. This co-culture experiment was prepared by mixing equal amounts of cells from an overnight culture in one big flask. After a 1h culture, we induced lysis with 500 µM IPTG. If you would like to find out more about how IPTG induction tests work, please click [[EPF-Lausanne/Our Project/T7 promoter variants/lysis/iptg|here]]. |
| Line 27: | Line 27: | ||
[[File:rgfp_lysis_comparison.png|600px|center]] | [[File:rgfp_lysis_comparison.png|600px|center]] | ||
| - | The fluorescence data shows that, in both cases, the non-lysing cells kept | + | The fluorescence data shows that, in both cases, the non-lysing cells kept producing fluorescent protein, meaning that there was no general, unselective lysis going on. The relevant fluorescence grew over time, as expected for non-lysing cells. The negative-control culture containing RFP seems to have grown less radically than its GFP counterpart, but the difference with respect to the lysis culture is substantial (see the lower of the two graphs). |
[[File:qPCR_dnarecovery.png|600px|center]] | [[File:qPCR_dnarecovery.png|600px|center]] | ||
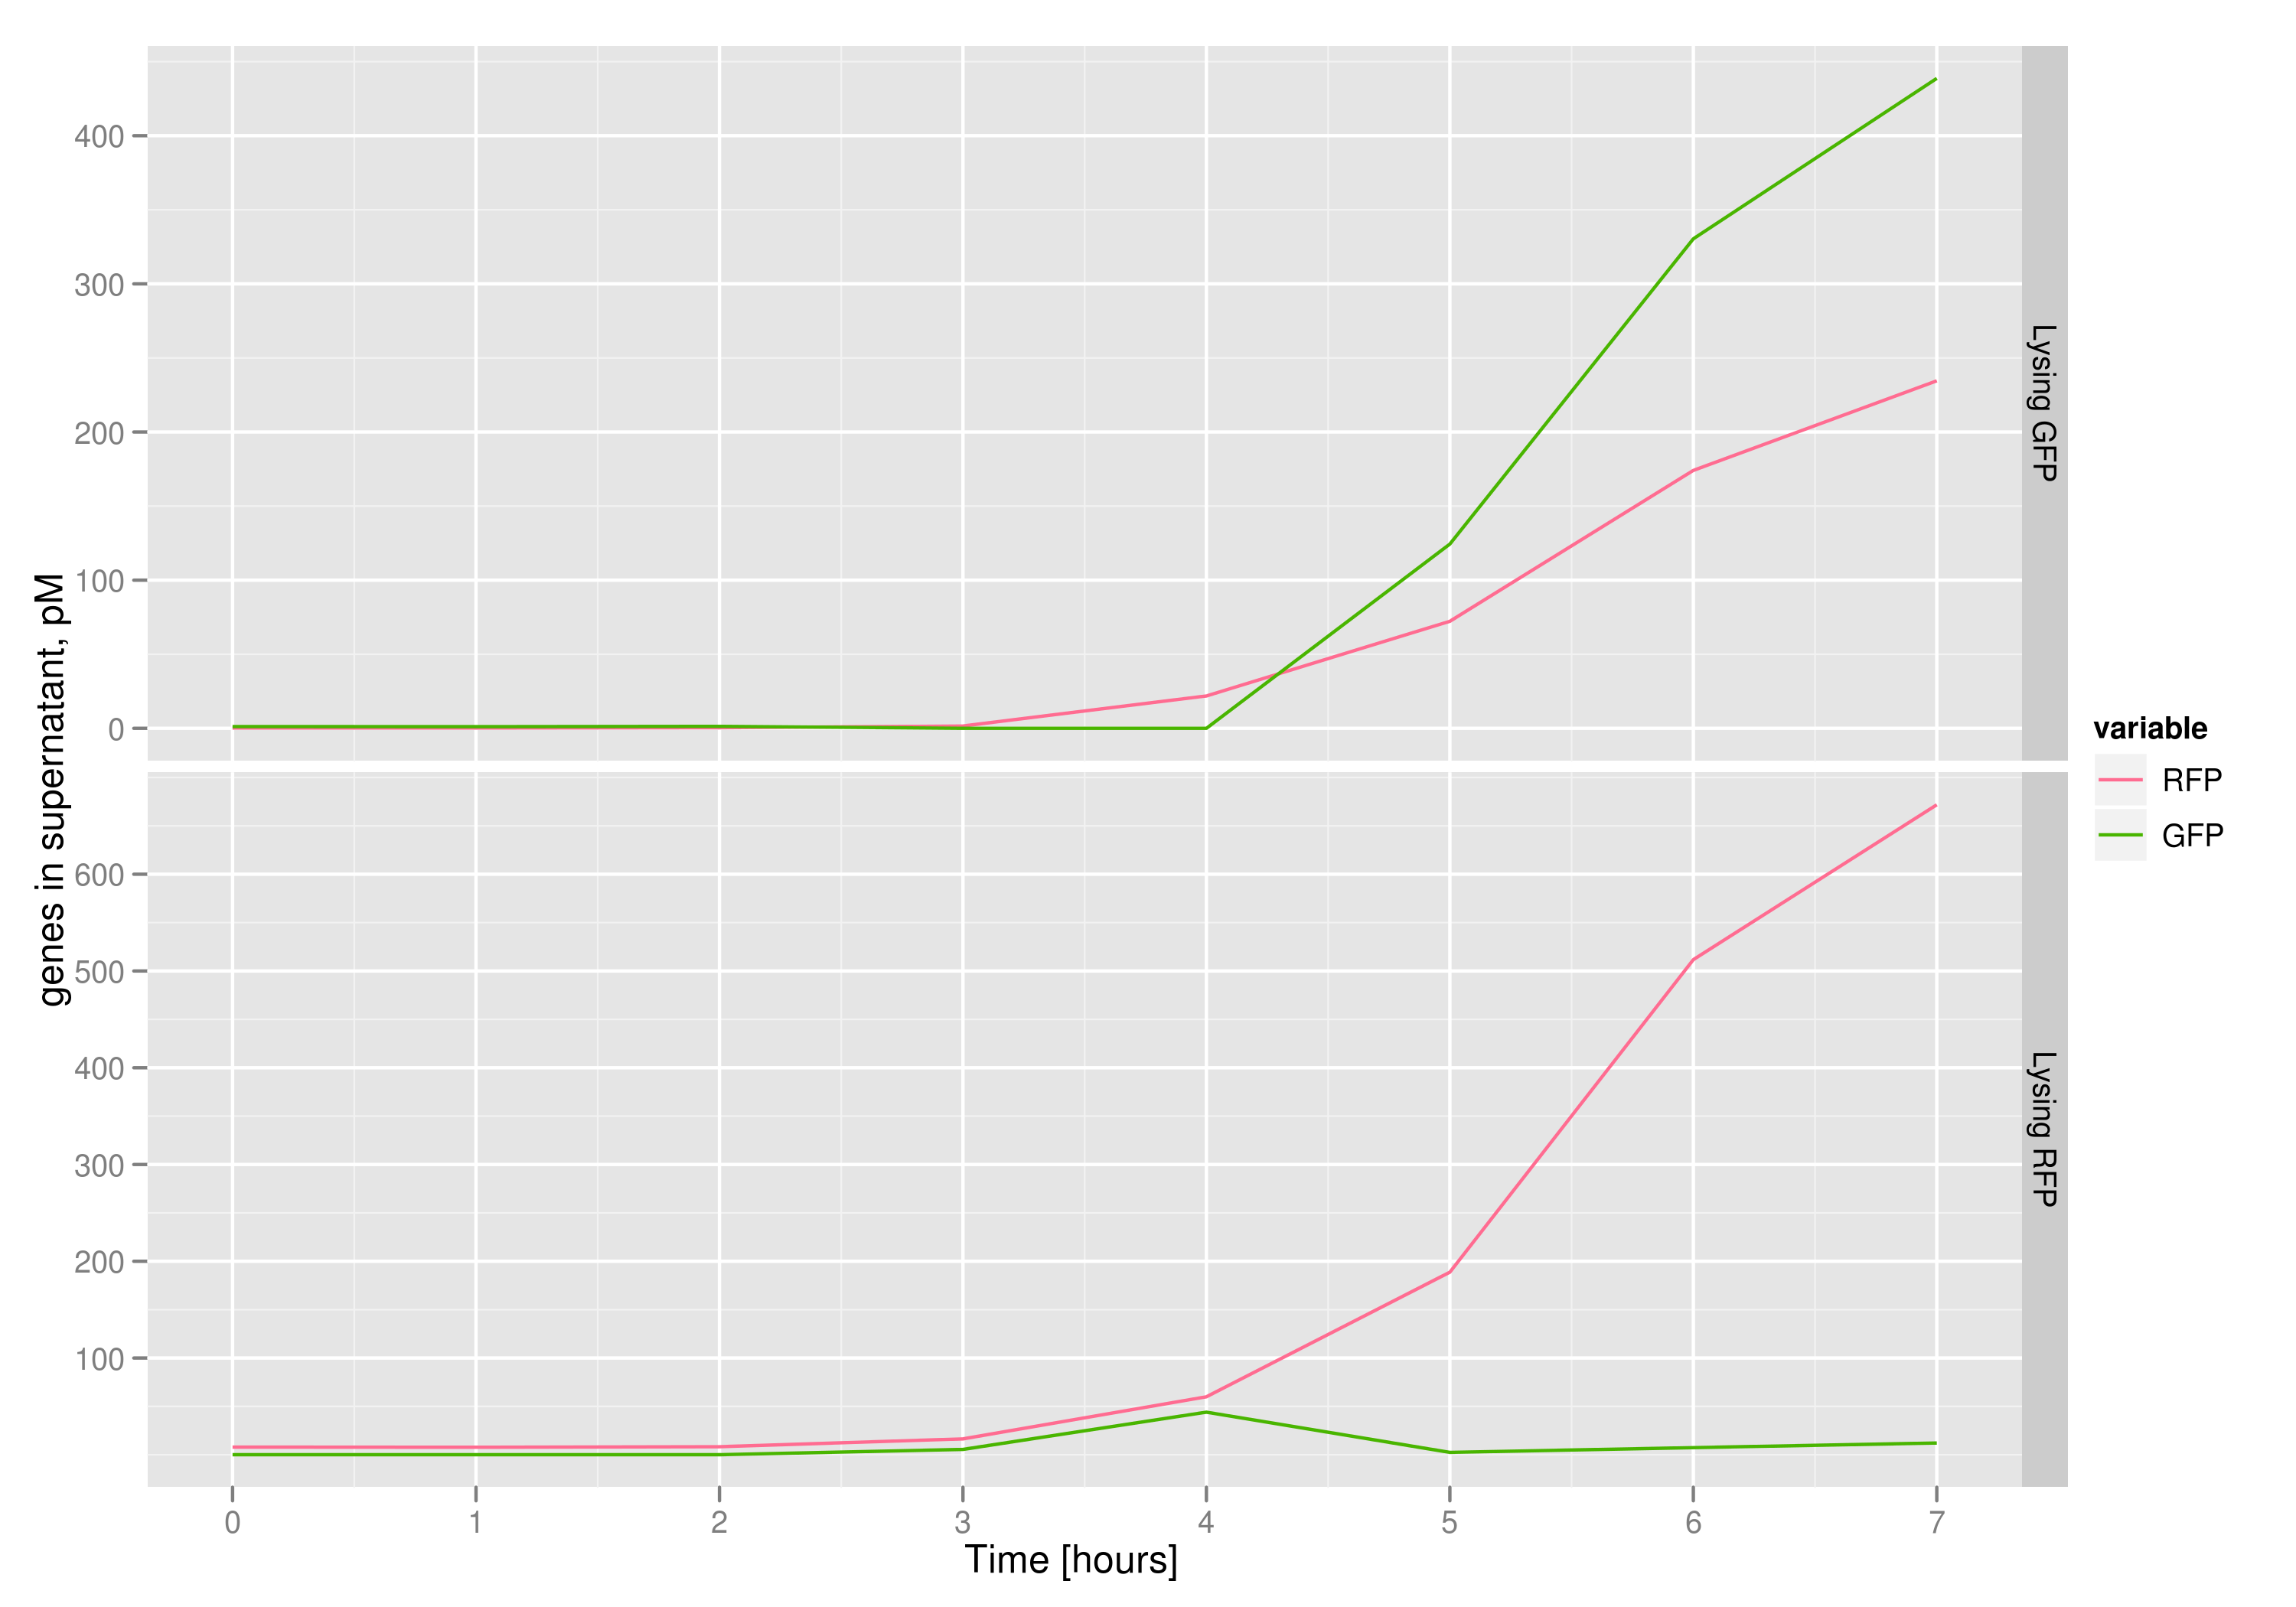
| - | The qPCR data in this graph indicates that the content of the supernatant is indeed the expected content, with respect to the twin cultures of each flask. Where lysed cells are expected to release GFP, we find GFP in the supernatant in much higher concentrations than RFP and vice-versa in the other flask. We can thereby confirm that the right DNA is selected in each flask and finds its way into the supernatant. | + | The qPCR data in this graph indicates that the content of the supernatant is indeed the expected content, with respect to the twin cultures of each flask. Where lysed cells are expected to release GFP plasmids, we find GFP genes in the supernatant in much higher concentrations than RFP and vice-versa in the other flask. We can thereby confirm that the right DNA is selected in each flask and finds its way into the supernatant. |
[[File:CFU.png|600px|center]] | [[File:CFU.png|600px|center]] | ||
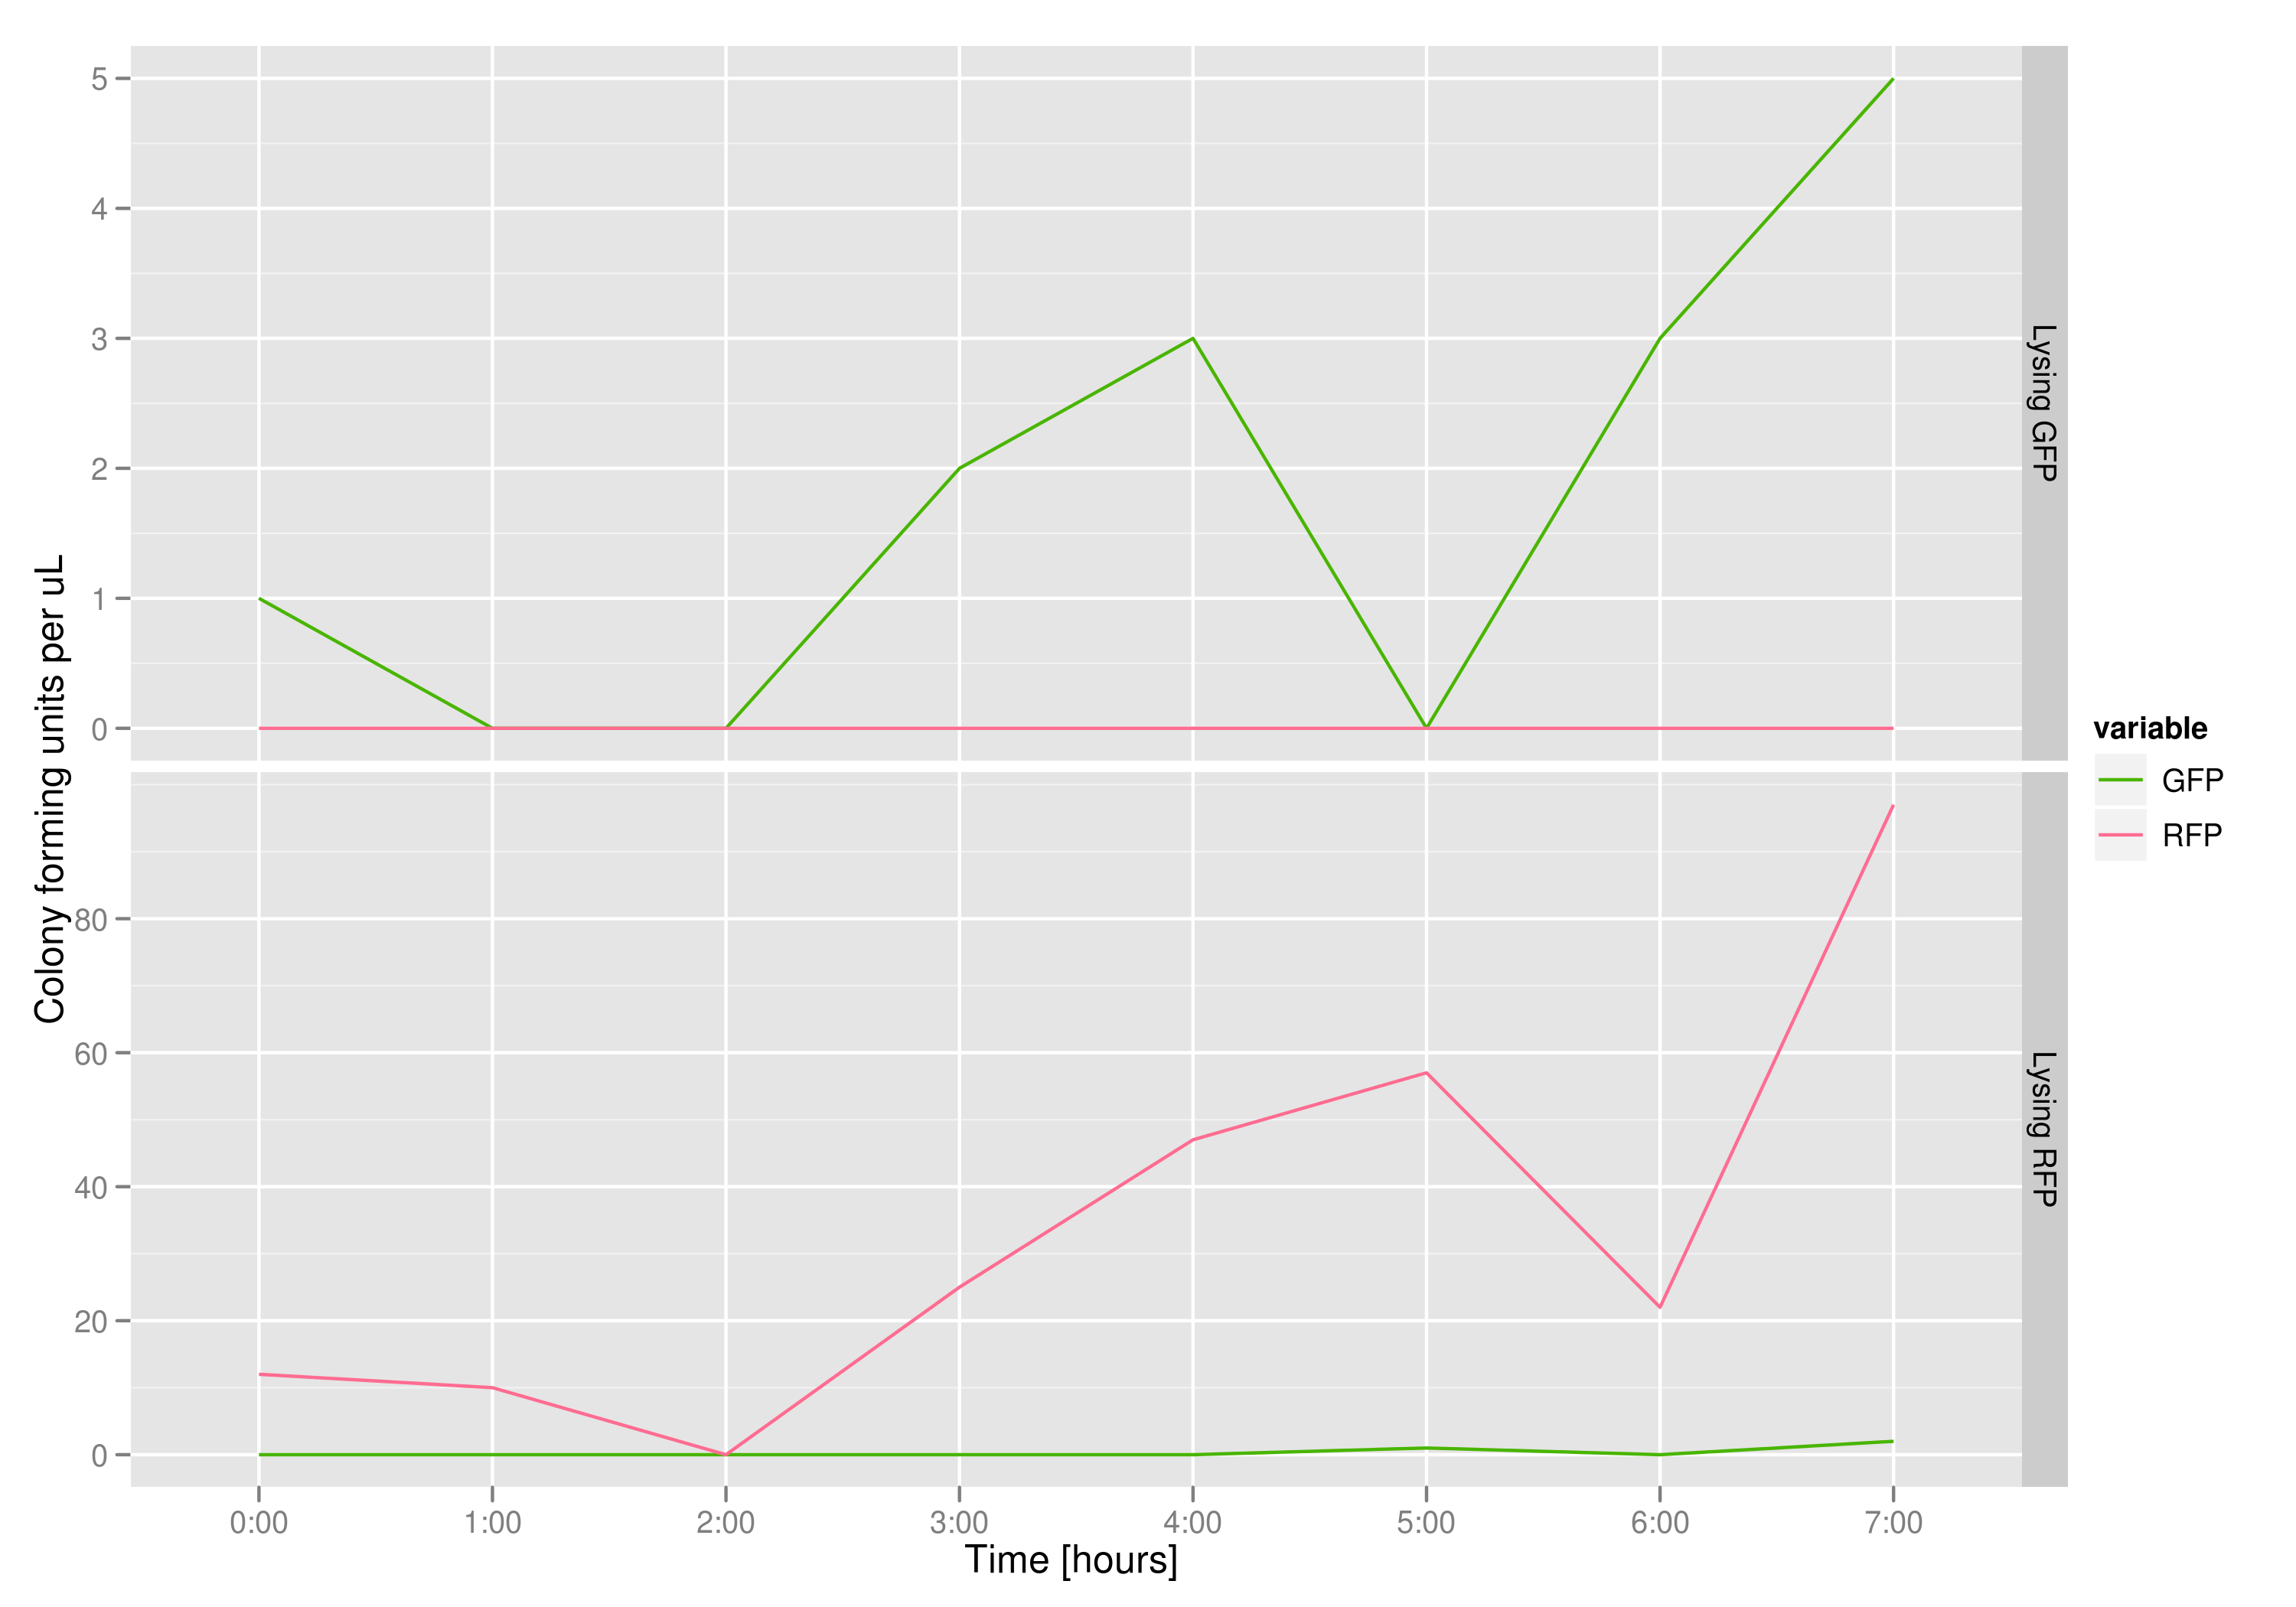
| - | The colony fluorescence count, which is our other method for quantifying DNA concentration in the supernatant, also confirms the qPCR data from the previous graph. Indeed, the ratio of RFP colonies to GFP colonies per plate in the case of cells that lyse and release RFP plasmids grows over the course of the experiment. In practical terms, the likelihood of recovering DNA that is not the desired DNA (i.e. natural cell death leading to plasmids in the supernatant) is | + | The colony fluorescence count, which is our other method for quantifying DNA concentration in the supernatant, also confirms the qPCR data from the previous graph. Indeed, the ratio of RFP colonies to GFP colonies per plate in the case of cells that lyse and release RFP plasmids grows over the course of the experiment. In practical terms, the likelihood of recovering DNA that is not the desired DNA (i.e. natural cell death leading to plasmids in the supernatant) is low. |
| + | |||
| + | [[File:flasks_lysis.jpg|thumb|600px|The flasks, after ten hours, show a clear difference in color. The flask on the left contains a lysed culture of RFP-containing co-transformations with a non-lysed culture of GFP-containing co-transformations which accounts for its yellow-green hue. The flask on the right, conversely, contains a lysed culture of the GFP-containing co-transformations with a non-lysed culture of RFP-containing co-transformations, which accounts for its pinkish hue.]] | ||
{{:Team:EPF-Lausanne/Templates/Footer}} | {{:Team:EPF-Lausanne/Templates/Footer}} | ||
Latest revision as of 03:42, 22 September 2011
Lysis Selection System
Lysis selection system Main | Lysis Characterization | DNA Recovery | DNA Selection | T7 Promoter VariantsContents |
DNA Selection
Introduction
To round out the experiments for DNA recovery, it is essential that we show that the recovered DNA is in fact plasmid DNA from the relevant lysed cells. This is important because in our selection scheme we are only interested in the plasmids from cells expressing the lysis cassettes, and not the DNA from their neighbors (probably the majority of cells in a real selection).
Experimental Setup
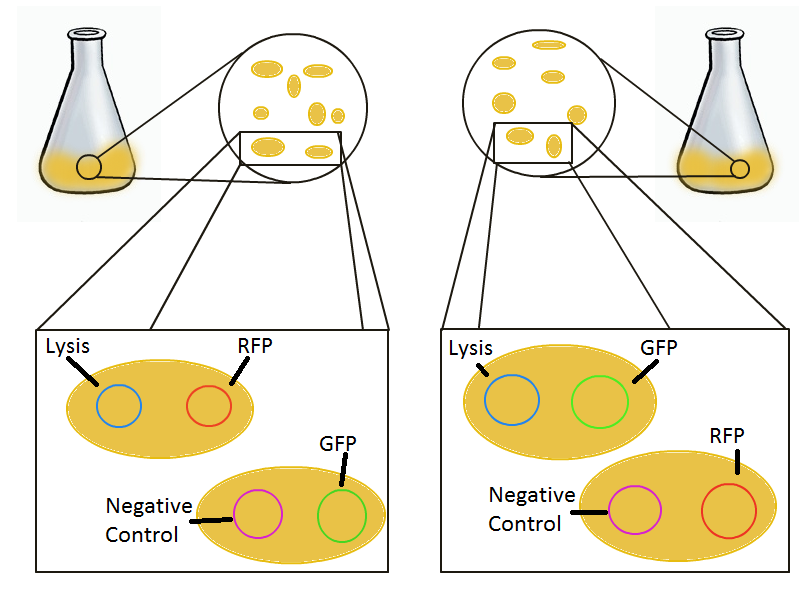
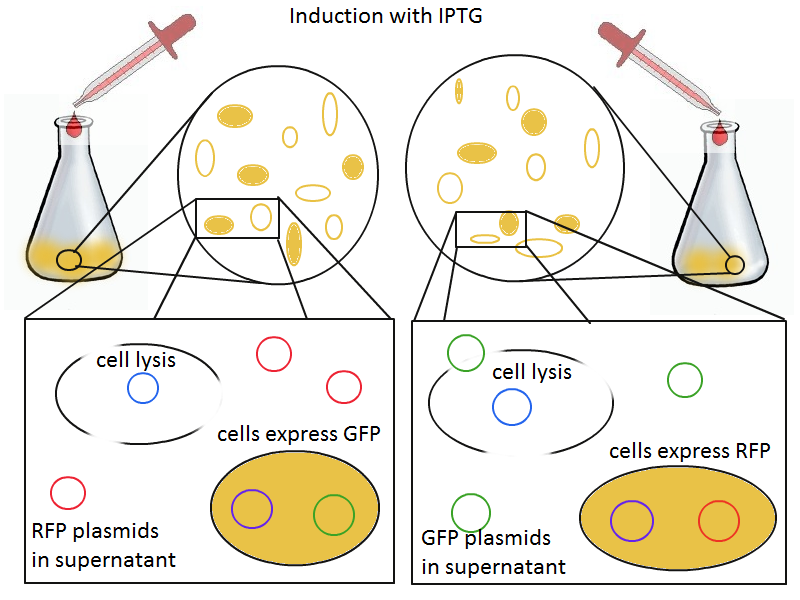
To that end, we again set up an experiment involving two flasks but this time each flask contains two types of cells. For one flask, one cell type is a co-transformation of a lysis plasmid (C2) and a RFP-containing plasmid and the other is a co-transformation of a negative control plasmid (C11) with a GFP-containing plasmid. In the other flask, the reverse is true: lysis (C2) is with GFP and negative control (C11) is with RFP. This co-culture experiment was prepared by mixing equal amounts of cells from an overnight culture in one big flask. After a 1h culture, we induced lysis with 500 µM IPTG. If you would like to find out more about how IPTG induction tests work, please click here.
We measured optical density and took two supernatant samples every hour. One supernatant sample was centrifuged and sterile filtered to remove cell debris. It would be used for qPCR and transformation -- our two methods for quantifying the amount of recovered plasmid DNA. The other sample was used to keep track of fluorescence in the cells over the course of the experiment: the non-lysed cells were expected to fluoresce according to the appropriate gene (RFP or GFP, depending on the culture).
Results
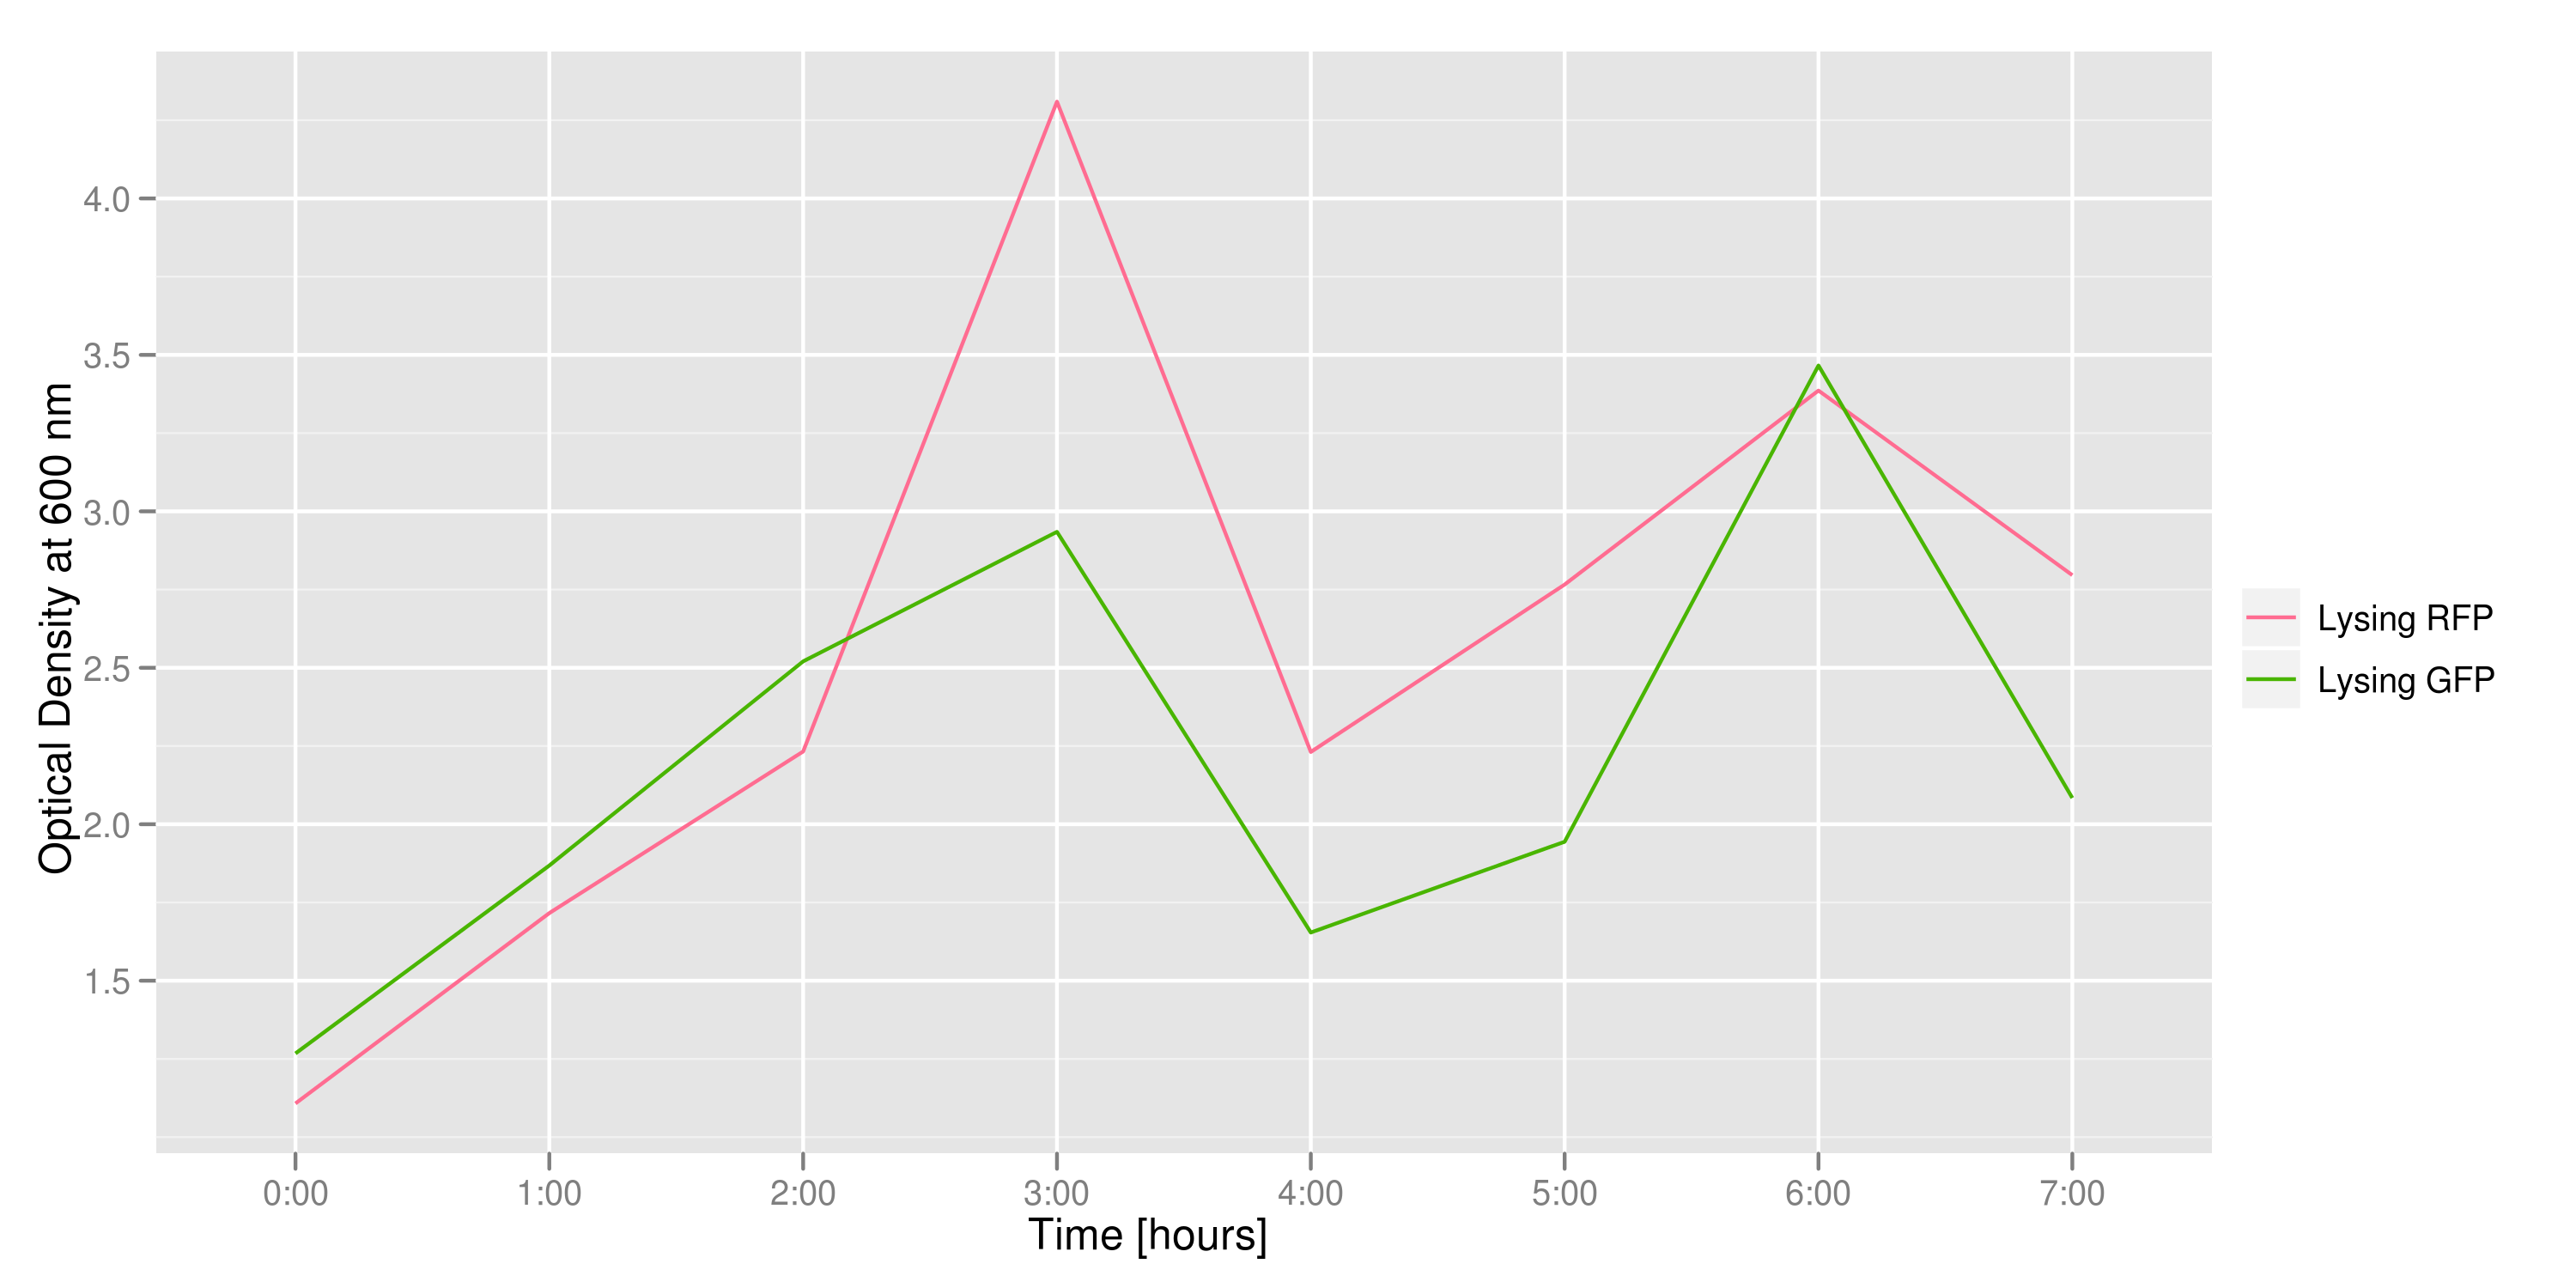
This graph tracks the optical density (measured at 600 nm) over time of the two flasks. It can only be used to confirm that there was growth in each flask, which is to be expected since each flask contains both lysing and non-lysing cells. The growth dynamics are a bit strange, but the optical density increases generally over time.
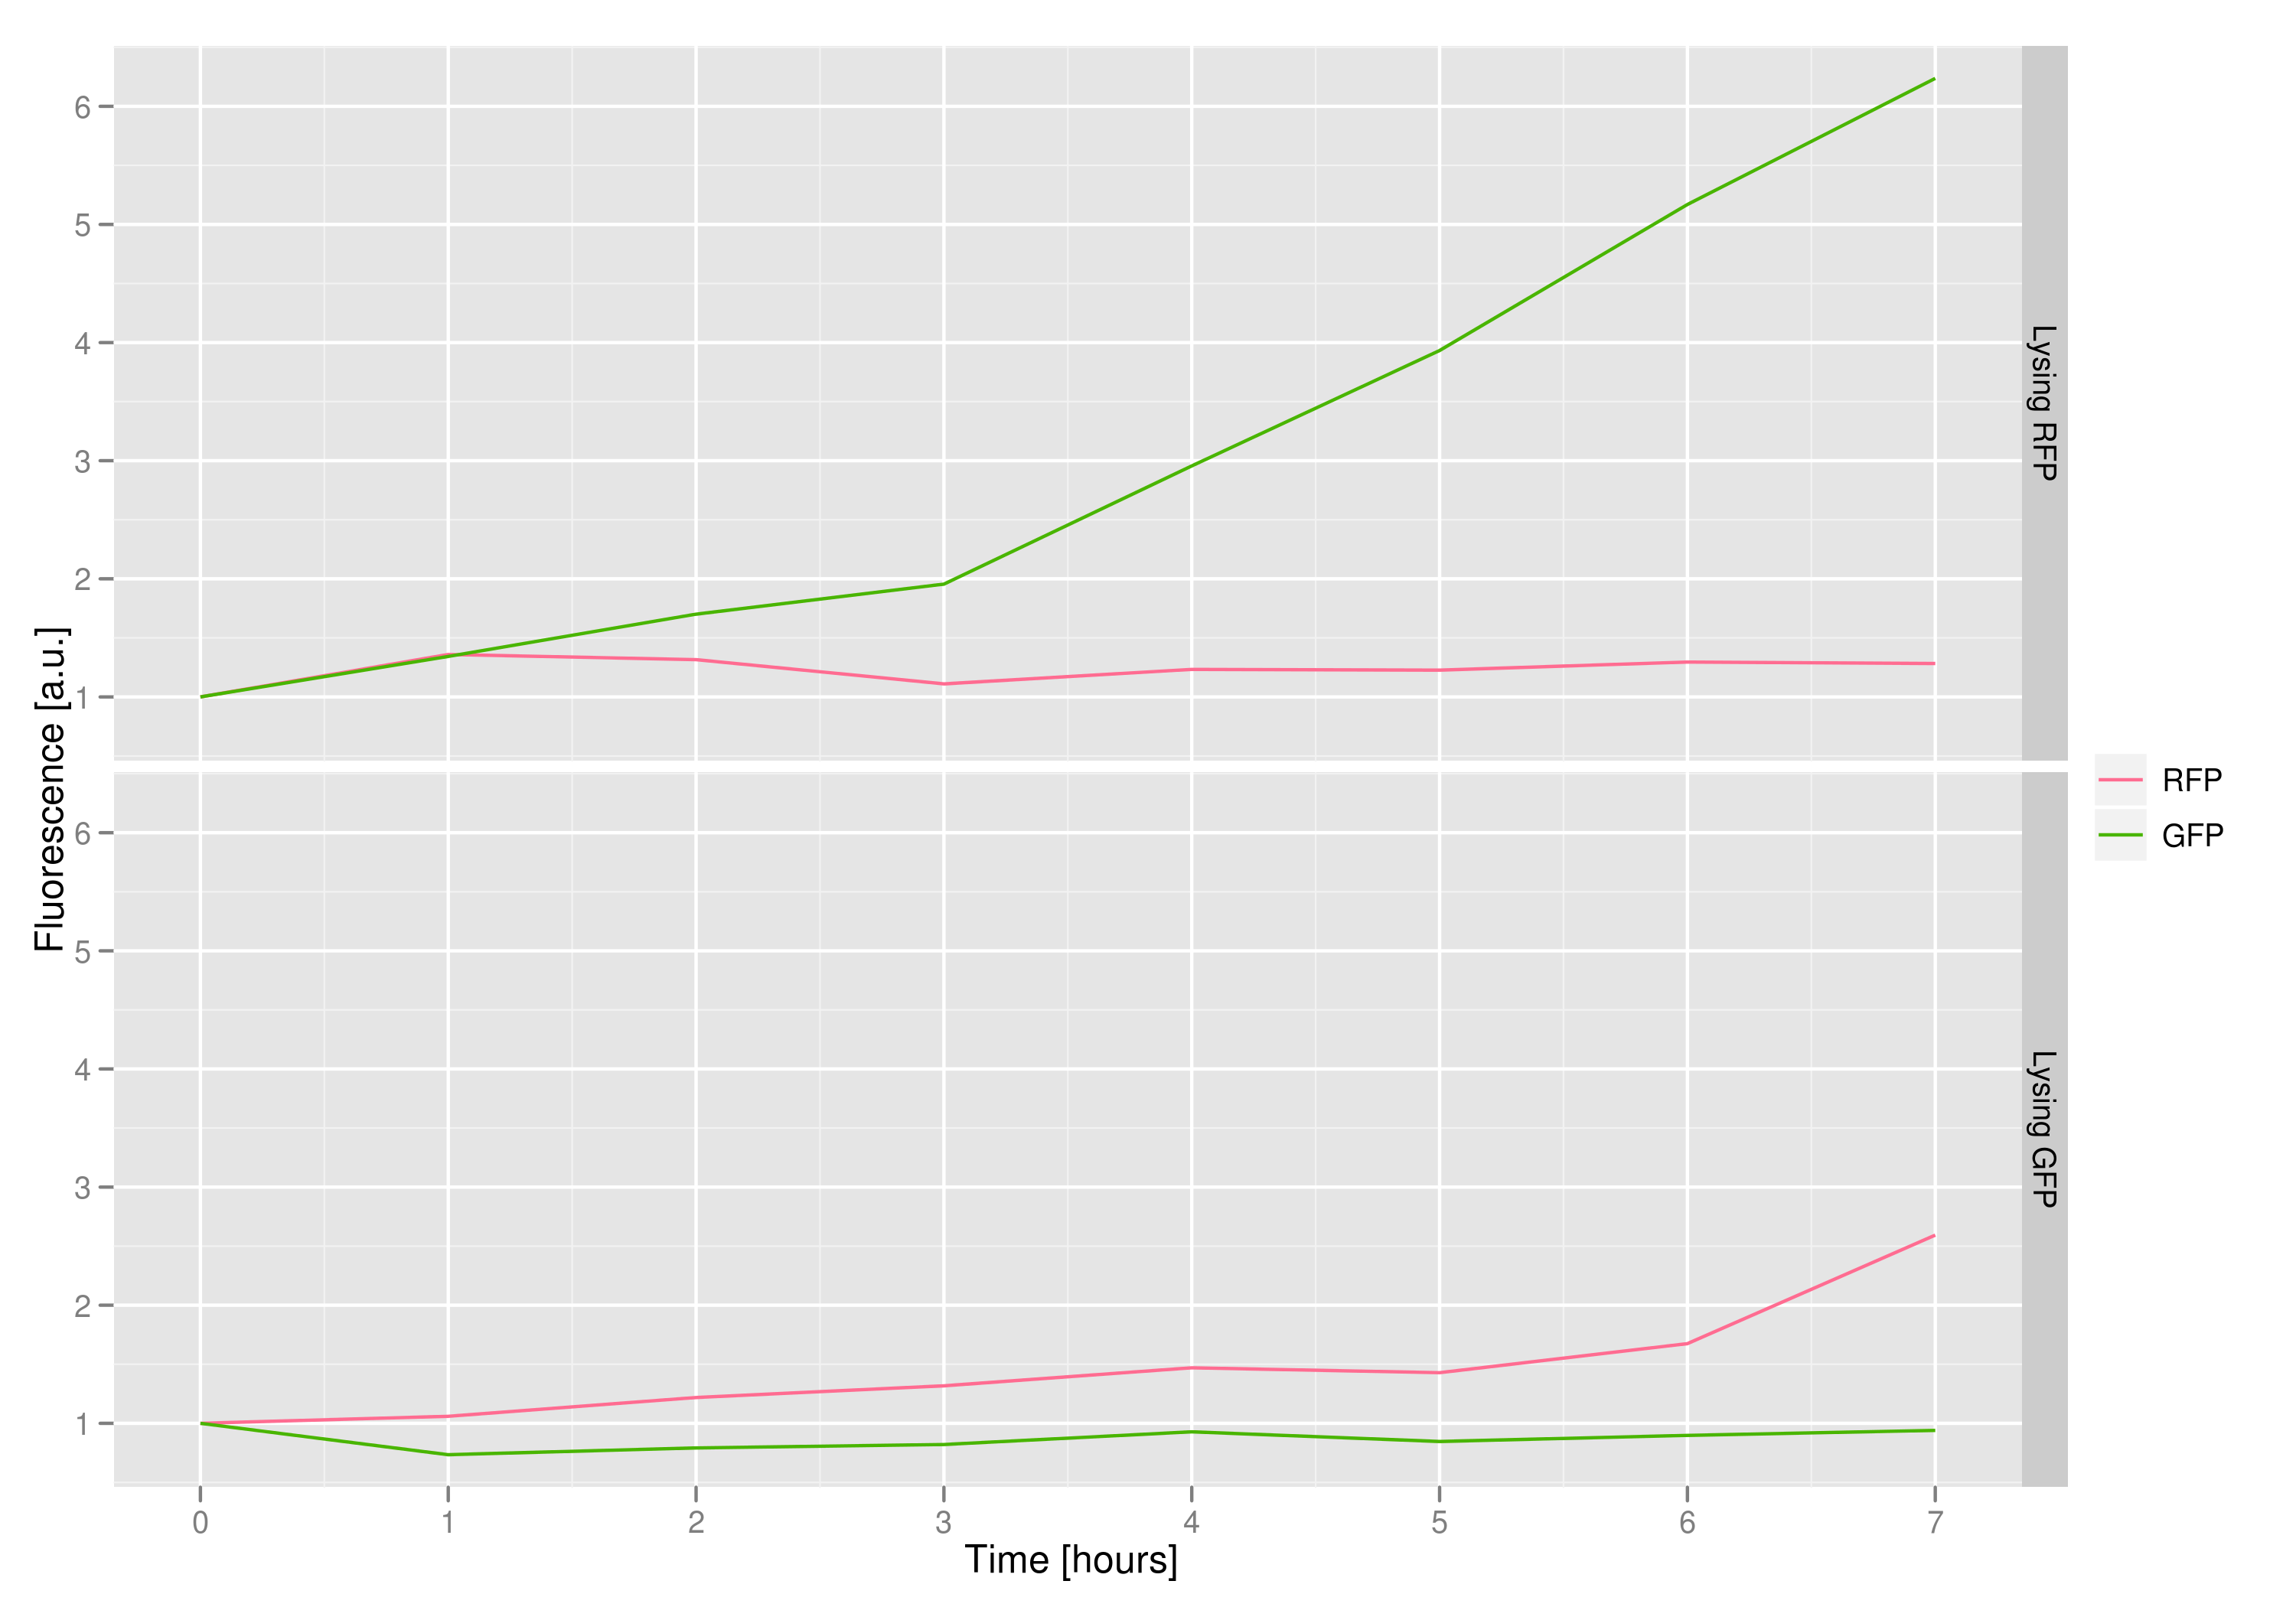
The fluorescence data shows that, in both cases, the non-lysing cells kept producing fluorescent protein, meaning that there was no general, unselective lysis going on. The relevant fluorescence grew over time, as expected for non-lysing cells. The negative-control culture containing RFP seems to have grown less radically than its GFP counterpart, but the difference with respect to the lysis culture is substantial (see the lower of the two graphs).
The qPCR data in this graph indicates that the content of the supernatant is indeed the expected content, with respect to the twin cultures of each flask. Where lysed cells are expected to release GFP plasmids, we find GFP genes in the supernatant in much higher concentrations than RFP and vice-versa in the other flask. We can thereby confirm that the right DNA is selected in each flask and finds its way into the supernatant.
The colony fluorescence count, which is our other method for quantifying DNA concentration in the supernatant, also confirms the qPCR data from the previous graph. Indeed, the ratio of RFP colonies to GFP colonies per plate in the case of cells that lyse and release RFP plasmids grows over the course of the experiment. In practical terms, the likelihood of recovering DNA that is not the desired DNA (i.e. natural cell death leading to plasmids in the supernatant) is low.

 "
"
