 "
"
Team:Glasgow/BiofilmResults
From 2011.igem.org
| (12 intermediate revisions not shown) | |||
| Line 1: | Line 1: | ||
{{Team:Glasgow/Header}} | {{Team:Glasgow/Header}} | ||
<html> | <html> | ||
| - | <h1> | + | <h1>Results</h1> |
| - | < | + | <h6><a href="https://2011.igem.org/Team:Glasgow/Biofilm">Back to Biofilms</a></h6> |
| - | </ | + | <h6><a href="https://2011.igem.org/Team:Glasgow/Results">Back to Results</a></h6> |
| - | + | ||
| - | </br></br> | + | <p>The images below show a selection of stages of biofilm formation. Starting with Image 1 showing a lab strain of <i>E.coli</i>that has no fimbriae, and is not forming a biofilm.</p> |
| - | + | <p>Image 2 shows an EM of <i>E.coli</i> Nissle 1917 in the early stages of biofilm formation. The fimbriae that allow the cells to cling to each other are clearly visible.</p> | |
| + | <p>Image 3 shows a Nissle biofilm in the later stages of formation, with the cells densely packed and the extracellular matrix that holds them together showing.</p> | ||
| + | |||
| + | <p> | ||
| + | <div> | ||
| + | <table align="centre"> | ||
| + | <tr> | ||
| + | <td> | ||
| + | <img src="http://farm7.static.flickr.com/6171/6170367511_51e5363dbd_m.jpg" width="230" height="170"/> | ||
| + | <p><font size="1" color="grey"> Image 1: 15,000x EM of E.coli for comparison. </br>No fimbriae or EPS is visible. </br>(courtesy of Rocky Mountain Laboratories)</font></p> | ||
| + | </td> | ||
| + | <td> | ||
| + | <img src="http://farm7.static.flickr.com/6156/6166741226_e4cfd217bd_m.jpg" /><p><font size="1" color="grey">Image 2: 10,000x SEM image of Nissle </br>showing the fimbriae</font></p> | ||
| + | </td> | ||
| + | <td> | ||
| + | <img src="http://farm7.static.flickr.com/6177/6166139079_a35d6a5930_m.jpg" width="230" height="180" /><p><font size="1" color="grey">Image 3: SEM image of Nissle biofilm </br>showing the extracellular matrix</font></p> | ||
| + | </td> | ||
| + | </tr> | ||
| + | <tr > | ||
| + | <td> | ||
| + | |||
| + | </td> | ||
| + | <td> | ||
| + | <img src="http://farm7.static.flickr.com/6177/6170913398_6e217cc778_m.jpg"/> | ||
| + | <p><font size="1" color="grey">Image 4: 1000x EM of P. aeruginosa biofilm, </br>showing its densely packed structure </br>(courtesy of Dan Walker, University of Glasgow)</font></p> | ||
| + | </td> | ||
| + | </tr> | ||
| + | </table> | ||
| + | </div> | ||
</br> | </br> | ||
| + | <p>The diagrams below show two 24-hour RFP Nissle biofilms compared to non-transformed Nissle and Nissle transformed with the puC19 vector. They show the distinct red fluorescence of RFP, as well as what appears to be innate green fluorescence of Nissle. Due to this property of <i>E. coli</i> Nissle, using GFP or YFP is not recommended. <p> | ||
| + | <p>More details on these diagrams can be found in the lab book section.</p> | ||
| + | |||
<table> | <table> | ||
<tr> | <tr> | ||
<td> | <td> | ||
| - | < | + | <img src="http://farm7.static.flickr.com/6156/6171223536_95ab16bc96_z.jpg"> |
| - | + | <p><font size="1" color="grey"> Figure 1: Comparison of RFP E.coli Nissle biofilms to untransformed E.coli Nissle bioflims under light microscope and under excitatory and non-excitatory wavelengths</font></p> | |
| - | <p> | + | |
| - | </ | + | |
</td> | </td> | ||
| + | </tr> | ||
| + | <tr> | ||
<td> | <td> | ||
| - | < | + | <p> |
| - | < | + | <tr> |
| - | < | + | <td> |
| - | + | <img src="http://farm7.static.flickr.com/6175/6170690387_75d453a871_z.jpg"> | |
| - | <img src=" | + | <p><font size="1" color="grey"> Figure 2: Comparison of RFP E.coli Nissle biofilms to puC19 E.coli Nissle biofilms under light microscope and under excitatory and non-excitatory wavelengths</font></p> |
| - | < | + | |
| - | + | ||
| - | </ | + | |
| - | </ | + | |
</td> | </td> | ||
</tr> | </tr> | ||
</table> | </table> | ||
| - | <p> | + | |
| - | + | <h2>Summary</h2> | |
| - | < | + | <p>We have inserted a new chassis into the registry with E. coli Nissle 1917 which we have also proven to be fully transformable at a rate of 300 colonies per microgram of DNA. We have supplied links to literature which details that the organism has been proved to be safe for use in humans.</p> |
| - | + | ||
| - | + | <p>Nissle 1917 has been shown to be backwardly compatible with a number of pre-existing biobricks, for example the RFP construct J04450 and the cells did not require a shuttle vector or codon optomisation before transformation. </p> | |
| - | </ | + | <p>Nissle produces 600 colonies per microgram of DNA in chemical tranformation </p> |
| - | < | + | <p>Nissle produces 1250 colonies per microgram of DNA in electroporation</p> |
| - | < | + | <p>We have also demonstrated that this chassis forms biofilms readily and carried out a time series experiment which shows that biofilm grows at similar speed to planktonic cell growth. <b>For these reasons we feel that the Nissle 1917 E. coli strain is well suited to biofilm investigations with BioBricks.</b></p> |
| - | + | ||
Latest revision as of 04:10, 22 September 2011


Results
Back to Biofilms
Back to Results
The images below show a selection of stages of biofilm formation. Starting with Image 1 showing a lab strain of E.colithat has no fimbriae, and is not forming a biofilm.
Image 2 shows an EM of E.coli Nissle 1917 in the early stages of biofilm formation. The fimbriae that allow the cells to cling to each other are clearly visible.
Image 3 shows a Nissle biofilm in the later stages of formation, with the cells densely packed and the extracellular matrix that holds them together showing.
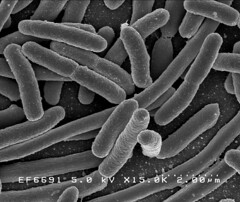
Image 1: 15,000x EM of E.coli for comparison. No fimbriae or EPS is visible. (courtesy of Rocky Mountain Laboratories) |
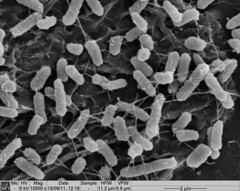 Image 2: 10,000x SEM image of Nissle showing the fimbriae |
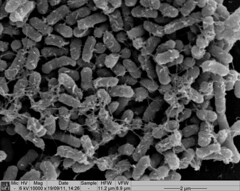 Image 3: SEM image of Nissle biofilm showing the extracellular matrix |
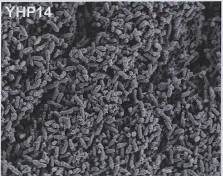
Image 4: 1000x EM of P. aeruginosa biofilm, showing its densely packed structure (courtesy of Dan Walker, University of Glasgow) |
The diagrams below show two 24-hour RFP Nissle biofilms compared to non-transformed Nissle and Nissle transformed with the puC19 vector. They show the distinct red fluorescence of RFP, as well as what appears to be innate green fluorescence of Nissle. Due to this property of E. coli Nissle, using GFP or YFP is not recommended.
More details on these diagrams can be found in the lab book section.
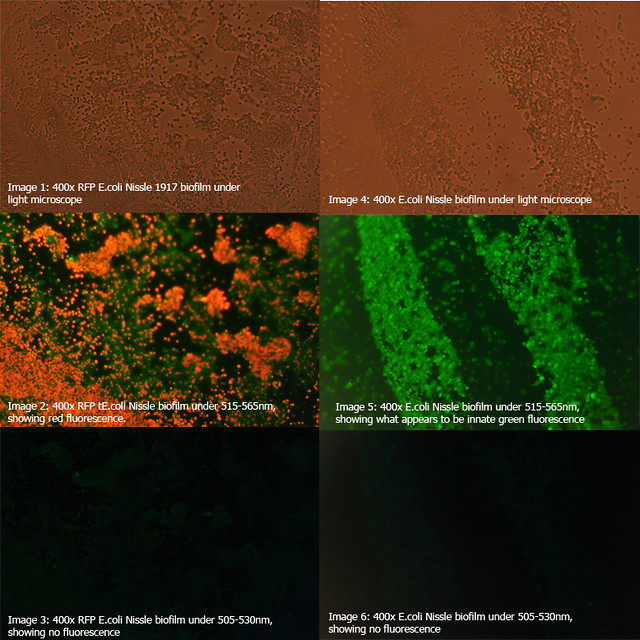
Figure 1: Comparison of RFP E.coli Nissle biofilms to untransformed E.coli Nissle bioflims under light microscope and under excitatory and non-excitatory wavelengths |
|
|
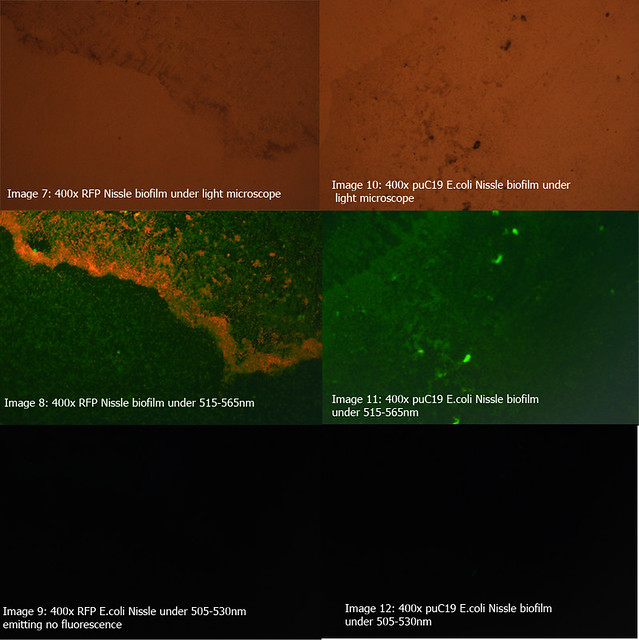
Figure 2: Comparison of RFP E.coli Nissle biofilms to puC19 E.coli Nissle biofilms under light microscope and under excitatory and non-excitatory wavelengths |
Summary
We have inserted a new chassis into the registry with E. coli Nissle 1917 which we have also proven to be fully transformable at a rate of 300 colonies per microgram of DNA. We have supplied links to literature which details that the organism has been proved to be safe for use in humans.
Nissle 1917 has been shown to be backwardly compatible with a number of pre-existing biobricks, for example the RFP construct J04450 and the cells did not require a shuttle vector or codon optomisation before transformation.
Nissle produces 600 colonies per microgram of DNA in chemical tranformation
Nissle produces 1250 colonies per microgram of DNA in electroporation
We have also demonstrated that this chassis forms biofilms readily and carried out a time series experiment which shows that biofilm grows at similar speed to planktonic cell growth. For these reasons we feel that the Nissle 1917 E. coli strain is well suited to biofilm investigations with BioBricks.