Team:Groningen/project characterisation mu lasr
From 2011.igem.org
(Difference between revisions)
(Created page with "==LasR Autoinducing Loops== Our second memory unit consists of a LasR gene(BBa_) driven the LasB promoter(BBa_). LasR only activates transcription in the presence of HSL, this wa...") |
|||
| (17 intermediate revisions not shown) | |||
| Line 1: | Line 1: | ||
| - | + | {{HeaderGroningen2011}} | |
| - | Our second memory unit consists of a LasR gene( | + | |
| + | =LasR autoinducing loop family= | ||
| + | |||
| + | Our second memory unit consists of a LasR gene(Bba_C0179) driven the LasB promoter(Bba_R0079). LasR only activates transcription in the presence of HSL, this was added to the medium in a concentration of 100nM. | ||
| + | ==Leakage of the LasR autoinducing loops== | ||
| + | To estimate the autoactivation of the LasR loop through a leaky promoter we measured fluorescence of cells carrying an pSB1K3 plasmid with the autoinducing loop biobrick (different variants) and the plasmid pSB1A3 with an input(PLacI controlling LasR) as well as the output (PlasB controlling RFP-LVA). The measurements were done in a presence of 100nM PAI. | ||
{| class="wikitable" | {| class="wikitable" | ||
| - | |||
|- | |- | ||
| - | | | + | | || no-tag|| DAS || LVA || |
| - | + | ||
| - | | | + | |
| - | + | ||
| - | + | ||
| - | + | ||
| - | + | ||
| - | + | ||
|- | |- | ||
| - | | | + | | RBS 0,07 || <gallery>File:lasR9.png | [http://partsregistry.org/wiki/index.php?title=Part:BBa_K607031 BBa_K607031] </gallery> || <gallery>File:lasR5.png | [http://partsregistry.org/wiki/index.php?title=Part:BBa_K607027 BBa_K607027] </gallery> |
| - | | | + | ||[http://partsregistry.org/wiki/index.php?title=Part:BBa_K607023 BBa_K607023] |
| - | | | + | |rowspan="4"| [[File:legenda.png]] |
| - | | | + | |
|- | |- | ||
| - | | | + | | RBS 0,3 || <gallery>File:lasR10.png| [http://partsregistry.org/wiki/index.php?title=Part:BBa_K607032 BBa_K607032]</gallery> || <gallery>File:lasR6.png| [http://partsregistry.org/wiki/index.php?title=Part:BBa_K607028 BBa_K607028]</gallery> || <gallery>File:lasR2.png| [http://partsregistry.org/wiki/index.php?title=Part:BBa_K607024 BBa_K607024]</gallery> |
|- | |- | ||
| - | | | + | | RBS 0,6 || <gallery> File:lasR11.png|[http://partsregistry.org/wiki/index.php?title=Part:BBa_K607033 BBa_K607033] </gallery> |
| - | | | + | || <gallery>File:lasr7.png| [http://partsregistry.org/wiki/index.php?title=Part:BBa_K607029 BBa_K607029]</gallery> || <gallery>File:lasr3.png| [http://partsregistry.org/wiki/index.php?title=Part:BBa_K607025 BBa_K607025]</gallery> |
|- | |- | ||
| - | | | + | | RBS 1 || <gallery>File:lasr12.png| [http://partsregistry.org/wiki/index.php?title=Part:BBa_K607034 BBa_K607034]</gallery> || <gallery>File:lasr8.png| [http://partsregistry.org/wiki/index.php?title=Part:BBa_K607030 BBa_K607030]</gallery> || <gallery>File:lasR4.png| [http://partsregistry.org/wiki/index.php?title=Part:BBa_K607026 BBa_K607026]</gallery> |
| - | | | + | |
| - | + | ||
| - | + | ||
| - | + | ||
|- | |- | ||
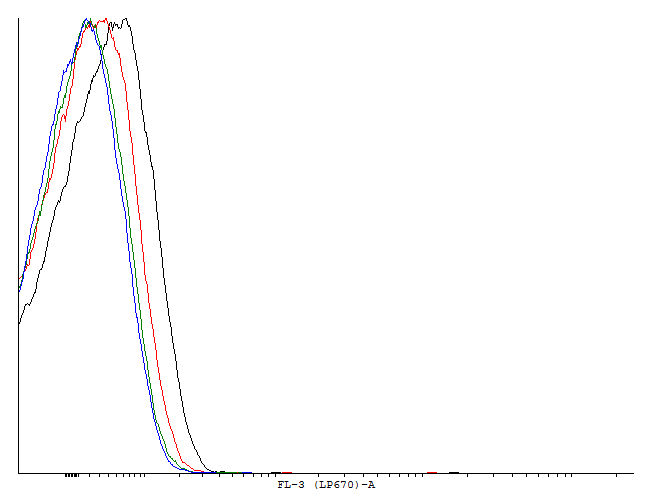
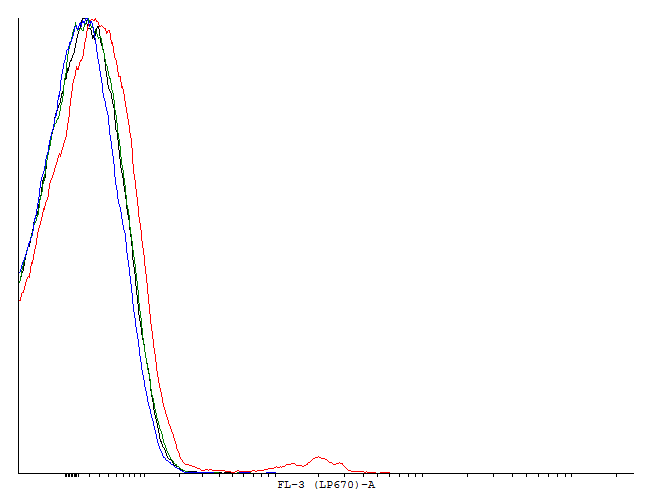
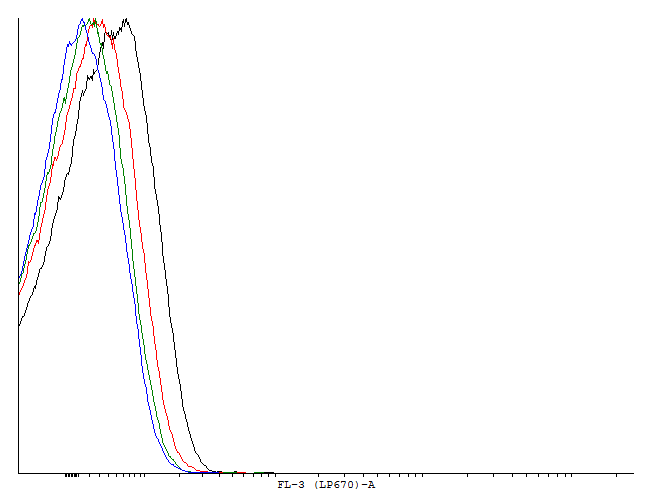
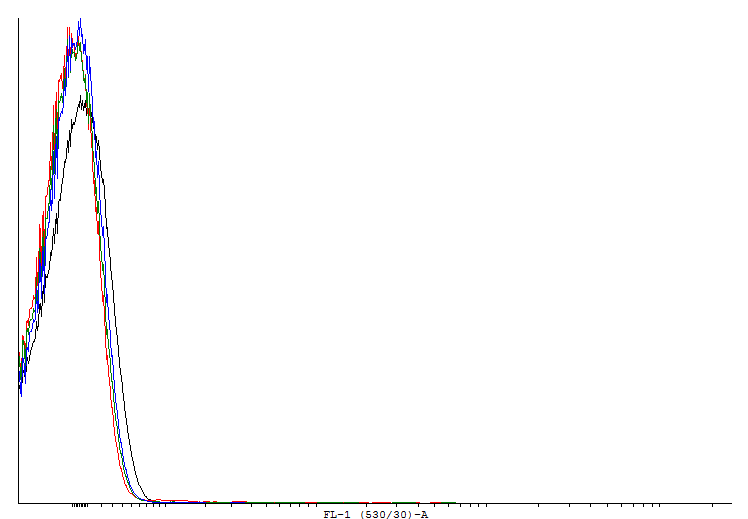
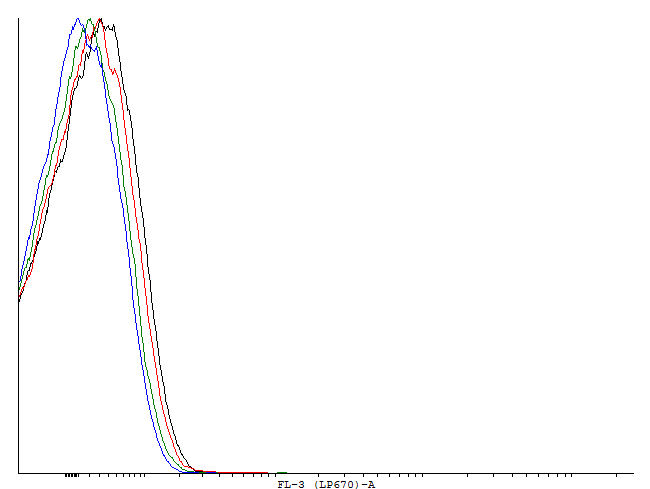
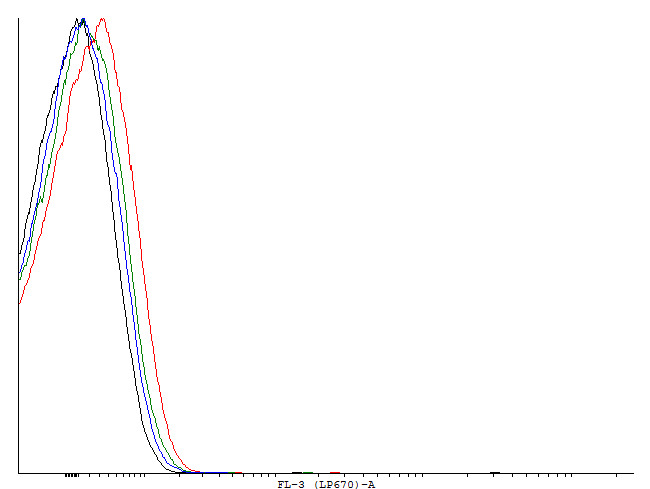
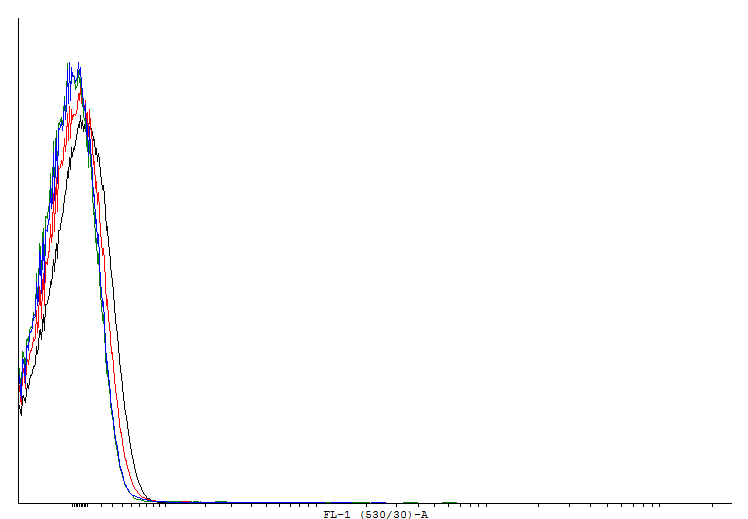
| - | | | + | |colspan="4"| '''Figure 1.''' Flow cytometer data obtained at different time-points during exponential growth of cells carrying different LasR autoinducing loops in presence of 100 nM HSL. |
| - | Figure | + | |
| | | | ||
| - | |||
| - | |||
| - | |||
| - | |||
| - | |||
| - | |||
| - | |||
| - | |||
| - | |||
| - | |||
| - | |||
| - | |||
| - | |||
| - | |||
| - | |||
| - | |||
| - | |||
|} | |} | ||
| + | |||
| + | {{FooterGroningen2011}} | ||
Latest revision as of 23:35, 21 September 2011
LasR autoinducing loop family
Our second memory unit consists of a LasR gene(Bba_C0179) driven the LasB promoter(Bba_R0079). LasR only activates transcription in the presence of HSL, this was added to the medium in a concentration of 100nM.
Leakage of the LasR autoinducing loops
To estimate the autoactivation of the LasR loop through a leaky promoter we measured fluorescence of cells carrying an pSB1K3 plasmid with the autoinducing loop biobrick (different variants) and the plasmid pSB1A3 with an input(PLacI controlling LasR) as well as the output (PlasB controlling RFP-LVA). The measurements were done in a presence of 100nM PAI.
 "
"


