Team:Wageningen UR/Project/DevicesSetup

From 2011.igem.org

(Difference between revisions)
(Custom fluidic device designed by Team Wageningen UR to measure oscillations)
 
(23 intermediate revisions not shown)
Line 23: Line 23:
{{:Team:Wageningen_UR/Templates/Style | text= __NOTOC__
-
=== Setup ===
+
=== Choosing the ideal bacterial growing platform ===
-
<!--
+
In order to physically constrain the bacteria, Hasty used a trapping chamber as depicted in Figure 1. The chamber he used was 100 by 100 by 1 micron. This caused the cells to grow in a monolayer. AHL and excess cells were flushed away through the main channel [1].
-
In order to physically constrain the bacteria, Hasty used a trapping chamber as depicted in Figure Xsome below. The chamber had the dimensions of 1X1 micron. This limited the cell growth to forming a monolayer (sentence). Excess cells and AHL were flushed away through the main chanel. [REF]
+
[[File:Hasty_device_WUR.png|200px|center]]
 +
[[File:Legend_device_WUR.png|140px|center]]
-
[[File:Hasty_device_WUR.png|250px|center]] [ref]
+
'''Fig.1''' The micro-sieve seemed promising for creating a monolayer of cells. The cells could be drawn toward the sieve by applying an under pressure (for example with a syringe). Since the Top10 ''E.coli'' strain used for our transformations does not form biofilms, additional cells would be flushed away once all the pores of the micro-sieve are blocked. However, the flow over this monolayer is in a different dimensional plane (compare figure 1 & 2). The direction of the flow over the micro-sieve can be seen in figure 2.
-
[[File:Legend_device_WUR.png|180px]]
 
-
To create a monolayer, the micro-sieve seemed promising. The cells could be drawn toward the sieve by manually applying an under pressure with a syringe. Since the Top10 ''e.coli'' strain used for our transformations does not form biofilms, additional cells would be flushed away once all the pores of the micro-sieve are blocked. However the resulting flow over this monolayer turned out to be in the wrong dimensional plane (how to say this?). The direction of the flow over the micro-sieve can be seen in figure Xsome+1.
+
[[File:Micro-sieve_device_WUR.png|270px|center]]
 +
'''Fig.2:''' This setup imposes the problem that the diffusion of AHL is much slower than the flow rate over the sieve. Therefore, the AHL produced will always be flushed away before a uniform concentration can be established over the whole cell culture, thus preventing any synchronized behavior to arise. The use of a microsieve in the course of our iGEM project was therefore discarded.
 +
The problem described above does not arise when using the microdish. In the 40 micron deep wells the cells can be trapped and AHL will have a better chance to establish a uniform concentration throughout the well. This will create a higher chance of synchronized oscillatory behavior of the cells growing in a well. Special care has to be taken with the velocities of the fluid flowing over the wells: if the flow rate is too high, the cells will be spilled out of the wells. This behavior was observed under the microscope.
-
[[File:Micro-sieve_device_WUR.png|300px|center]]
 
-
The setup as shown above imposes the problem that the diffusion of AHL is much slower than the flow rate over the sieve. Therefore the AHL will always be flushed away before a uniform concentration can be established over the whole cell culture, thus preventing any synchronized behaviour to arise. The use of a micro-sieve in the course of our iGEM project was therefore discarded.
+
[[File:Micro-dish1_device_WUR.png|290px]] [[File:Flushingoutofwells_WUR.gif|300px|right]]
 +
'''Fig.3 (Top)'''
 +
                                         
 +
'''Fig.4 (Right)'''
-
[[File:Micro-dish1_device_WUR.png|350px|center]]
 
-
<!--  [[File:Flushingoutofwells_WUR.gif|280px]] -->
 
 +
Because it is not necessary for our system to have a flow going over the wells we eventually only used bottom flow, as depicted in figure 5. Our resulting setup enabled us to bottom feed our bacteria, this is depicted in figure 6. This allowed the measurements to be taken continuously for various hours, as nutrients could diffuse through the bottom of the wells. Measurements were taken with the use of our LEGO robot (see [https://2011.igem.org/Team:Wageningen_UR/Project/DevicesFunFacts fun facts]).
 +
[[File:Micro-dish2_device_WUR.png|270px]] [[File:Bottom_feed_WUR.png‎|470px|right]]
 +
'''Fig.5 (Top)''' ''Using microdish with bottom flow''
-
[[File:Micro-dish2_device_WUR.png|300px|center]]
+
'''Fig.6 (Right)''' ''Applying bottom feeding to keep the cells in the wells alive''
-
As a result, the bacteria were bottom fed as seen in the scheme in figure Xsomeplussomemore. This allowed the measurements to be taken continuously for various hours.
 
-
[[File:Bottom_feed_WUR.png‎|500px|center]]
 
-
'''Fig.Xwhatever:''' ''Applying bottom feeding to keep the cells in the wells alive''
+
As also mentioned in the [[Team:Wageningen_UR/Project/Devices| design]] section of the device, the chamber was constructed in such a way that it was possible to place it under a fluorescence microscope for measuring GFP and RFP.
 +
[[File:Closeup_device_WUR.JPG|200px]] [[File:Setup_WUR.jpg|500px|right]]
-
[[Team:Wageningen_UR/Project/ModelingProj1#Modeling_synchronized_oscillations| back to top]]
+
'''Fig.7 (Top):''' ''Devices under the microscope''
-
-->
+
-
Another concern for the setup of the device was to be able to gain control over the flow rate. According to Bernoulli's principle, the velocity of a fluid can be influenced by varying the height of the medium bottle. This approach was also used in the paper cited above. Figure X. shows the corresponding setup and the applying equations.
+
'''Fig.8 (Right):''' ''Entire setup of the system around the fluorescence microscope''
-
[[File:Scheme_setup1_WUR.png|500px|left]][[File:Setup1_WUR.JPG|250px]]
+
.
-
[[File:Equations_bernoulli_WUR.png|center]]
 
-
'''Fig.X:''' ''Setup of the device using Bernoulli's principle to control the velocity of the fluid.''
 
-
However, as described on the [[Team:Wageningen_UR/Project/ModelingProj1#Conclusions_for_our_system| modeling page]], the dimensions of our fluidic device did not allow the aimed for precise control over the flow rate. This was tested both by calculating some theoretical values applicable for our device and running pilot experiments with water. Furthermore the obtained flow rates were also much faster than the flow rates in which oscillations were to be expected. This was solved by expanding our setup to incorporate the use of a syringe pump which controls the inflow. Figure X+1 shows the new setup.
 
-
[[File:Scheme_setup2_WUR.png|500px|center]]
 
-
'''Fig.X+1:''' ''Setup of the device using a pump to control the velocity of the fluid.''
 
-
As already mentioned in the [[Team:Wageningen_UR/Project/Devices| design]] section of the device, the chamber was constructed in such a way that it was possible to place it under a fluorescence microscope for measuring GFP.
+
[[Team:Wageningen_UR/Project/DevicesSetup#Custom fluidic device designed by Team Wageningen UR to measure oscillations| back to top]]  
-
[[File:Closeup_device_WUR.JPG|200px]][[File:Setup_WUR.jpg|500px|right]]
+
=== Measuring oscillations ===
-
'''Top:''' ''Devices under the microscope''
+
During our plate reader experiments we observed oscillatory behavior of transformed ''E.coli'' containing the [[Team:Wageningen_UR/Project/CompleteProject1Description#3._Designs| streamlined construct]]. This suggested oscillations could occur even without applying any flow over the wells. Letting the [[Team:Wageningen_UR/Project/ModelingProj1#Writing_a_modeling_tool_in_Matlab| modeling tool]] iterate over a range of cell densities while keeping the flow rate constant at 0 confirmed that [[Team:Wageningen_UR/Project/ModelingProj1#Preliminary_conclusions_for_our_system| oscillations could occur]] at high cell densities. Therefore the measurements were taken without applying any flow.
-
'''Right:''' ''Entire setup of the system around the fluorescence microscope''
 
-
.
+
[[File:Measuring_GFP_WUR.jpg|500px|center]]
 +
 
 +
 
 +
For the experiments, an overnight culture of the cells containing our construct was spun down and resuspended in PBS. The resuspended culture was inoculated in the device and left in the chamber to settle down for a while. Since the bacteria were bottom fed with LB as seen in the setup section in [[Team:Wageningen_UR/Project/DevicesSetup#Controlling_cell_growth| figure 6]], only the bacteria which settled down in the wells survived, while the bacteria in PBS starved to death. This is shown in the short video below. The pictures were taken every ten minutes.
 +
 
 +
[[File:PBS_cellgrowth_bottomfeed-1.tif|center]]
 +
 
 +
The video shows the microdish directly after inoculation, when the bacteria are still floating around everywhere in the chamber. After a while the bacteria which are in PBS start to die, whereas the bacteria in the wells survive.
 +
 
 +
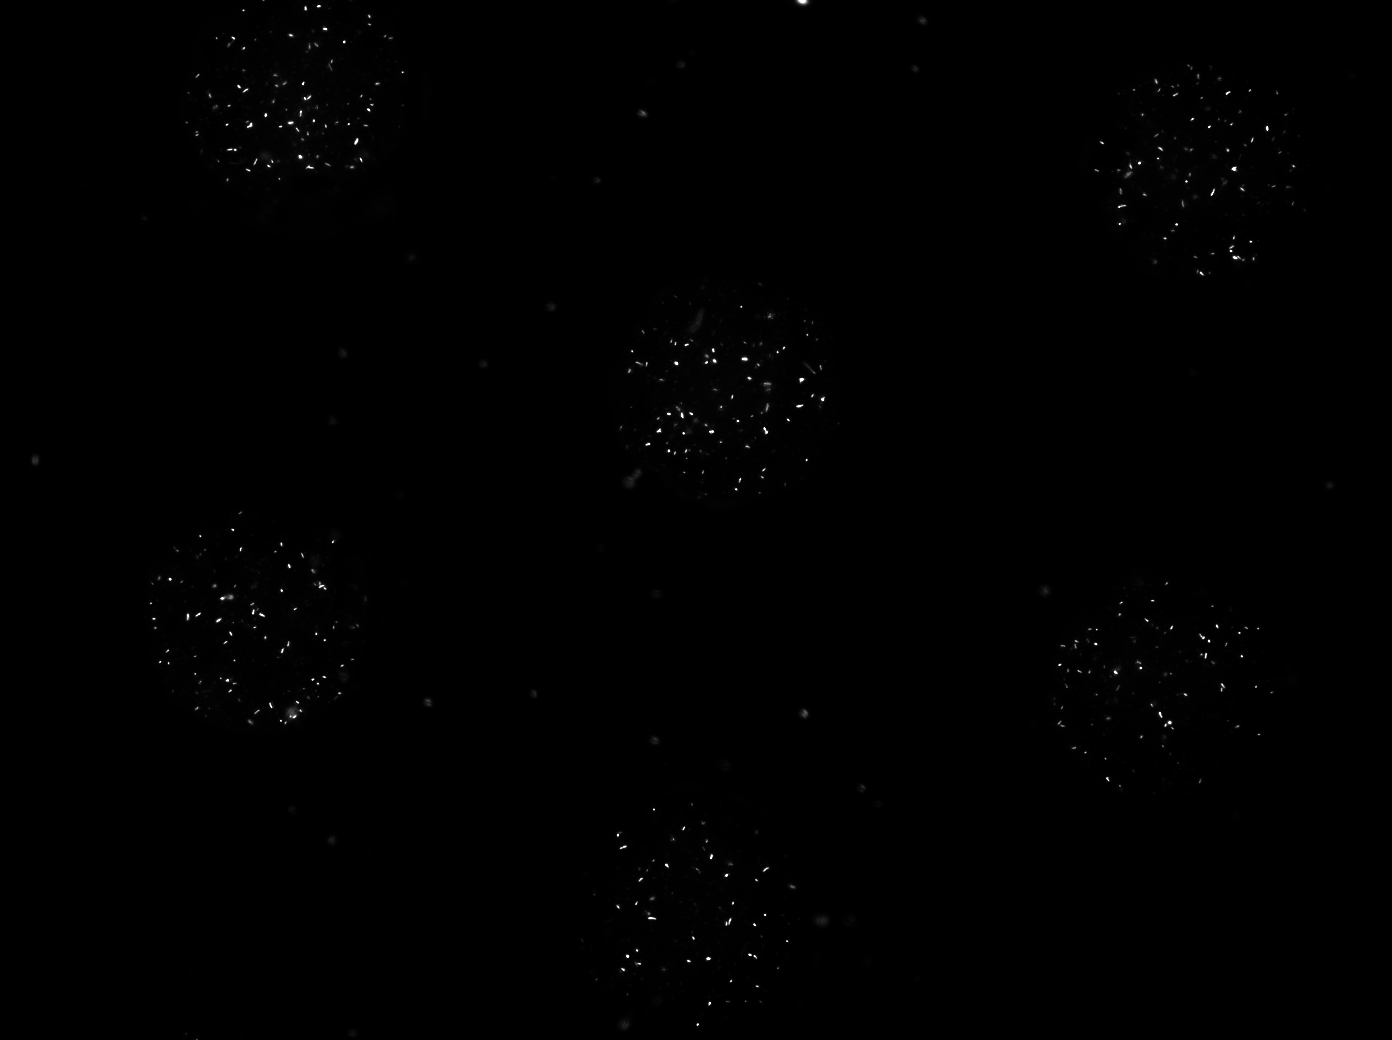
After letting the bacteria grow in this manner for 2-3 hours, the PBS was removed with the same syringe that was used to inoculate. The chamber was then left to dry out overnight. The two pictures depicted below show the microdish with a ptet-GFP strain growing in the wells directly before addition and directly after removal of the PBS.
 +
 
 +
[[File:ptetGFP_PBS.jpg|350px]]  [[File:ptetGFP_PBSremoved.jpg|350px|right]]
 +
'''Fig.9''' ''Microdish with ptetGFP inoculum in PBS (left) and cells in wells after removal of the PBS (right)''
 +
                                                   
 +
For the experiment depicted above, the PBS was removed before all the cells died. The procedure varied depending on how well the bacteria settled down in the wells. They were left to grow in the device for an additional night and the measurements were then taken in a 10 minute interval during the next day. This was done for two reasons: for one the chamber had to be completely dried out before measurements could be taken, otherwise the remaining liquid would condense through the heat of the light and blur the pictures. The second reason was that - as mentioned before - [[Team:Wageningen_UR/Project/ModelingProj1#Preliminary_conclusions_for_our_system| our modeling]] suggested that - when applying no flow - the oscillations would only occur when starting with a high cell density.
 +
[[Team:Wageningen_UR/Project/DevicesSetup#Custom fluidic device designed by Team Wageningen UR to measure oscillations| back to top]]
-
[[Team:Wageningen_UR/Project/DevicesSetup#Customary_fluidic_device_designed_by_Team_Wageningen_UR_to_measure_oscillations| back to top]]
+
'''Links and references:'''
 +
[1][http://www.nature.com/nature/journal/v463/n7279/abs/nature08753.html Danino et al. 2010]
}}
}}

Latest revision as of 02:15, 22 September 2011

Building a Synchronized Oscillatory System

Custom fluidic device designed by Team Wageningen UR to measure oscillations

Choosing the ideal bacterial growing platform

In order to physically constrain the bacteria, Hasty used a trapping chamber as depicted in Figure 1. The chamber he used was 100 by 100 by 1 micron. This caused the cells to grow in a monolayer. AHL and excess cells were flushed away through the main channel [1].

Hasty device WUR.png
Legend device WUR.png

Fig.1 The micro-sieve seemed promising for creating a monolayer of cells. The cells could be drawn toward the sieve by applying an under pressure (for example with a syringe). Since the Top10 E.coli strain used for our transformations does not form biofilms, additional cells would be flushed away once all the pores of the micro-sieve are blocked. However, the flow over this monolayer is in a different dimensional plane (compare figure 1 & 2). The direction of the flow over the micro-sieve can be seen in figure 2.


Micro-sieve device WUR.png

Fig.2: This setup imposes the problem that the diffusion of AHL is much slower than the flow rate over the sieve. Therefore, the AHL produced will always be flushed away before a uniform concentration can be established over the whole cell culture, thus preventing any synchronized behavior to arise. The use of a microsieve in the course of our iGEM project was therefore discarded.

The problem described above does not arise when using the microdish. In the 40 micron deep wells the cells can be trapped and AHL will have a better chance to establish a uniform concentration throughout the well. This will create a higher chance of synchronized oscillatory behavior of the cells growing in a well. Special care has to be taken with the velocities of the fluid flowing over the wells: if the flow rate is too high, the cells will be spilled out of the wells. This behavior was observed under the microscope.


Micro-dish1 device WUR.png

Fig.3 (Top)

Fig.4 (Right)


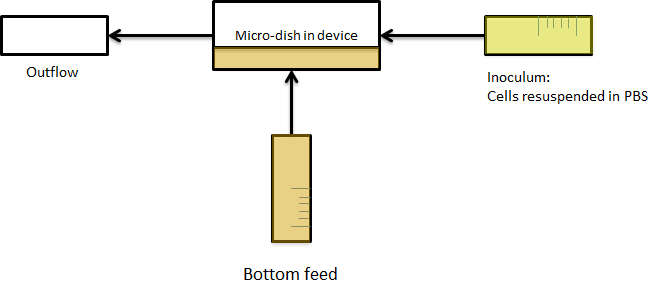
Because it is not necessary for our system to have a flow going over the wells we eventually only used bottom flow, as depicted in figure 5. Our resulting setup enabled us to bottom feed our bacteria, this is depicted in figure 6. This allowed the measurements to be taken continuously for various hours, as nutrients could diffuse through the bottom of the wells. Measurements were taken with the use of our LEGO robot (see fun facts).

Micro-dish2 device WUR.png
Bottom feed WUR.png

Fig.5 (Top) Using microdish with bottom flow

Fig.6 (Right) Applying bottom feeding to keep the cells in the wells alive


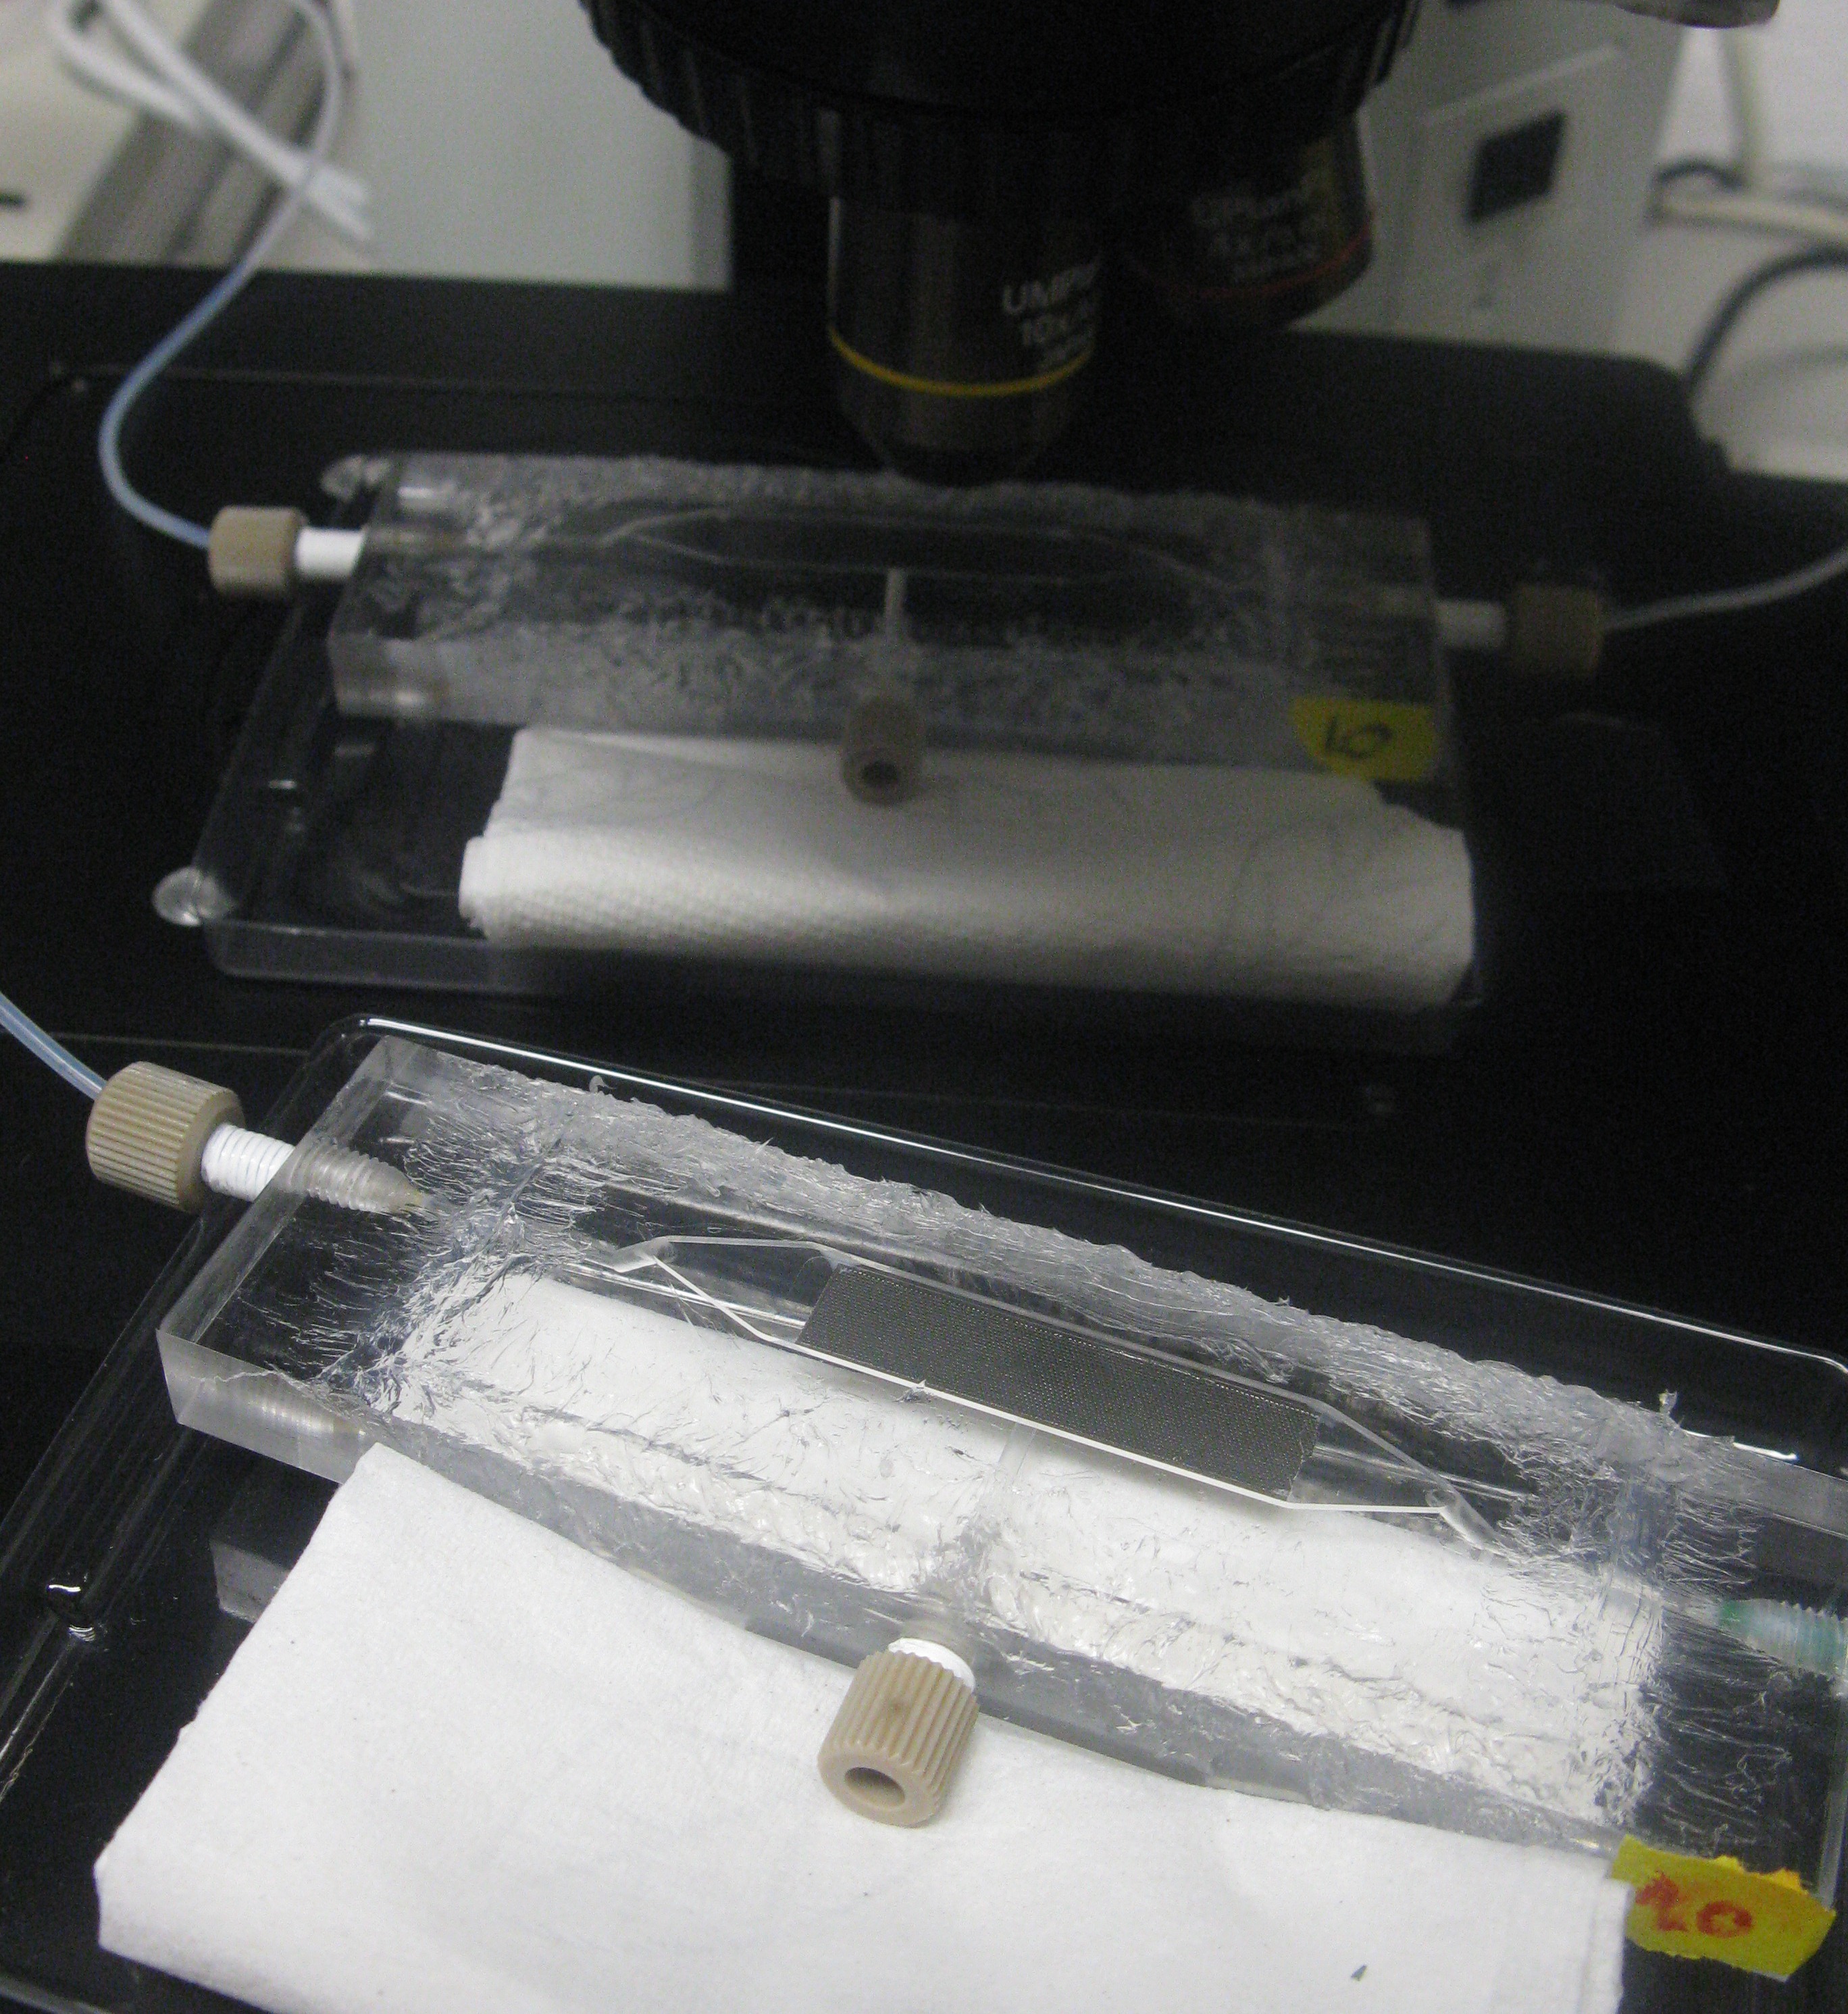
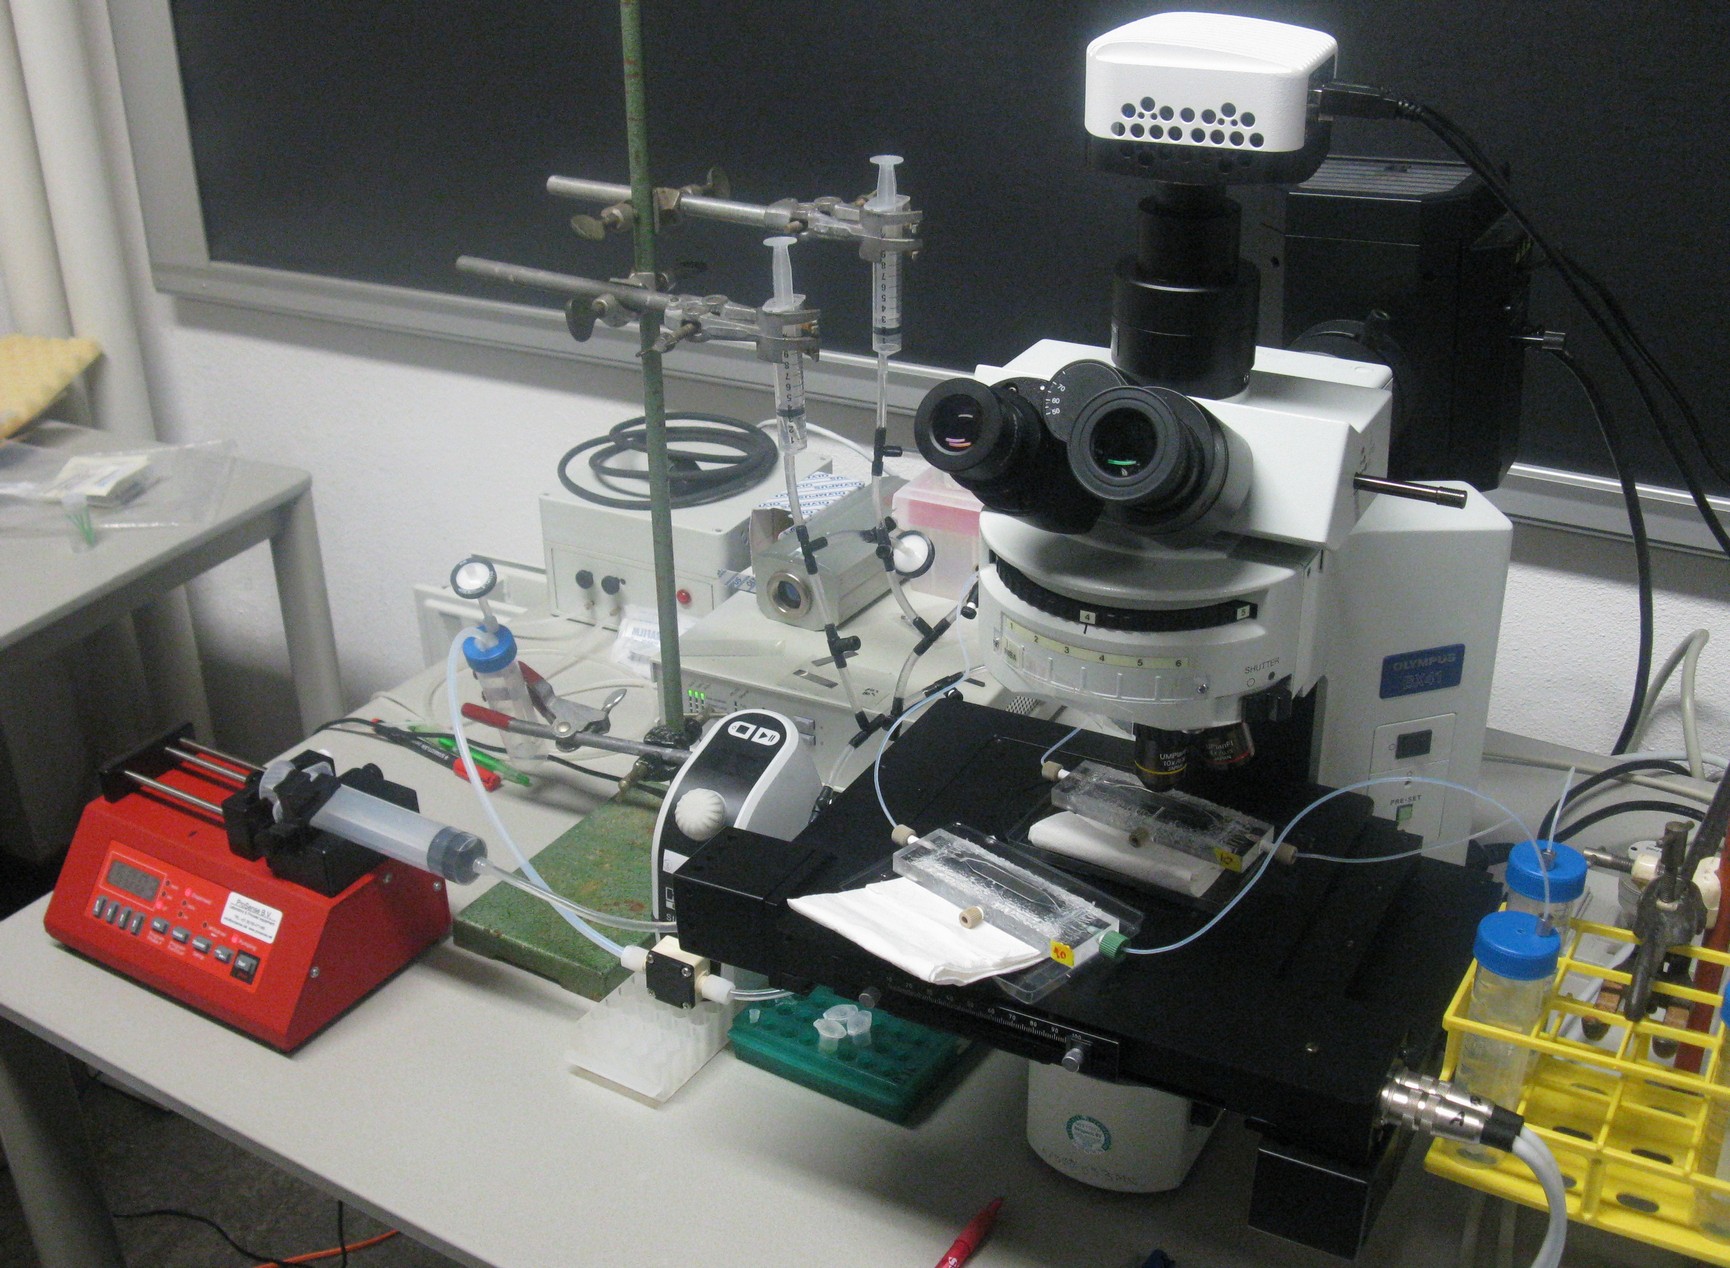
As also mentioned in the design section of the device, the chamber was constructed in such a way that it was possible to place it under a fluorescence microscope for measuring GFP and RFP.


Closeup device WUR.JPG
Setup WUR.jpg


Fig.7 (Top): Devices under the microscope

Fig.8 (Right): Entire setup of the system around the fluorescence microscope

.


back to top


Measuring oscillations

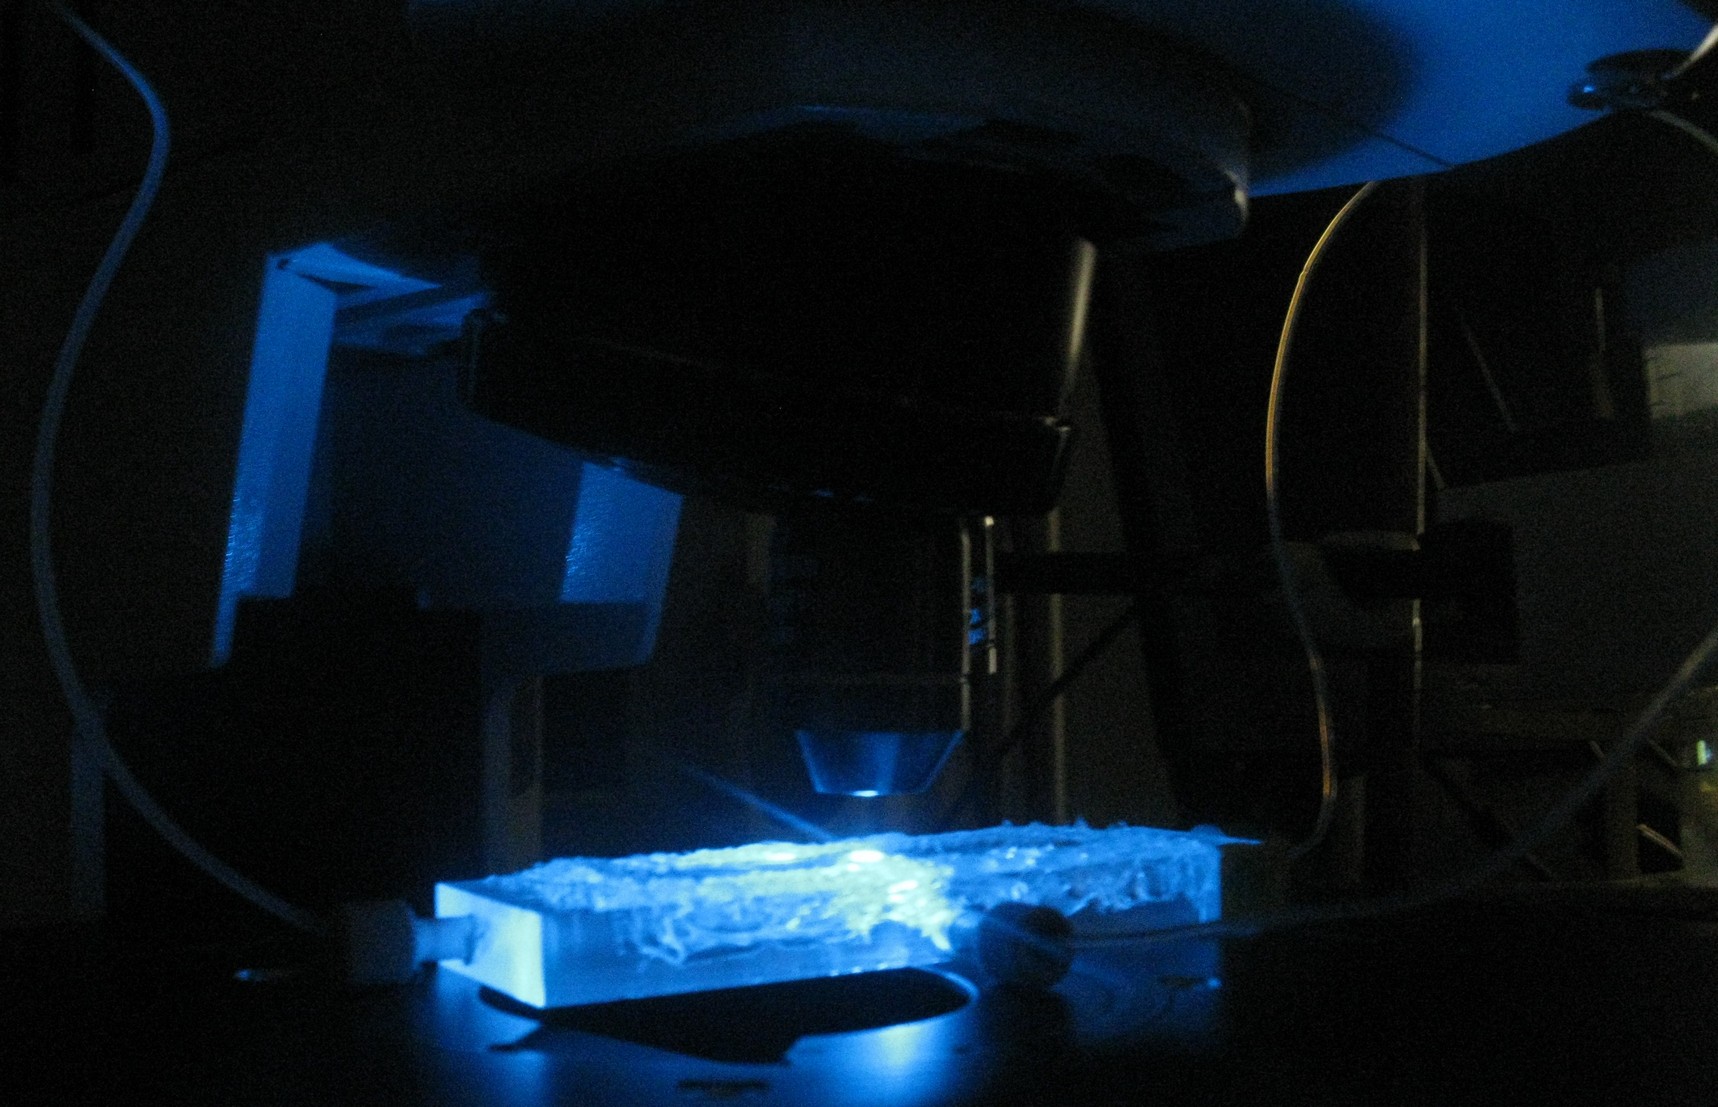
During our plate reader experiments we observed oscillatory behavior of transformed E.coli containing the streamlined construct. This suggested oscillations could occur even without applying any flow over the wells. Letting the modeling tool iterate over a range of cell densities while keeping the flow rate constant at 0 confirmed that oscillations could occur at high cell densities. Therefore the measurements were taken without applying any flow.


Measuring GFP WUR.jpg


For the experiments, an overnight culture of the cells containing our construct was spun down and resuspended in PBS. The resuspended culture was inoculated in the device and left in the chamber to settle down for a while. Since the bacteria were bottom fed with LB as seen in the setup section in figure 6, only the bacteria which settled down in the wells survived, while the bacteria in PBS starved to death. This is shown in the short video below. The pictures were taken every ten minutes.

The video shows the microdish directly after inoculation, when the bacteria are still floating around everywhere in the chamber. After a while the bacteria which are in PBS start to die, whereas the bacteria in the wells survive.

After letting the bacteria grow in this manner for 2-3 hours, the PBS was removed with the same syringe that was used to inoculate. The chamber was then left to dry out overnight. The two pictures depicted below show the microdish with a ptet-GFP strain growing in the wells directly before addition and directly after removal of the PBS.

PtetGFP PBS.jpg
PtetGFP PBSremoved.jpg


Fig.9 Microdish with ptetGFP inoculum in PBS (left) and cells in wells after removal of the PBS (right)


For the experiment depicted above, the PBS was removed before all the cells died. The procedure varied depending on how well the bacteria settled down in the wells. They were left to grow in the device for an additional night and the measurements were then taken in a 10 minute interval during the next day. This was done for two reasons: for one the chamber had to be completely dried out before measurements could be taken, otherwise the remaining liquid would condense through the heat of the light and blur the pictures. The second reason was that - as mentioned before - our modeling suggested that - when applying no flow - the oscillations would only occur when starting with a high cell density.


back to top


Links and references:

[1][http://www.nature.com/nature/journal/v463/n7279/abs/nature08753.html Danino et al. 2010]