Team:Wageningen UR/Project/ModelingProj1

From 2011.igem.org

(Difference between revisions)
(Modeling synchronized oscillations)
 
(44 intermediate revisions not shown)
Line 27: Line 27:
{{:Team:Wageningen_UR/Templates/NavigationLeft}}
{{:Team:Wageningen_UR/Templates/Style | text= __NOTOC__
 +
=== Mathematical model ===
 +
Since our BioBricked oscillatory system is based on the circuit published by Danino et al. in the paper “A synchronized quorum of genetic clocks” [1], our first model of the system is a reproduction of the mathematical model in the supplementary information [2] accompanying the mentioned publication. In their simulations, Danino et al. used a set of four delay differential equations, which we also used as starting point for our modeling work. 
-
=== Short repetition of the Hasty construct used as base for our system ===
+
The steps (transcription, translation, maturation etc.) from the luxI and aiiA genes to the corresponding proteins are not modeled separately. Instead, the delay of the correlation between the internal AHL concentration, which triggers the expression of the genes, and the corresponding AiiA and LuxI concentrations is simulated by a Hill function. This Hill function takes the history of the system into account, i.e. the concentration of AHL at the time it binds to LuxR to form the activation complex.
-
For a better understanding of the equations which were used for the modeling of the system, figure 1 shows a short repetition of the circuit published by Danino et al. in the paper [http://www.nature.com/nature/journal/v463/n7279/abs/nature08753.html “A synchronized quorum of genetic clocks”], in our team commonly referred to as the "Hasty construct", which was used as a base for our design.  
+
The experimental setup of the cited paper involved the use of microfluidic devices, in which the cell density could be kept constant. Excess cells were flushed away with a predefined flow rate. This also controlled the external AHL concentration. More information can be found in the description about the [[Team:Wageningen_UR/Project/DevicesSetup| setup]] of the device.
-
[[File:mainproject01.png|center]]
+
[[Team:Wageningen_UR/Project/ModelingProj1#Modeling_synchronized_oscillations| back to top]]
-
'''Fig.1:''' ''Basic oscillating genetic circuit as published by Danino & Hasty.'' [http://www.nature.com/nature/journal/v463/n7279/abs/nature08753.html]
 
-
The genes luxI and aiiA can be expressed when a AHL-LuxR complex binds to the promoter region. The circuit uses both a positive and negative feedback loop to control the AHL concentration and therefore the expression of the resulting proteins LuxI and AiiA. In the positive loop, LuxI generates more AHL, which, together with LuxR, can form more of the activating AHL-LuxR complex and therefore stimulates even more production of LuxI and consequently AHL. This complex also activates the expression of aiiA. In the negative feedback loop, AiiA degrades the AHL produced. For more detailed information about the circuit read more about the [[Team:Wageningen_UR/Project/CompleteProject1Description#2._Mechanism|  mechanism]] in the [[Team:Wageningen_UR/Project/CompleteProject1Description|  complete project description.]]
+
=== Writing a modeling tool in Matlab ===
 +
For the first simulations, the same parameters were used as in the cited paper, the only variables thus being the cell density and flow rate. To get an idea about the different conditions in which oscillations could occur, our team created a script for a Matlab modeling tool which uses nested for-loops to vary the flow rate and cell density over a range of values. The resulting tool allows the user to enter the range in which the variables should be varied. The script then iterates over the values and plots graphs of all combinations possible for that range of values. Figure 2 shows an example output of the script.
 +
[[File:Example_output_graphs_WUR.png|770px|center]]
-
[[Team:Wageningen_UR/Project/ModelingProj1#Modeling_synchronized_oscillations| back to top]]
+
'''Fig.1:''' ''Variation of output graphs depending on the different starting conditions''
-
=== Mathematical model of the Hasty construct ===
 
-
Since our bio bricked oscillatory system is based on the design seen above, our first model of the system is a reproduction of the mathematical model in the [http://www.nature.com/nature/journal/v463/n7279/suppinfo/nature08753.html supplementary information] accompanying the publication mentioned. In their simulations, Danino et al. used the following set of delay differential equations, which we also used as starting point for our modeling work.
+
[[Team:Wageningen_UR/Project/ModelingProj1#Modeling_synchronized_oscillations| back to top]]
-
[[File:Equations_hasty_WUR.png|350px|left]]
 
 +
=== Preliminary conclusions for our system ===
 +
The first observation from the model was that for oscillations to occur, the flow rates may not be too fast. This especially holds at low cell densities (see output graphs above). Since the device used for our system has larger dimensions than the microfluidic device used by Danino et al. the flow rates required could not be achieved by varying height differences alone. <!-- Further information can be found in the information about the [[Team:Wageningen_UR/Project/Devices#Setup| platform used to measure oscillations.]] -->
-
'''left:''' Set of delay differential equations derived by Danino et al. to model the oscillatory behaviour of the design using a positive and negative feedback loop. }}
+
Furthermore, an interesting observation was that applying a flow rate over the cells was not essential to obtain oscillations. Figure 3 shows how - according to the model - oscillations can potentially occur at 0 flow rate. Interesting is that this happens only at high cell densities.
-
{|
+
[[File:Model0flow_WUR.png|770px|center]]
-
|'''A'''||:||AiiA
+
-
|-
+
-
|'''I'''||:||LuxI
+
-
|-
+
-
|'''Hi'''||:||internal AHL
+
-
|-
+
-
|'''He'''||:||external AHL
+
-
|}
+
-
{{:Team:Wageningen_UR/Templates/Style | text= __NOTOC__
+
'''Fig.2:''' ''Graphs showing oscillatory behavior increasing with cell density even when the flow rate is set to 0''
 +
Disregarding the strictly mathematical model, some more conclusions were drawn from modeling work as to whether to use a microdish or microsieve as platform for measuring oscillations. This is described in more detail in the [[Team:Wageningen_UR/Project/DevicesSetup| section about the setup of the device.]]
 +
[[Team:Wageningen_UR/Project/ModelingProj1#Modeling_synchronized_oscillations| back to top]]
-
The production of AiiA and LuxI depend on the internal AHL concentration in the single cell. The steps (transcription, translation, maturation etc.) from the luxI and aiiA genes to the corresponding proteins are not modeled separately, but the delay of the correlation between the internal AHL concentration and the corresponding AiiA and LuxI is simulated by the following Hill function: 
 
 +
=== Expansion of the model for the double tunable oscillatory construct ===
 +
To model the [[Team:Wageningen_UR/Project/CompleteProject1Description#3._Designs| double tunable oscillator]], the original set of delay differential equations [2] was expanded. This involved adding the effect of the repressor and activator in the form of a Hill function to the differential equations for LuxI and AiiA. The equations for the internal and external AHL concentrations were not changed. The new set of equations is depicted below.
 +
[[File:Equations_enhanced_WUR.png]]
-
[[File:Equations2_hasty_WUR.png|150px]]
+
'''Fig.3''' ''Adjusted set of differential equations for the double tunable oscillator''
 +
Since the LacI repressed hybrid promoter used for this system was designed by the Tokyo iGEM 2007 team [3], the additional terms were derived according to their model. The tetR repressor was then modeled using the same template. The set of equations seen above therefore integrates the features of both models. It does not include differential equations for LuxR, LacI (represses luxI) and tetR (represses aiiA). For the model we assume that these proteins are constitutively produced.
 +
The equations suggest slowing down of protein synthesis at higher cell densities d (first term in the LuxI (eq 1) and AiiA (eq2) equations). The Hill function including a tau describes the delayed production of AiiA and LuxI depending on the internal AHL concentration at a past time point, as explained above. Gamma represents the degradation rate of the respective proteins. LuxI produces AHL, this dependency is shown in the first term of the differential equation for the internal AHL concentration (eq3). The terms proportional to D show the diffusion  of AHL into  and out of the cell.  The flow rate mu, which removes external AHL, is only relevant when actually applying flow and is set to 0 for most of our simulations.  [1]
-
in which tau represents the time step. It can be seen that the function takes the history of the system into account, since the production of the proteins depend on the past concentration of internal AHL as in: [[File:Equations3_hasty_WUR.png]].
+
The terms which were added to the original set of equations showing the influence of the repressor and activator are highlighted below.
 +
[[File :Equations_enhanced_highlighted_WUR.png]]
 +
The parameters of these terms were roughly estimated, and are not yet confirmed. The other parameters were experimentally determined by Danino et al. and the values can be found in their supplementary information [2].
-
[[Team:Wageningen_UR/Project/ModelingProj1#Modeling_synchronized_oscillations| back to top]]
 
 +
[[Team:Wageningen_UR/Project/ModelingProj1#Modeling_synchronized_oscillations| back to top]]
-
=== Writing a modeling tool in matlab ===
 
-
[[File:Oscillation_GUI_WUR.png|center]]
+
=== Writing a new modeling tool for the Synchroscillator ===
 +
The new equations were used to write another Matlab modeling tool, of which the GUI is depicted below.  
-
'''Fig.2:''' ''GUI of the matlab modeling tool created by team Wageningen UR''  
+
[[File:GUI_2_synchroscillator_WUR.png|300px|center]]
 +
'''Fig.5''' ''Revised GUI for the Synchroscillator''
-
For the first simulations, the same values for the parameters were used as in the cited paper and can be found in the [http://www.nature.com/nature/journal/v463/n7279/suppinfo/nature08753.html supplementary information]. To get graphs representing optimal oscillations, our team created a script for a matlab modeling tool which uses nested for-loops to vary the flow rate and cell density over a range of values. The resulting tool allows the user to enter the range in which the variables should be varied. The tool then iterates over the values and plots graphs of all combinations possible for that range of values. Figure 2 shows an example output of the tool.
 
 +
As can be seen in the GUI, the new model allows the construct to be controlled by changing the concentrations of IPTG and aTc. Since the parameters could not be verified by wet lab experiments yet, some example conditions were simulated of which the output graphs are seen below.
-
[[File:Example_output_graphs_WUR.png|770px|center]]  
+
[[File:Graph1_2_synchroscillator_WUR.png|center]]  
-
'''Fig.2:''' ''Variation of output graphs depending on the different starting conditions''
 
 +
'''Situation 1:''' ''Only aTc, no IPTG. Some AiiA can be produced, but no production of LuxI, since it is fully repressed by LacI. As a result all AHL is degraded.''
-
[[Team:Wageningen_UR/Project/ModelingProj1#Modeling_synchronized_oscillations| back to top]]
+
[[File:Graph3_2_synchroscillator_WUR.png|center]]
-
=== Conclusions for our system ===
+
'''Situation 2:''' ''Only IPTG, no aTc. LuxI and as a result internal AHL (red curve hidden under green curve) is produced. The production of AiiA is fully repressed.''
-
The first observation from the model was that, for oscillations to occur, the flow rates may not be too fast, especially at lower cell densities. Since the device used for our system has larger dimensions than the microfluidic device used by Danino et al. the flow rates in the velocities required could not be achieved by varying height differences alone. Further information can be found in the information about the [[Team:Wageningen_UR/Project/Devices#Setup| platform used to measure oscillations.]]
 
-
Furthermore, an interesting observation was that applying a flow rate over the cells was not essential to obtain ocillations. Figure 3 shows how, according to the model, oscillations can potentially occur at 0 flow rate. Interesting is that this happens only at high cell densities.
+
[[File:Graph2_2_synchroscillator_WUR.png|center]]
-
[[File:Model0flow_WUR.png|770px|center]]
 
-
'''Fig.3:''' ''Graphs showing oscillatory behaviour increasing with cell density even when the flow rate is set to 0''
+
'''Situation 3:''' ''Equal amounts of IPTG and aTc produce oscillations as seen in previous simulations.''
-
Disregarding the strictly mathematical model, some more conclusions were drawn from modeling work as to which [[Team:Wageningen_UR/Project/Devices| platform]] to use for measuring oscillations.
 
-
[[File:Hasty_device_WUR.png|200px]] [[File:Legend_device_WUR.png|180px]][[File:Micro-sieve_device_WUR.png|300px|right]]
+
[[File:Graph4_2_synchroscillator_WUR.png|380px]] [[File:Graph5_2_synchroscillator_WUR.png|380px]]
-
textextextextexttextextextextexttextextextextexttextextextextexttextextextextexttextextextextexttextextex
 
-
textexttextextextextexttextextextextexttextextextextexttextextextextexttextextextextexttextextextextexttextext
 
-
extextexttextextextextext
 
 +
'''Situation 4 and 5:''' ''Interesting behavior of the system when adding IPTG and aTc in reversed proportions.''
-
[[File:Micro-dish1_device_WUR.png|350px]] [[File:Flushingoutofwells_WUR.gif|280px|right]]
+
From the model it can be concluded that the oscillatory behavior can indeed be fine tuned. However, wet-lab experiments are needed to quantify the parameters.  
-
textextextextexttextextextextexttextextextextexttextextextextexttextextextextexttextextextextexttextextex
+
-
textexttextextextextexttextextextextexttextextextextexttextextextextexttextextextextexttextextextextexttextext
+
-
extextexttextextextextext
+
-
 
+
-
 
+
-
[[File:Micro-dish2_device_WUR.png|300px|center]]
+
-
 
+
-
textextextextexttextextextextexttextextextextexttextextextextexttextextextextexttextextextextexttextextex
+
-
textexttextextextextexttextextextextexttextextextextexttextextextextexttextextextextexttextextextextexttextext
+
-
extextexttextextextextex
+
-
 
+
[[Team:Wageningen_UR/Project/ModelingProj1#Modeling_synchronized_oscillations| back to top]]
[[Team:Wageningen_UR/Project/ModelingProj1#Modeling_synchronized_oscillations| back to top]]
 +
'''Links and references:'''
-
=== Expansion of the model for the double tunable oscillatory construct ===
+
[1][http://www.nature.com/nature/journal/v463/n7279/abs/nature08753.html Danino et al. 2010]
-
To accomodate the idea of the [[Team:Wageningen_UR/Project/CompleteProject1Description| double tunable oscillator]], the original set of delay differential equations shown above was expanded by two additional differential equations showing the behaviour of the lacI and tetR repressor. The equations for the LuxI and AiiA production were then expanded by a term showing the influence of the corresponding repressor lacI for LuxI and tetR for Aiia respectively. Below the adjusted set of differential equations is shown.
+
[2][http://www.nature.com/nature/journal/v463/n7279/suppinfo/nature08753.html Supplementary information]
-
'''Top: ''Adjusted set of differential equations for the double tunable oscillator''
+
[3][https://2007.igem.org/Tokyo/Works Tokyo iGEM 2007]
 +
-
Since the lacI repressed hybrid promoter used for this system was designed by the [http://parts.mit.edu/igem07/index.php/Tokyo/Works Tokyo iGEM 2007] team, the equations were derived according to their model. The tetR repressor was then modeled using the same template.
 
-
 
-
 
-
 
-
[[Team:Wageningen_UR/Project/ModelingProj1#Modeling_synchronized_oscillations| back to top]]
 
}}
}}

Latest revision as of 03:31, 22 September 2011

Building a Synchronized Oscillatory System

Modeling synchronized oscillations

Mathematical model

Since our BioBricked oscillatory system is based on the circuit published by Danino et al. in the paper “A synchronized quorum of genetic clocks” [1], our first model of the system is a reproduction of the mathematical model in the supplementary information [2] accompanying the mentioned publication. In their simulations, Danino et al. used a set of four delay differential equations, which we also used as starting point for our modeling work.

The steps (transcription, translation, maturation etc.) from the luxI and aiiA genes to the corresponding proteins are not modeled separately. Instead, the delay of the correlation between the internal AHL concentration, which triggers the expression of the genes, and the corresponding AiiA and LuxI concentrations is simulated by a Hill function. This Hill function takes the history of the system into account, i.e. the concentration of AHL at the time it binds to LuxR to form the activation complex.

The experimental setup of the cited paper involved the use of microfluidic devices, in which the cell density could be kept constant. Excess cells were flushed away with a predefined flow rate. This also controlled the external AHL concentration. More information can be found in the description about the setup of the device.


back to top


Writing a modeling tool in Matlab

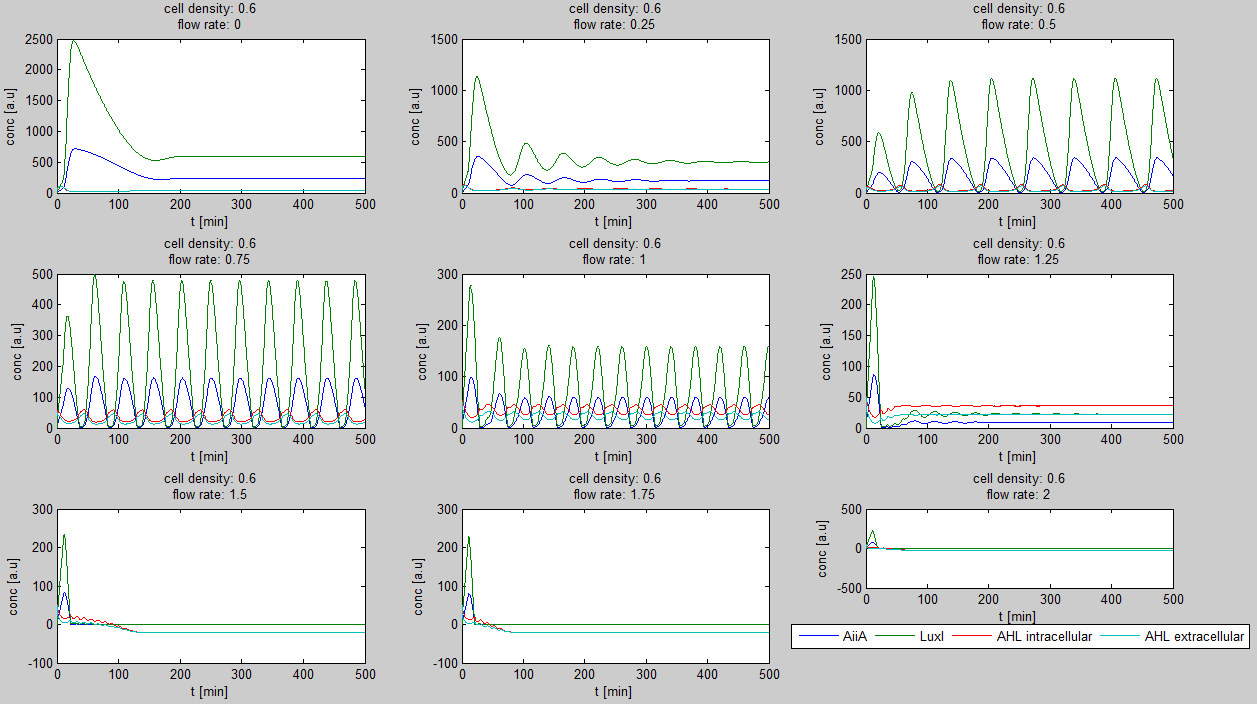
For the first simulations, the same parameters were used as in the cited paper, the only variables thus being the cell density and flow rate. To get an idea about the different conditions in which oscillations could occur, our team created a script for a Matlab modeling tool which uses nested for-loops to vary the flow rate and cell density over a range of values. The resulting tool allows the user to enter the range in which the variables should be varied. The script then iterates over the values and plots graphs of all combinations possible for that range of values. Figure 2 shows an example output of the script.


Example output graphs WUR.png

Fig.1: Variation of output graphs depending on the different starting conditions


back to top


Preliminary conclusions for our system

The first observation from the model was that for oscillations to occur, the flow rates may not be too fast. This especially holds at low cell densities (see output graphs above). Since the device used for our system has larger dimensions than the microfluidic device used by Danino et al. the flow rates required could not be achieved by varying height differences alone.

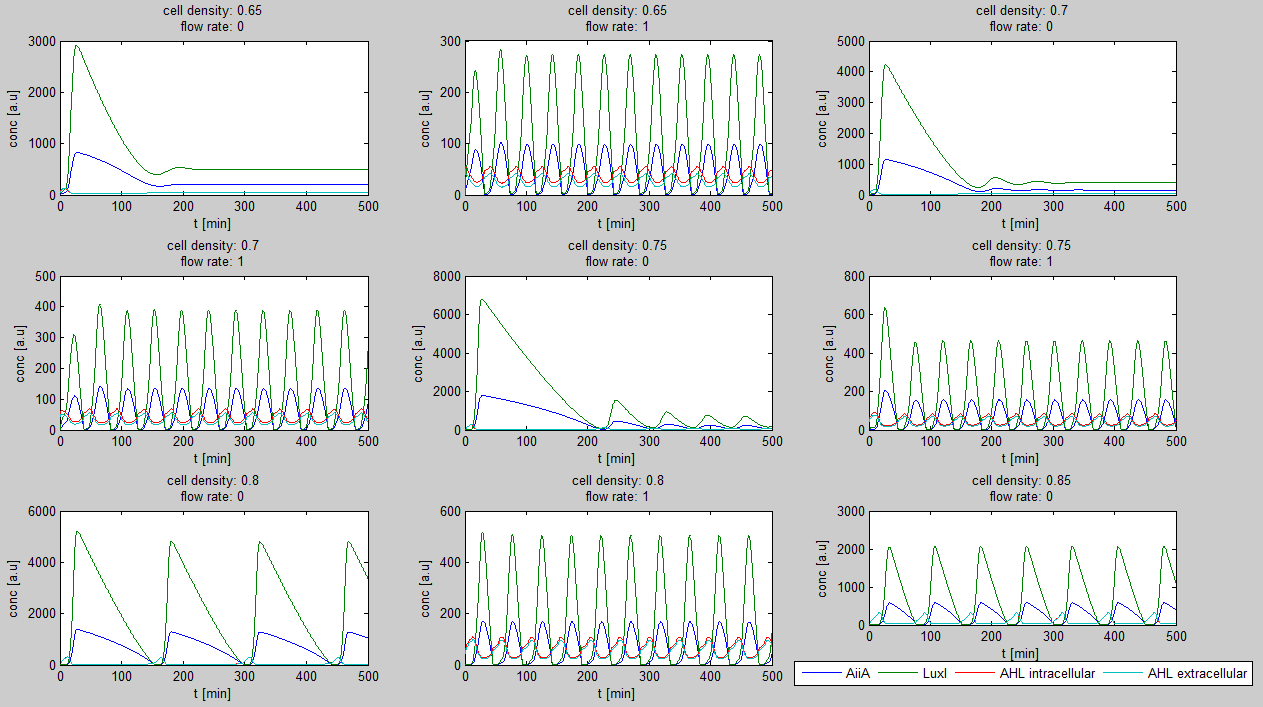
Furthermore, an interesting observation was that applying a flow rate over the cells was not essential to obtain oscillations. Figure 3 shows how - according to the model - oscillations can potentially occur at 0 flow rate. Interesting is that this happens only at high cell densities.

Model0flow WUR.png

Fig.2: Graphs showing oscillatory behavior increasing with cell density even when the flow rate is set to 0

Disregarding the strictly mathematical model, some more conclusions were drawn from modeling work as to whether to use a microdish or microsieve as platform for measuring oscillations. This is described in more detail in the section about the setup of the device.


back to top


Expansion of the model for the double tunable oscillatory construct

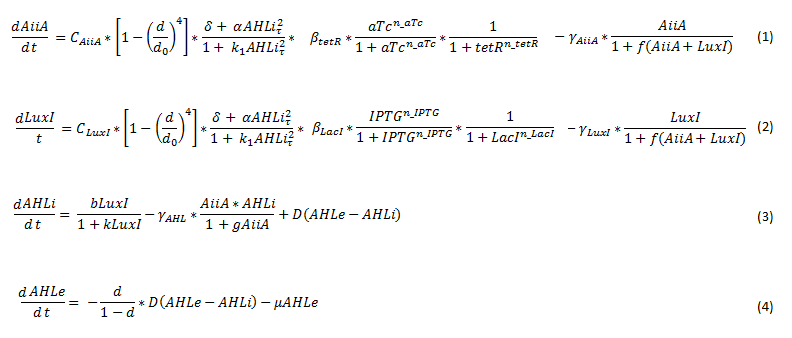
To model the double tunable oscillator, the original set of delay differential equations [2] was expanded. This involved adding the effect of the repressor and activator in the form of a Hill function to the differential equations for LuxI and AiiA. The equations for the internal and external AHL concentrations were not changed. The new set of equations is depicted below.

Equations enhanced WUR.png

Fig.3 Adjusted set of differential equations for the double tunable oscillator

Since the LacI repressed hybrid promoter used for this system was designed by the Tokyo iGEM 2007 team [3], the additional terms were derived according to their model. The tetR repressor was then modeled using the same template. The set of equations seen above therefore integrates the features of both models. It does not include differential equations for LuxR, LacI (represses luxI) and tetR (represses aiiA). For the model we assume that these proteins are constitutively produced.

The equations suggest slowing down of protein synthesis at higher cell densities d (first term in the LuxI (eq 1) and AiiA (eq2) equations). The Hill function including a tau describes the delayed production of AiiA and LuxI depending on the internal AHL concentration at a past time point, as explained above. Gamma represents the degradation rate of the respective proteins. LuxI produces AHL, this dependency is shown in the first term of the differential equation for the internal AHL concentration (eq3). The terms proportional to D show the diffusion of AHL into and out of the cell. The flow rate mu, which removes external AHL, is only relevant when actually applying flow and is set to 0 for most of our simulations. [1]

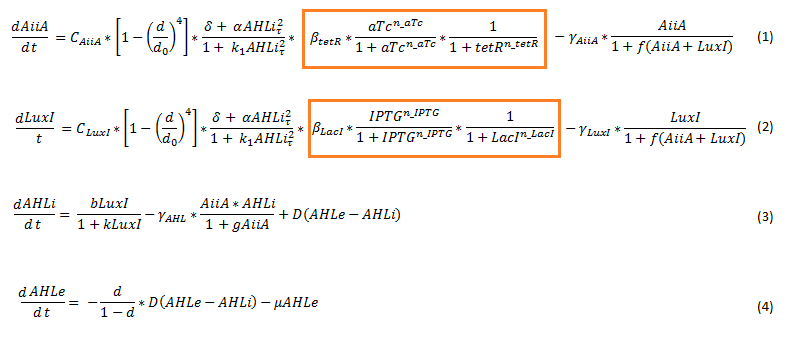
The terms which were added to the original set of equations showing the influence of the repressor and activator are highlighted below.

Equations enhanced highlighted WUR.png

The parameters of these terms were roughly estimated, and are not yet confirmed. The other parameters were experimentally determined by Danino et al. and the values can be found in their supplementary information [2].


back to top


Writing a new modeling tool for the Synchroscillator

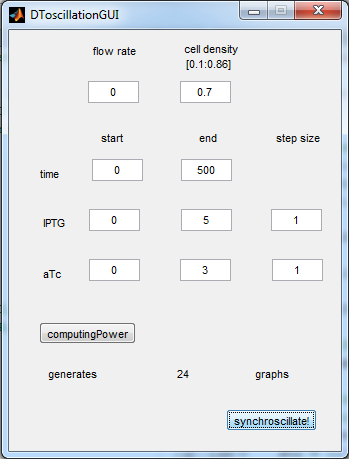
The new equations were used to write another Matlab modeling tool, of which the GUI is depicted below.

GUI 2 synchroscillator WUR.png

Fig.5 Revised GUI for the Synchroscillator


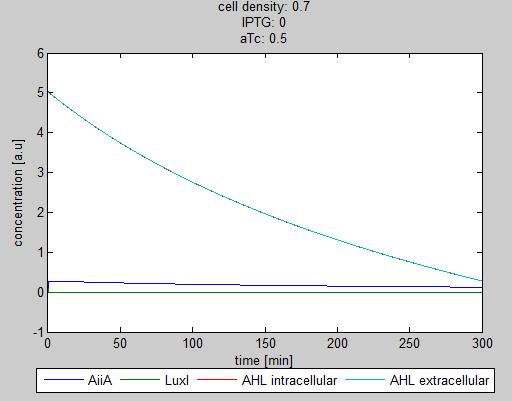
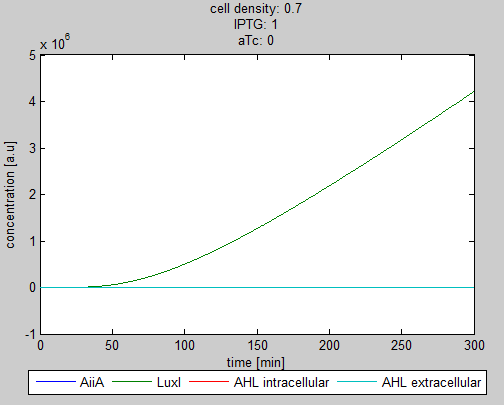
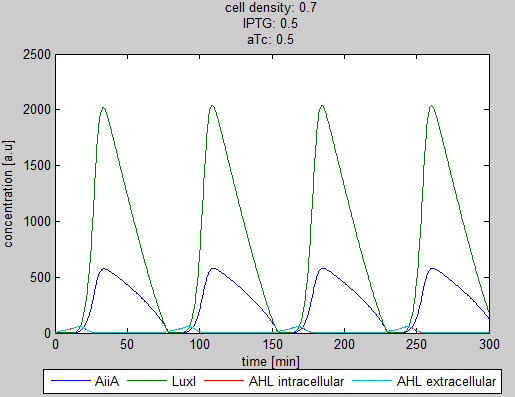
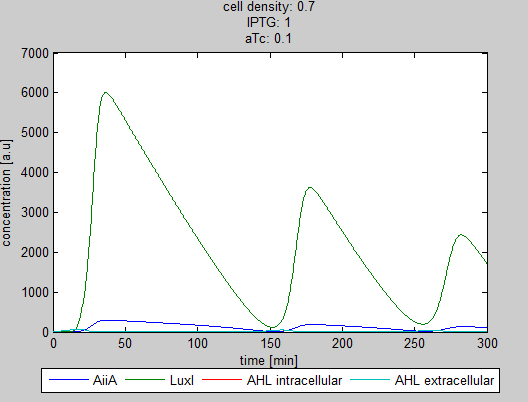
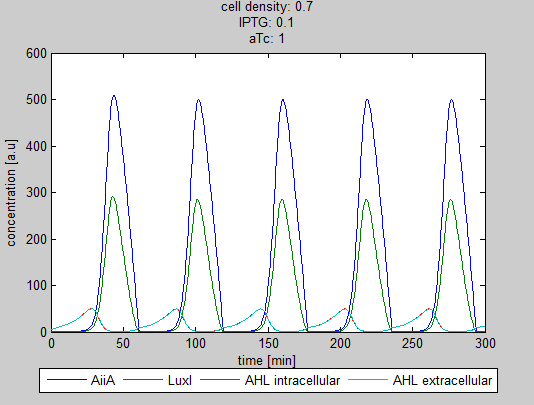
As can be seen in the GUI, the new model allows the construct to be controlled by changing the concentrations of IPTG and aTc. Since the parameters could not be verified by wet lab experiments yet, some example conditions were simulated of which the output graphs are seen below.

Graph1 2 synchroscillator WUR.png


Situation 1: Only aTc, no IPTG. Some AiiA can be produced, but no production of LuxI, since it is fully repressed by LacI. As a result all AHL is degraded.


Graph3 2 synchroscillator WUR.png


Situation 2: Only IPTG, no aTc. LuxI and as a result internal AHL (red curve hidden under green curve) is produced. The production of AiiA is fully repressed.


Graph2 2 synchroscillator WUR.png


Situation 3: Equal amounts of IPTG and aTc produce oscillations as seen in previous simulations.


Graph4 2 synchroscillator WUR.png Graph5 2 synchroscillator WUR.png


Situation 4 and 5: Interesting behavior of the system when adding IPTG and aTc in reversed proportions.

From the model it can be concluded that the oscillatory behavior can indeed be fine tuned. However, wet-lab experiments are needed to quantify the parameters.


back to top

Links and references:

[1][http://www.nature.com/nature/journal/v463/n7279/abs/nature08753.html Danino et al. 2010]

[2][http://www.nature.com/nature/journal/v463/n7279/suppinfo/nature08753.html Supplementary information]

[3]Tokyo iGEM 2007