Team:Caltech/Project
From 2011.igem.org
| (20 intermediate revisions not shown) | |||
| Line 1: | Line 1: | ||
{{Team:Caltech/templateheader| | {{Team:Caltech/templateheader| | ||
Content= | Content= | ||
| - | + | __TOC__ | |
== Bioremediation of Endocrine Disruptors Using Genetically Modified ''Escherichia Coli'' == | == Bioremediation of Endocrine Disruptors Using Genetically Modified ''Escherichia Coli'' == | ||
| Line 8: | Line 8: | ||
===Introduction:=== | ===Introduction:=== | ||
| + | [[File:EDC-environment diagram.png|thumb|500px|Sources of Endocrine Disruptors]] | ||
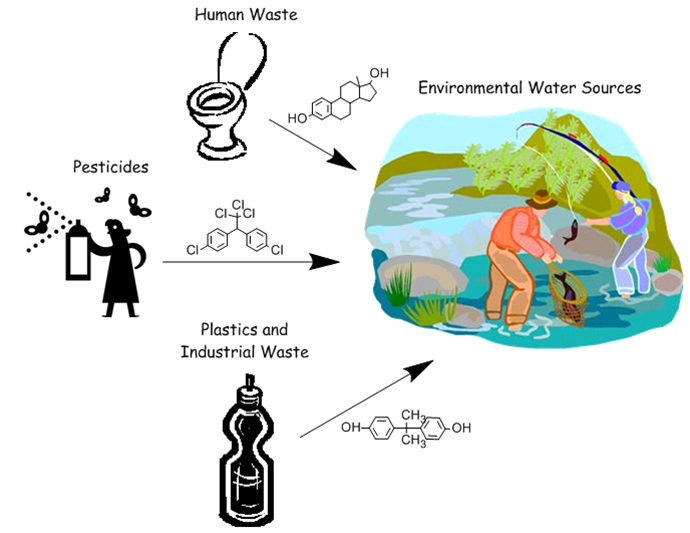
Endocrine-disrupting chemicals (EDCs) are chemicals that interact with the endocrine system by binding to hormone receptors, causing problems in sexual development and reproduction of organisms. These chemicals are introduced to the environment from improper disposal of plastic wastes, hormonal medications remaining in human waste, and pesticides. Areas with high concentrations of estrogen in water have been shown to correlate with a higher percentage of intersex fish, and pesticides such as DDT have been shown to impact the development of the female reproductive tract in birds. Many EDCs are persistent organic pollutants, and even though regulations have been put in place for pesticide use and industrial production of endocrine disruptors, many of these chemicals continue to pollute bodies of water in significant concentrations.<br/><br/> | Endocrine-disrupting chemicals (EDCs) are chemicals that interact with the endocrine system by binding to hormone receptors, causing problems in sexual development and reproduction of organisms. These chemicals are introduced to the environment from improper disposal of plastic wastes, hormonal medications remaining in human waste, and pesticides. Areas with high concentrations of estrogen in water have been shown to correlate with a higher percentage of intersex fish, and pesticides such as DDT have been shown to impact the development of the female reproductive tract in birds. Many EDCs are persistent organic pollutants, and even though regulations have been put in place for pesticide use and industrial production of endocrine disruptors, many of these chemicals continue to pollute bodies of water in significant concentrations.<br/><br/> | ||
Synthetic biology involves the engineering of genetic networks to create modified organisms that can address a problem or perform a task. We focus on modifying the genetic code of ''E. coli'' to remove endocrine-disrupting chemicals from water. To do this, we created constructs containing previously discovered BisdA and BisdB enzymes that have been shown to degrade BPA and we are testing their efficacy. We also assembled a gene for DDT Dehydrochlorinase, an enzyme previously shown to degrade DDT, and expressed this gene in'' E. coli'' to characterize its properties. We were able to establish that our synthesized gene expresses a protein that consistently degrades DDT. This enzyme may also be useful in degrading other EDCs. | Synthetic biology involves the engineering of genetic networks to create modified organisms that can address a problem or perform a task. We focus on modifying the genetic code of ''E. coli'' to remove endocrine-disrupting chemicals from water. To do this, we created constructs containing previously discovered BisdA and BisdB enzymes that have been shown to degrade BPA and we are testing their efficacy. We also assembled a gene for DDT Dehydrochlorinase, an enzyme previously shown to degrade DDT, and expressed this gene in'' E. coli'' to characterize its properties. We were able to establish that our synthesized gene expresses a protein that consistently degrades DDT. This enzyme may also be useful in degrading other EDCs. | ||
| Line 14: | Line 15: | ||
In order to test the feasibility of an'' E. coli''-housed system for bioremediation, we conducted experiments with biofilms prepared on glass beads in a column. As a model system, we used the degradation of X-gal with beta-galactosidase. We also conducted an evaluation of local water plants to determine typical purification systems for large bodies of water and see if a bioremediation unit can integrate into typical water treatment plants.<br/><br/> | In order to test the feasibility of an'' E. coli''-housed system for bioremediation, we conducted experiments with biofilms prepared on glass beads in a column. As a model system, we used the degradation of X-gal with beta-galactosidase. We also conducted an evaluation of local water plants to determine typical purification systems for large bodies of water and see if a bioremediation unit can integrate into typical water treatment plants.<br/><br/> | ||
| - | ===BisdA and BisdB=== | + | ===BisdA and BisdB=== |
| - | + | <gallery widths=350px heights=350px> | |
| - | + | File:PNT001map.png|Plasmid map of BisdA under the lac promoter [http://partsregistry.org/Part:BBa_K620002 K620002] in [http://partsregistry.org/Part:pSB4A5 pSB4A5.] | |
| - | We sourced genetic material for BisdA [http://partsregistry.org/Part:BBa_K123000 (K123000)] and BisdB [http://partsregistry.org/Part:BBa_K123001 (K123001)] from the Registry of Standard Biological Parts. The sequence listed for these parts had the wrong codons listed, so we sequenced the parts to determine the correct codons. We then designed genetic constructs with inducible promoters, ribosome binding regions, and terminators in plasmid backbones for each gene. We accessed these parts by transforming DNA from the Registry of Standard Biological Parts into chemically competent ''E. coli'' for construction, and used PCR to extract our desired components. We attempted several methods of assembly for these pieces, including traditional assembly, Gibson assembly, and a combination of PCR assembly for the coding construct and standard assembly to insert the coding construct into a backbone. After assembly of these components was complete, we combined the two coding constructs into one vector and expressed this vector in ''E. coli'' for experimentation. We are now inducing production of [[:File:PNT001map.png|BisdA]] and [[:File:pnt002map.png|BisdB]] so that we can investigate their ability to degrade EDCs. | + | File:pnt002map.png|Plamid map of BisdB under the tet promoter [http://partsregistry.org/Part:BBa_K620003 K6230003] in [http://partsregistry.org/Part:pSB3K3 pSB3K3.] |
| + | </gallery> | ||
| + | We sourced genetic material for BisdA [http://partsregistry.org/Part:BBa_K123000 (K123000)] and BisdB [http://partsregistry.org/Part:BBa_K123001 (K123001)] from the Registry of Standard Biological Parts. BisdA, a ferrodoxin, and BisdB, a cytochrome p450, both isolated from a strain of ''Sphingomonas bisphenolicum'', are known to degrade bisphenol A in the presence of each other. The sequence listed for these parts had the wrong codons listed, so we sequenced the parts to determine the correct codons. We then designed genetic constructs with inducible promoters, ribosome binding regions, and terminators in plasmid backbones for each gene. We accessed these parts by transforming DNA from the Registry of Standard Biological Parts into chemically competent ''E. coli'' for construction, and used PCR to extract our desired components. We attempted several methods of assembly for these pieces, including traditional assembly, Gibson assembly, and a combination of PCR assembly for the coding construct and standard assembly to insert the coding construct into a backbone. After assembly of these components was complete, we combined the two coding constructs into one vector and expressed this vector in ''E. coli'' for experimentation. We are now inducing production of [[:File:PNT001map.png|BisdA]] and [[:File:pnt002map.png|BisdB]] so that we can investigate their ability to degrade EDCs. | ||
<br style="clear: both" /> | <br style="clear: both" /> | ||
===Gibson Assembly=== | ===Gibson Assembly=== | ||
| - | [[File:7-21gibsontime.jpg| | + | [[File:7-21gibsontime.jpg|thumb|350px|A gel showing Gibson assembly of GFP, promoter, terminator and pSB4A5 and BisdA, lac promoter, terminator and pSB4A5 (pNT001) stopped at 0, 5, 10, 15, 30, 60 minutes. Generally, over time, the smaller bands decrease in brightness and larger bands increase in brightness]] |
We attempted to use Gibson Assembly for creating composite BioBrick plasmids including inducible BisdA and BisdB. After many weeks of doing Gibson reactions and screening for colonies, we have observed that Gibson assembly may not be the most efficient and reliable method of assembling BioBricks. Gibson assembly may be a quicker method of cloning than using restriction enzymes and ligase, but this work indicates that quality and quantity of plasmids produced using this method are not as easily reproducible as standard assembly for assembly of multiple BioBrick parts is. If iGEM teams wish to use this method for assembly, we have shown that limiting the total DNA in the Gibson reaction, limiting the number of parts being combined in the reaction and using extremely competent cells improves the ratio of experimental colonies to negative control colonies. These can then be screened using colony PCR or sequencing. However, the high complementarity between the BioBrick prefix and suffix could contribute to the high numbers of self-ligation we observed. Due to the enzymes in the Gibson reaction, phosphatase cannot be used, a common procedure in standard assembly.<br/> | We attempted to use Gibson Assembly for creating composite BioBrick plasmids including inducible BisdA and BisdB. After many weeks of doing Gibson reactions and screening for colonies, we have observed that Gibson assembly may not be the most efficient and reliable method of assembling BioBricks. Gibson assembly may be a quicker method of cloning than using restriction enzymes and ligase, but this work indicates that quality and quantity of plasmids produced using this method are not as easily reproducible as standard assembly for assembly of multiple BioBrick parts is. If iGEM teams wish to use this method for assembly, we have shown that limiting the total DNA in the Gibson reaction, limiting the number of parts being combined in the reaction and using extremely competent cells improves the ratio of experimental colonies to negative control colonies. These can then be screened using colony PCR or sequencing. However, the high complementarity between the BioBrick prefix and suffix could contribute to the high numbers of self-ligation we observed. Due to the enzymes in the Gibson reaction, phosphatase cannot be used, a common procedure in standard assembly.<br/> | ||
| Line 27: | Line 30: | ||
<br style="clear: both" /> | <br style="clear: both" /> | ||
===DDT Dehydrochlorinase=== | ===DDT Dehydrochlorinase=== | ||
| - | + | <gallery widths=350px heights=350px> | |
| - | + | File:Ddtspb1c3.png|Plasmid map of [http://partsregistry.org/Part:BBa_K620000 K620000] in [http://partsregistry.org/Part:pSB1C3 pSB1C3] (submission plasmid) | |
| - | + | File:Ddtpet11a.png|Plasmid map of [http://partsregistry.org/Part:BBa_K620000 K620000] in pET11-a to amplify and purify the protein. | |
| - | [ | + | </gallery> |
| - | + | ||
| - | [[File: | + | [[File:DDTdechlorinase.jpg|thumb|350px|The band indicating DDT dehydrochlorinase is visible in both elution columns, between the 21,500 and 31,000 g/mol bands. The DDT protein is 23,500 g/mol.]] |
| - | + | ||
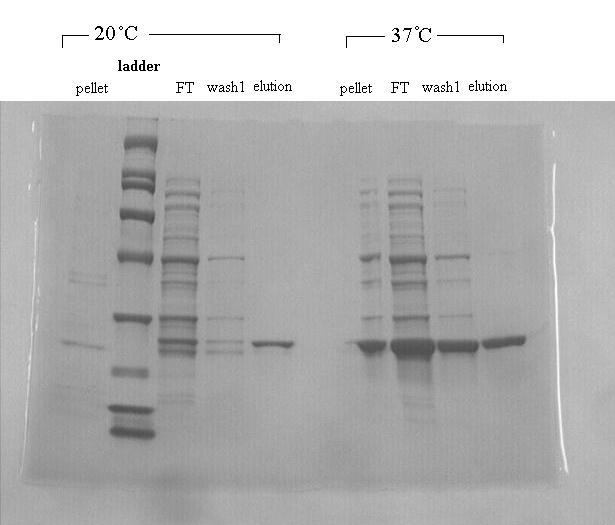
| - | <p>We found DDT Dehydrochlorinase in the literature as an enzyme discovered to degrade DDT. We found the amino acid code for this enzyme on GenBank, used [http://helixweb.nih.gov/dnaworks/ DNAWorks] to design oligos for assembling this enzyme optimized in E. coli, and assembled this gene using PIPE cloning. We then inserted this gene in a pET vector with a his-tag and overexpressed it in ''E. coli''. We purified the protein and ran it on a gel, indicating that this gene can be expressed in ''E. coli'' as shown in the [[:File:DDTdechlorinase.jpg|DDT dehydrochlorinase gel image]]. </p> | + | <p>We found DDT Dehydrochlorinase in the literature as an enzyme discovered to degrade DDT. We found the amino acid code for this enzyme on GenBank, used [http://helixweb.nih.gov/dnaworks/ DNAWorks] to design oligos for assembling this enzyme optimized in E. coli, and assembled this gene using PIPE cloning. We then inserted this gene in a pET vector with a his-tag and overexpressed it in ''E. coli''. We purified the protein and ran it on a gel, indicating that this gene can be expressed in ''E. coli'' as shown in the [[:File:DDTdechlorinase.jpg|DDT dehydrochlorinase gel image]]. </p> |
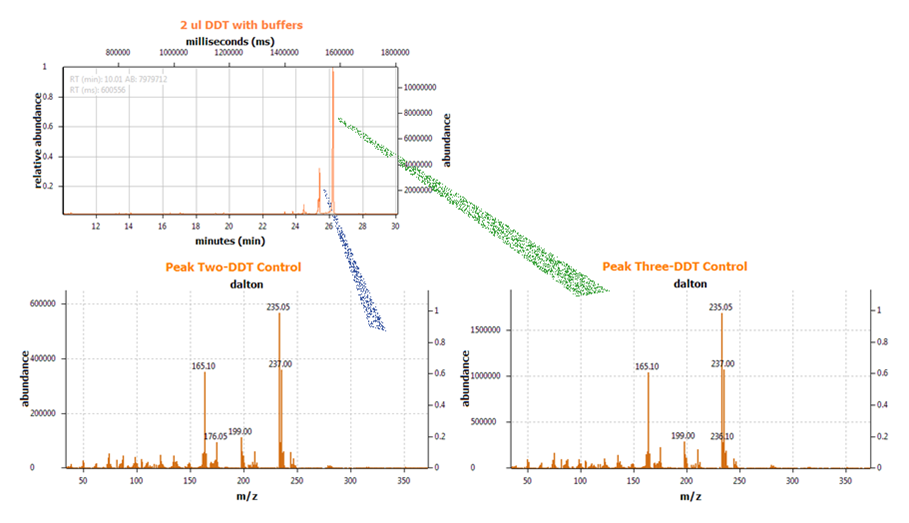
| - | We next conducted degradation experiments with DDT. We set up an experiment in which cell lysate of cells producing DDT dehydrochlorinase was prepared in a reaction with DDT and some buffers and reacted overnight. Then the reaction mixture was analyzed using electrospray GCMS, along with a control of DDT without cell lysate. As shown in the [[:File: | + | We next conducted degradation experiments with DDT. We set up an experiment in which cell lysate of cells producing DDT dehydrochlorinase was prepared in a reaction with DDT and some buffers and reacted overnight. Then the reaction mixture was analyzed using electrospray GCMS, along with a control of DDT without cell lysate. As shown in the [[:File:DDT before degradation.png|GCMS of DDT without degradation enzymes]], there is a clear band at 235 g/mol. DDT's molar mass is 354.5. This indicates that the original [[:File:ddt.png|structure]] loses a carbon and three chlorines to form a [[:File:MS1DDT235.png|new structure]] with this mass during the GCMS process. The [[:File:DDT after degradation.png|12.5 minute GC peak and the 16.5 minute peak]] in the DDT-DDT dehydrochlorinase reaction show a further degradation of DDT. The 16.5 minute peak showed an MS peak at 206 g/mole. The degradation that could result in this weight involves the loss of [[:File:MSDDT205.png|two chlorines and a phenyl group]]. |
| + | <gallery widths=350 heights=250> | ||
| + | File:DDT before degradation.png|GCMS of DDT showing a clear peak at 235g/mol | ||
| + | File:DDT after degradation.png|DDT reaction with DDT Dehydrochlorinase analyzed with GCMS-12.5 minute peak. There is a peak at 105 g/mol and a peak at 133 g/mol | ||
| + | </gallery> | ||
| + | <gallery widths=200 heights=150> | ||
| + | File:ddt.png|DDT Molecular Structure | ||
| + | File:MS1DDT235.png|DDT structure after GCMS with a molecular weight of 206g/mol | ||
| + | File:MSDDT205.png|DDT structure after reaction with DDT Dehydrochlorinase and GCMS with a molecular weight of 206 g/mol | ||
| + | </gallery> | ||
| + | There is another mass spec band in this reading at 191 g/mol, which we are still working to identify. In the 12.5 minute GC peak, there are MS peaks at 133 g/mol and at 105 g/mol, which we are also still working to identify. However, these two GC peaks are not present in analysis of our reaction buffer with DDT and our reaction buffer with enzyme, indicating that they result from a degradation reaction between DDT dehydrochlorinase and DDT. | ||
| + | |||
<br style="clear: both" /> | <br style="clear: both" /> | ||
===Cytochrome p450s=== | ===Cytochrome p450s=== | ||
| - | + | <gallery widths=350px heights=100px> | |
| - | + | File:Blank_BPA.jpg|HPLC of BPA, without enzyme added | |
| - | [[File:P450psb1c3.png| | + | File:WT-F87A.jpg|HPLC of BPA degraded, with p450 Wt-F87A |
| - | Cytochrome p450s are known to be initiators of degradation for several compounds. We analyzed the structures of the cytochrome p450s which the Arnold Lab possessed in their genetic library and selected four highly promiscuous p450s. We then conducted reactions of these p450s with BPA, DDT, 17a-ethinylestradiol, and nonylphenol. We | + | </gallery> |
| + | [[File:P450psb1c3.png|thumb|350px|Plasmid map of [http://partsregistry.org/Part:BBa_K620001 K620001] in [http://partsregistry.org/Part:pSB1C3 pSB1C3] (submission plasmid).]] | ||
| + | Cytochrome p450s are known to be initiators of degradation for several compounds. We analyzed the structures of the cytochrome p450s which the Arnold Lab possessed in their genetic library and selected four highly promiscuous p450s. We then conducted reactions of these p450s with BPA, DDT, 17a-ethinylestradiol, and nonylphenol. We analyzed the product with HPLC. As shown in the HPLC results, the[[:File:Blank_BPA.jpg| plain BPA HPLC]] has only one peak, while the [[:File:WT-F87A.jpg|HPLC analysis of BPA degraded with the WT-F87A cytochrome p450]] has two. We also analyzed this reaction using electrospray GCMS. This showed that the p450 degraded BPA from its [[:file:BPA_electrospray.jpg|original MS reading]] of 227 g/mol to a [[:file:BPAdegra.png|MS reading]] of 205g/mole. We are working to determine what degradation steps would result in this mass. However, since the GC analysis shows a wide band of molecules with a mass of 205 g/mol, this indicates that there are likely many different structural compounds with this molecular mass created when the WT-F87A p450 degrades BPA. This result establishes another degradation pathway for Bisphenol A. | ||
<br style="clear: both" /> | <br style="clear: both" /> | ||
| - | + | <gallery widths=350 heights=200> | |
| + | File:BPA GC.png|Gas chromatography of BPA before degradation | ||
| + | File:BPA MS.png|Mass spectrometry of BPA showing characteristic peak at 227g/mol | ||
| + | </gallery> | ||
| + | <gallery widths=350 heights=200> | ||
| + | File:BPA GC degraded.png|Gas chromatography of BPA after reaction with the WT-F87A P450. The peak is wider, indicating that multiple species are present | ||
| + | File:BPA MS degraded.png|Mass spectrometry of BPA after reaction with the WT-F87A P450. The peak at 227g/mol is diminished, and there is a new large peak at 205g/mol | ||
| + | </gallery> | ||
===Selection of EDC-Degrading Organisms=== | ===Selection of EDC-Degrading Organisms=== | ||
| - | [[File: | + | [[File:Gene fishing diagram.png|thumb|500px|Our gene fishing method]] |
| - | [[File: | + | [[File:Gene fishing tubes.jpg|thumb|350px|Minimal media cultures]] |
| + | |||
In order to identify an organism capable of degrading our EDCs, we collected dry and wet samples from the Los Angeles river and used these samples to inoculate liquid minimal media cultures in which the sole source of carbon was the EDC. (We used media with and without a vitamin mix to account for any compounds the organisms might not be capable of manufacturing themselves, but the presence or absence of the vitamin mix seems to have made little difference in the growth of the organisms; cultures exhibited equivalent growth both with and without the vitamin mix.) We sequentially used these cultures to inoculate new cultures every two to three days over an eight-week period in order to further isolate organisms. | In order to identify an organism capable of degrading our EDCs, we collected dry and wet samples from the Los Angeles river and used these samples to inoculate liquid minimal media cultures in which the sole source of carbon was the EDC. (We used media with and without a vitamin mix to account for any compounds the organisms might not be capable of manufacturing themselves, but the presence or absence of the vitamin mix seems to have made little difference in the growth of the organisms; cultures exhibited equivalent growth both with and without the vitamin mix.) We sequentially used these cultures to inoculate new cultures every two to three days over an eight-week period in order to further isolate organisms. | ||
| Line 54: | Line 78: | ||
At this stage, we attempted to plate our cultures on solid minimal media; however, all of the compounds we chose are insoluble in water, which makes traditional plating impossible. We attempted several alternate methods of plating the EDCs together with the minimal media and cultures, but all these attempts were unsuccessful. Thus, although we demonstrated the presence of EDC-degrading organisms in our cultures, we were unable to fully isolate any organisms for further study. | At this stage, we attempted to plate our cultures on solid minimal media; however, all of the compounds we chose are insoluble in water, which makes traditional plating impossible. We attempted several alternate methods of plating the EDCs together with the minimal media and cultures, but all these attempts were unsuccessful. Thus, although we demonstrated the presence of EDC-degrading organisms in our cultures, we were unable to fully isolate any organisms for further study. | ||
<br style="clear: both" /> | <br style="clear: both" /> | ||
| + | <gallery> | ||
| + | File:Plates wk 3.png|Figure 1: Liquid minimal media cultures plated on LB; week 3 | ||
| + | File:Plates_wk_8.png|Figure 2: Liquid minimal media cultures plated on LB; week 8 | ||
| + | </gallery> | ||
===Biofilm Columns=== | ===Biofilm Columns=== | ||
| - | [[File: | + | [[File:Creating a bioreactor.png|thumb|500px|Our plan to grow and test biofilms]] |
| + | <p>We cultured top10 ''E. coli'' biofilms on glass beads and stained with crystal violet to show growth the bacteria. To measure the thickness of the biofilms, we washed the beads with water to remove free-floating crystal violet and bacteria, used a set amount of ethanol to wash off the crystal violet stain from the beads, then ran the wash through a spectrophotometer- the higher the absorbance, the thicker the biofilm. Our next step was to create a construct within the top10 bacteria which constitutively expressed the lacZ gene. Since lacZ cleaves X-gal, a clear chemical, into its component dye and galactose, the lacZ-infused bacteria was able to change a solution of X-gal bright blue in under 10 minutes. The final part of this experiment would be to grow the lacZ-infused bacteria into a biofilm onto glass beads, then flow the X-gal solution through a column of the biofilm beads. The effluent flow should be bright blue. However, this last bit hasn't been completed as of the iGEM due date.</p> | ||
<br style="clear: both" /> | <br style="clear: both" /> | ||
| + | <gallery widths=200 heights=300> | ||
| + | File:Xgal flask not blue.jpg|Flask of bacteria modified with lac-z | ||
| + | File:Xgal flask blue.jpg|Flask of bacteria modified with lac-z after addition of x-gal | ||
| + | File:Tube,_smaller.jpg|Visible layers of biofilm as visualized by crystal violet | ||
| + | </gallery> | ||
| + | |||
}} | }} | ||
Latest revision as of 01:03, 29 October 2011
|
Project |
Bioremediation of Endocrine Disruptors Using Genetically Modified Escherichia ColiEndocrine disruptors, or substances that mimic estrogen in the body, have detrimental biological effects on the reproduction of several species of fish and birds; the Caltech team focuses on bioremediation of these toxins. Our goal is to create a system housed in E. coli that can be used to process water and remove endocrine disruptors on a large scale. We focus on isolating degradation systems for the common endocrine disruptors bisphenol A (BPA), DDT, nonylphenol and 17a-ethynylestradiol. We synthesized known degradation enzymes DDT dehydrochlorinase, BisdA and BisdB, and characterized the behavior of these enzymes when acting on our target endocrine disruptors. In addition, we explored the potential of certain cytochrome p450s to initiate degradation of these chemicals, focusing on WT-F87A degradation of BPA. Finally, we characterized the functionality of E. coli protein processing when E. coli is deployed as an easily containable biofilm on various substances in aqueous environments. Introduction:Endocrine-disrupting chemicals (EDCs) are chemicals that interact with the endocrine system by binding to hormone receptors, causing problems in sexual development and reproduction of organisms. These chemicals are introduced to the environment from improper disposal of plastic wastes, hormonal medications remaining in human waste, and pesticides. Areas with high concentrations of estrogen in water have been shown to correlate with a higher percentage of intersex fish, and pesticides such as DDT have been shown to impact the development of the female reproductive tract in birds. Many EDCs are persistent organic pollutants, and even though regulations have been put in place for pesticide use and industrial production of endocrine disruptors, many of these chemicals continue to pollute bodies of water in significant concentrations. BisdA and BisdBWe sourced genetic material for BisdA [http://partsregistry.org/Part:BBa_K123000 (K123000)] and BisdB [http://partsregistry.org/Part:BBa_K123001 (K123001)] from the Registry of Standard Biological Parts. BisdA, a ferrodoxin, and BisdB, a cytochrome p450, both isolated from a strain of Sphingomonas bisphenolicum, are known to degrade bisphenol A in the presence of each other. The sequence listed for these parts had the wrong codons listed, so we sequenced the parts to determine the correct codons. We then designed genetic constructs with inducible promoters, ribosome binding regions, and terminators in plasmid backbones for each gene. We accessed these parts by transforming DNA from the Registry of Standard Biological Parts into chemically competent E. coli for construction, and used PCR to extract our desired components. We attempted several methods of assembly for these pieces, including traditional assembly, Gibson assembly, and a combination of PCR assembly for the coding construct and standard assembly to insert the coding construct into a backbone. After assembly of these components was complete, we combined the two coding constructs into one vector and expressed this vector in E. coli for experimentation. We are now inducing production of BisdA and BisdB so that we can investigate their ability to degrade EDCs.
Gibson AssemblyWe attempted to use Gibson Assembly for creating composite BioBrick plasmids including inducible BisdA and BisdB. After many weeks of doing Gibson reactions and screening for colonies, we have observed that Gibson assembly may not be the most efficient and reliable method of assembling BioBricks. Gibson assembly may be a quicker method of cloning than using restriction enzymes and ligase, but this work indicates that quality and quantity of plasmids produced using this method are not as easily reproducible as standard assembly for assembly of multiple BioBrick parts is. If iGEM teams wish to use this method for assembly, we have shown that limiting the total DNA in the Gibson reaction, limiting the number of parts being combined in the reaction and using extremely competent cells improves the ratio of experimental colonies to negative control colonies. These can then be screened using colony PCR or sequencing. However, the high complementarity between the BioBrick prefix and suffix could contribute to the high numbers of self-ligation we observed. Due to the enzymes in the Gibson reaction, phosphatase cannot be used, a common procedure in standard assembly. We recommend PCR assembly, if possible, of composite BioBrick inserts rather than multi-step standard assembly to increase the efficiency of assembling of BioBrick parts. Future iGEM teams are advised to try different methods of assembly and cloning in parallel, as the parts are not as modular as stated and each combination behaves differently than others.
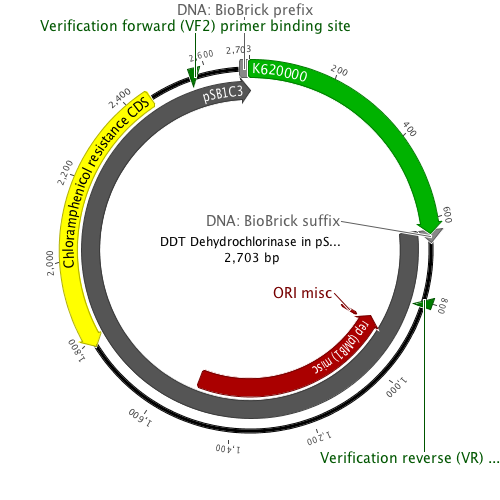
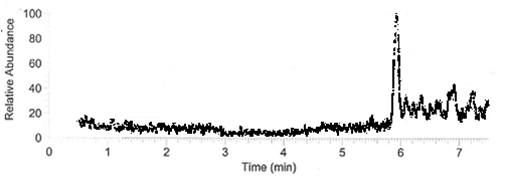
DDT DehydrochlorinaseWe found DDT Dehydrochlorinase in the literature as an enzyme discovered to degrade DDT. We found the amino acid code for this enzyme on GenBank, used [http://helixweb.nih.gov/dnaworks/ DNAWorks] to design oligos for assembling this enzyme optimized in E. coli, and assembled this gene using PIPE cloning. We then inserted this gene in a pET vector with a his-tag and overexpressed it in E. coli. We purified the protein and ran it on a gel, indicating that this gene can be expressed in E. coli as shown in the DDT dehydrochlorinase gel image. We next conducted degradation experiments with DDT. We set up an experiment in which cell lysate of cells producing DDT dehydrochlorinase was prepared in a reaction with DDT and some buffers and reacted overnight. Then the reaction mixture was analyzed using electrospray GCMS, along with a control of DDT without cell lysate. As shown in the GCMS of DDT without degradation enzymes, there is a clear band at 235 g/mol. DDT's molar mass is 354.5. This indicates that the original structure loses a carbon and three chlorines to form a new structure with this mass during the GCMS process. The 12.5 minute GC peak and the 16.5 minute peak in the DDT-DDT dehydrochlorinase reaction show a further degradation of DDT. The 16.5 minute peak showed an MS peak at 206 g/mole. The degradation that could result in this weight involves the loss of two chlorines and a phenyl group. There is another mass spec band in this reading at 191 g/mol, which we are still working to identify. In the 12.5 minute GC peak, there are MS peaks at 133 g/mol and at 105 g/mol, which we are also still working to identify. However, these two GC peaks are not present in analysis of our reaction buffer with DDT and our reaction buffer with enzyme, indicating that they result from a degradation reaction between DDT dehydrochlorinase and DDT.
Cytochrome p450sCytochrome p450s are known to be initiators of degradation for several compounds. We analyzed the structures of the cytochrome p450s which the Arnold Lab possessed in their genetic library and selected four highly promiscuous p450s. We then conducted reactions of these p450s with BPA, DDT, 17a-ethinylestradiol, and nonylphenol. We analyzed the product with HPLC. As shown in the HPLC results, the plain BPA HPLC has only one peak, while the HPLC analysis of BPA degraded with the WT-F87A cytochrome p450 has two. We also analyzed this reaction using electrospray GCMS. This showed that the p450 degraded BPA from its original MS reading of 227 g/mol to a MS reading of 205g/mole. We are working to determine what degradation steps would result in this mass. However, since the GC analysis shows a wide band of molecules with a mass of 205 g/mol, this indicates that there are likely many different structural compounds with this molecular mass created when the WT-F87A p450 degrades BPA. This result establishes another degradation pathway for Bisphenol A.
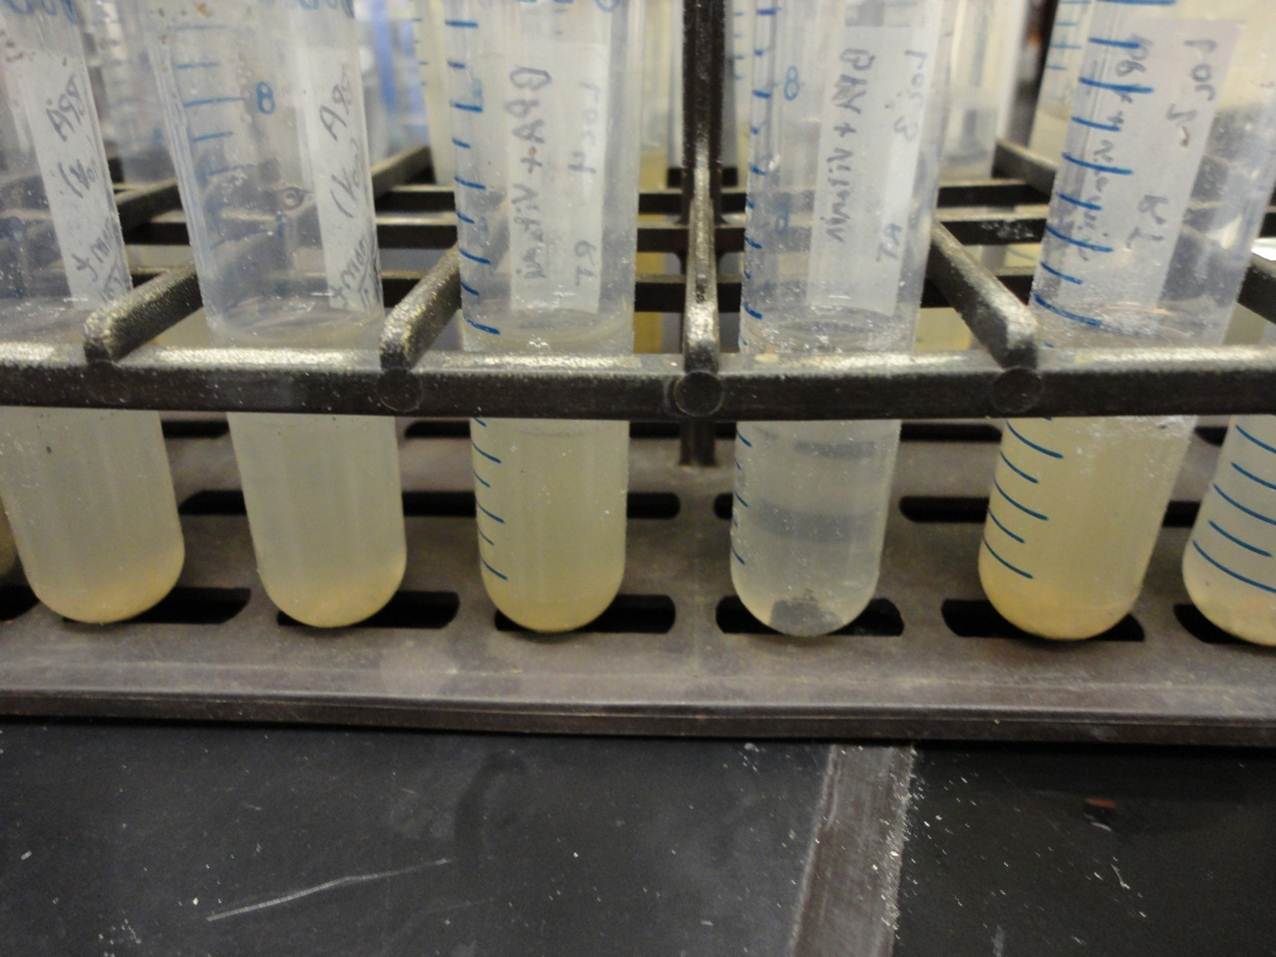
Selection of EDC-Degrading OrganismsIn order to identify an organism capable of degrading our EDCs, we collected dry and wet samples from the Los Angeles river and used these samples to inoculate liquid minimal media cultures in which the sole source of carbon was the EDC. (We used media with and without a vitamin mix to account for any compounds the organisms might not be capable of manufacturing themselves, but the presence or absence of the vitamin mix seems to have made little difference in the growth of the organisms; cultures exhibited equivalent growth both with and without the vitamin mix.) We sequentially used these cultures to inoculate new cultures every two to three days over an eight-week period in order to further isolate organisms. At the third week we plated the cultures on LB plates and observed significant growth of many different types of organisms, indicating that our cultures contained organisms capable of surviving on our EDCs. To further isolate these organisms, colonies from each culture were resuspended in liquid minimal media; as before, new liquid minimal media cultures were inoculated from each of these every two to three days. The cultures were plated again on LB in the eighth week and again, significant growth was observed. At this stage, we attempted to plate our cultures on solid minimal media; however, all of the compounds we chose are insoluble in water, which makes traditional plating impossible. We attempted several alternate methods of plating the EDCs together with the minimal media and cultures, but all these attempts were unsuccessful. Thus, although we demonstrated the presence of EDC-degrading organisms in our cultures, we were unable to fully isolate any organisms for further study.
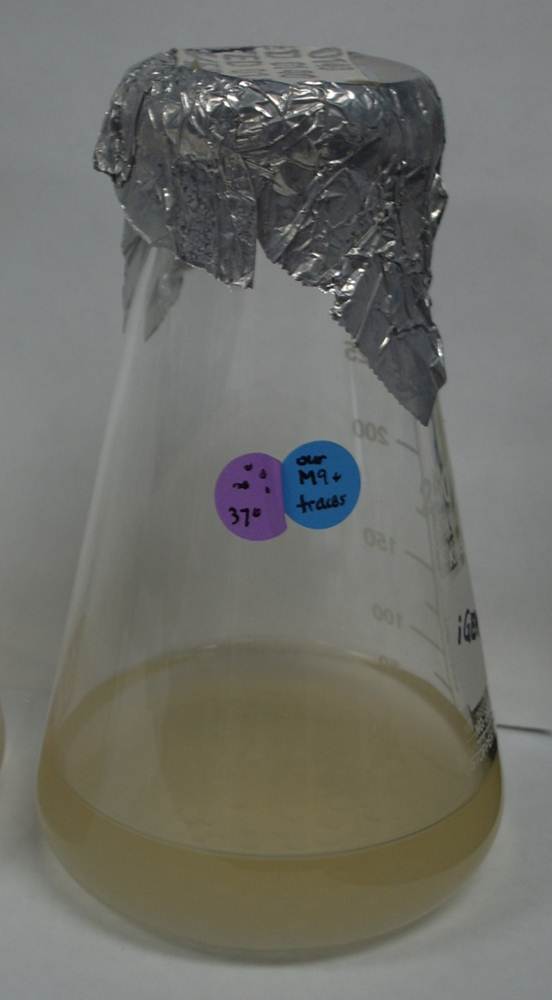
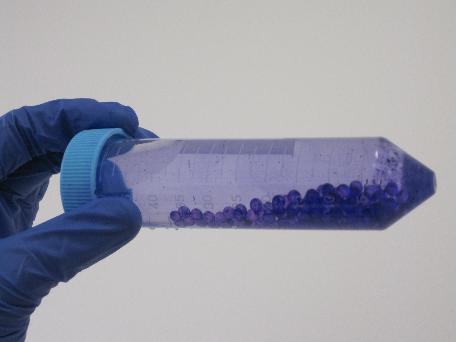
Biofilm ColumnsWe cultured top10 E. coli biofilms on glass beads and stained with crystal violet to show growth the bacteria. To measure the thickness of the biofilms, we washed the beads with water to remove free-floating crystal violet and bacteria, used a set amount of ethanol to wash off the crystal violet stain from the beads, then ran the wash through a spectrophotometer- the higher the absorbance, the thicker the biofilm. Our next step was to create a construct within the top10 bacteria which constitutively expressed the lacZ gene. Since lacZ cleaves X-gal, a clear chemical, into its component dye and galactose, the lacZ-infused bacteria was able to change a solution of X-gal bright blue in under 10 minutes. The final part of this experiment would be to grow the lacZ-infused bacteria into a biofilm onto glass beads, then flow the X-gal solution through a column of the biofilm beads. The effluent flow should be bright blue. However, this last bit hasn't been completed as of the iGEM due date.
|
 "
"


