Team:ETH Zurich/Band Detector Module
From 2011.igem.org
(Created page with "{{:Team:ETH Zurich/Templates/Header/Modeling|currPage=SingleCell}} {|class="roundContainer" | |}") |
m (moved Band Detector Module to Team:ETH Zurich/Band Detector Module) |
||
| (One intermediate revision not shown) | |||
| Line 3: | Line 3: | ||
{|class="roundContainer" | {|class="roundContainer" | ||
| | | | ||
| + | = Band Detector = | ||
| + | |||
| + | The band detector is an amplitude band-pass filter that gives a GFP output when the toxic input substance is in a certain concentration range. The filter is a feed-forward system with 2 branches, interconnected by a NOR gate. | ||
| + | |||
| + | After the toxic substance is detected by the sensor module, the system splits into a slow branch and a fast branch. | ||
| + | |||
| + | The fast branch is the amplitude low-pass filter. This means that it will repress the production of GFP when the toxic substance concentration goes above the high threshold. In other words, GFP is produced only at low toxic substance concentrations. High concentrations of toxic substance trigger LacIm1 expression, GFP production being thus inhibited. | ||
| + | |||
| + | The slow branch is the amplitude high-pass filter which represses GFP when the toxic substance concentration falls below the low threshold or in other words GFP is produced only at high levels of toxic substance. | ||
| + | |||
| + | By combining these 2 filters, GFP is produced when neither LacIm1 or LacI represses it, which is the region between the two thresholds. This region is the range of the toxic substance concentration which can trigger the GFP pulse. The ODEs for the species involved in the band detector are given below. | ||
| + | |||
| + | |||
| + | [[File:Band_detector.png|300px|thumb|center|'''Equation system 3''': ODEs for the states involved in the band detector module (CI, LacI and GFP) ]] | ||
| + | |||
| + | |||
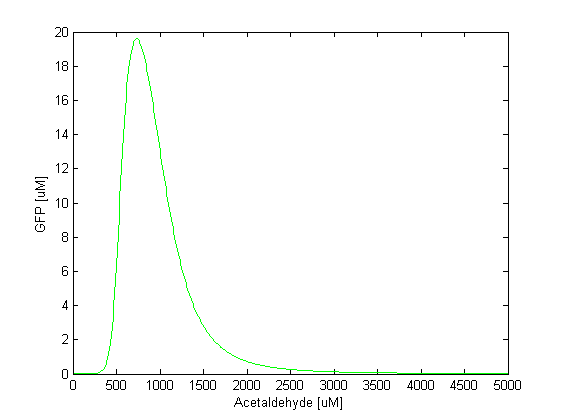
| + | We simulated the models for 5000 seconds and for various concentrations of toxic substances to obtain the steady state values. In the following figures we can see how the steady state concentration of GFP changes for different input concentrations of acetaldehyde or xylene. For the acetaldehyde model the band is formed when the acetaldehyde concentration is approximately in the range of 500-1500 μM. The peak of the GFP pulse is observed when the acetaldehyde concentration is 1000 μM. | ||
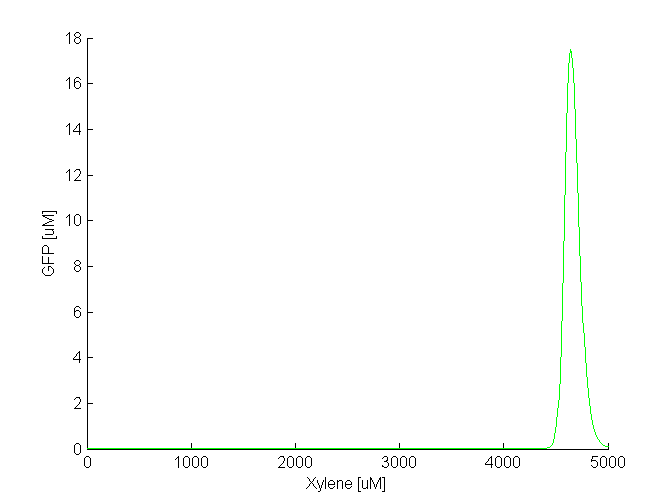
| + | For the xylene model, the band is formed when xylene concentration is in the range of 4500-5000 μM. The peak is at around 4750μM . | ||
| + | |||
| + | [[File:AcABandpass.png|thumb|600px|center|'''Figure 2''': GFP vs. increasing acetaldehyde input (both in μM). The band appears when the acetaldehyde concentration is in the range of 500-1500 μM]] <br> | ||
| + | |||
| + | [[File:Band_xylene1.png|thumb|560px|center|'''Figure 3''':GFP vs. increasing xylene input (both in μM). The band appears when the xylene concentration is in the range of 4500-5000 μM]] | ||
| + | |||
| + | By comparing the two plots, we notice that the GFP band appears at different concentrations of the toxic substances, i.e. we need a 5 times higher concentration of xylene to achieve the same effect as in the case of acetaldehyde. Another difference is the width of the band, which is two times larger for acetaldehyde compared to xylene. The amplitude of the GFP peak has the same order of magnitude for both substances, although it is slightly lower for xylene. | ||
| + | |||
| + | '''Toxicity and parameter tuning''' | ||
| + | |||
| + | The acetaldehyde concentration range where the band is formed might be reasonable in our model, but not in reality. We tested the toxicity of acetaldehyde by adding 10 mM to a culture of E.coli cells and we observed that at this concentration the cells die. By taking into account the fact that a fraction of the acetaldehyde, due to its volatility, will diffuse out of the culture medium, we concluded that the maximum concentration the cells can tolerate is around 2 mM. This means that although in our model the band appears at a lower concentration: 500-1500 uM that does not affect the cells, the bacteria that are closer in the channel to the acetaldehyde source will still die. | ||
| + | |||
| + | Clearly, this tells us that we need to explore the parameter space for some of the constants to find suitable values. This is not surprising since for some of the parameters we made assumptions based on values for similar molecules. We carefully studied the equations involved in the band detector module and decided to make the following changes: | ||
| + | |||
| + | - '''TetR production rate (α<sub>TetR</sub>)''': From the curve fitting [[Team:ETH_Zurich/Modeling/References#Ref1|[1]]], we got the TetR production rate to be 3.93 uM/min and we used this in our simulation. However, the measurements for which we did the fitting were done in mammalian cells, not in "E. coli". Since we express TetR on the same plasmid with other genes, for which we consider production rate to be 1 uM/min, we also changed α<sub>TetR</sub> to 1 uM/min. | ||
| + | |||
| + | - '''TetR repression coefficient (β<sub>TetR</sub>)''': We didn't have any supporting evidence for this, but we assumed it to be 0.01 uM. This was the value used in Basu et al. [[Team:ETH_Zurich/Modeling/References#Ref1|[1]]], but there however the repressor is LuxR, not TetR. We increased TetR repression coefficient to 0.1 uM since we get more realistic results with that value. | ||
| + | |||
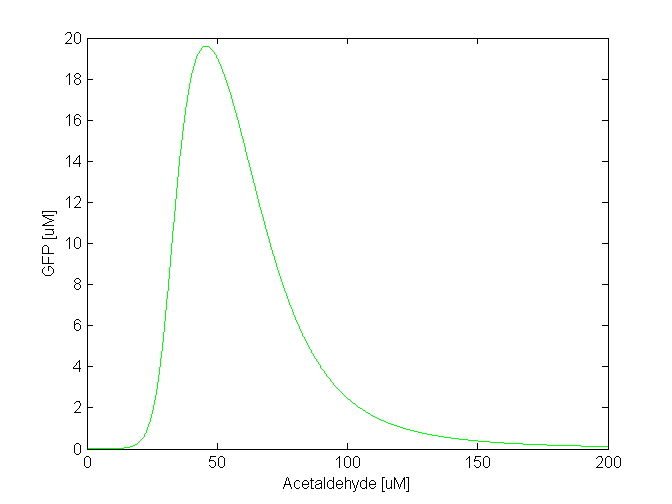
| + | With these 2 changes, the acetaldehyde concentration range where the band appears is at 30-100 uM (see the figure below). | ||
| + | |||
| + | [[File:Band_changed_parameters.png|thumb|560px|center|'''Figure 4''':The band for acetaldehyde after parameter fine tuning is now shifted to the left. It appears when acetaldehyde concentration range is 30-100 uM]] | ||
| + | |||
| + | The fine tuning of the parameters for the xylene model is still in progress. | ||
|} | |} | ||
Latest revision as of 11:21, 17 October 2011
Band DetectorThe band detector is an amplitude band-pass filter that gives a GFP output when the toxic input substance is in a certain concentration range. The filter is a feed-forward system with 2 branches, interconnected by a NOR gate. After the toxic substance is detected by the sensor module, the system splits into a slow branch and a fast branch. The fast branch is the amplitude low-pass filter. This means that it will repress the production of GFP when the toxic substance concentration goes above the high threshold. In other words, GFP is produced only at low toxic substance concentrations. High concentrations of toxic substance trigger LacIm1 expression, GFP production being thus inhibited. The slow branch is the amplitude high-pass filter which represses GFP when the toxic substance concentration falls below the low threshold or in other words GFP is produced only at high levels of toxic substance. By combining these 2 filters, GFP is produced when neither LacIm1 or LacI represses it, which is the region between the two thresholds. This region is the range of the toxic substance concentration which can trigger the GFP pulse. The ODEs for the species involved in the band detector are given below.
By comparing the two plots, we notice that the GFP band appears at different concentrations of the toxic substances, i.e. we need a 5 times higher concentration of xylene to achieve the same effect as in the case of acetaldehyde. Another difference is the width of the band, which is two times larger for acetaldehyde compared to xylene. The amplitude of the GFP peak has the same order of magnitude for both substances, although it is slightly lower for xylene. Toxicity and parameter tuning The acetaldehyde concentration range where the band is formed might be reasonable in our model, but not in reality. We tested the toxicity of acetaldehyde by adding 10 mM to a culture of E.coli cells and we observed that at this concentration the cells die. By taking into account the fact that a fraction of the acetaldehyde, due to its volatility, will diffuse out of the culture medium, we concluded that the maximum concentration the cells can tolerate is around 2 mM. This means that although in our model the band appears at a lower concentration: 500-1500 uM that does not affect the cells, the bacteria that are closer in the channel to the acetaldehyde source will still die. Clearly, this tells us that we need to explore the parameter space for some of the constants to find suitable values. This is not surprising since for some of the parameters we made assumptions based on values for similar molecules. We carefully studied the equations involved in the band detector module and decided to make the following changes: - TetR production rate (αTetR): From the curve fitting [1], we got the TetR production rate to be 3.93 uM/min and we used this in our simulation. However, the measurements for which we did the fitting were done in mammalian cells, not in "E. coli". Since we express TetR on the same plasmid with other genes, for which we consider production rate to be 1 uM/min, we also changed αTetR to 1 uM/min. - TetR repression coefficient (βTetR): We didn't have any supporting evidence for this, but we assumed it to be 0.01 uM. This was the value used in Basu et al. [1], but there however the repressor is LuxR, not TetR. We increased TetR repression coefficient to 0.1 uM since we get more realistic results with that value. With these 2 changes, the acetaldehyde concentration range where the band appears is at 30-100 uM (see the figure below). The fine tuning of the parameters for the xylene model is still in progress.
|
 "
"


