Team:Kyoto/Digestion/Modeling
From 2011.igem.org
(Created page with "='''Modeling'''= We preformed modeling to improve usability of the results of Team Digestion.") |
Tomohiro:n (Talk | contribs) (→3.Exponential state model) |
||
| (44 intermediate revisions not shown) | |||
| Line 1: | Line 1: | ||
| - | ='''Modeling'''= | + | {{Kyoto_Foreground|active_page=project}} |
| - | We preformed modeling to improve usability of the results of Team Digestion. | + | {{Kyoto_Background}} |
| + | {{Kyoto_WikiDesign}} | ||
| + | |||
| + | ='''Digestion Modeling'''= | ||
| + | =='''1.Introduction'''== | ||
| + | We preformed modeling to improve usability of the results of Team Digestion.<br> | ||
| + | The aim of these modeling is the creation of the relationship of time and the cell population of E.coli and the concentration of chitinase and N-acetylglucosamin.<br> | ||
| + | We created two models; Stable state model and exponential state model. | ||
| + | |||
| + | =='''2.Stable state model'''== | ||
| + | We can apply this model when cell population of E.coli don't change. In this case, we can think about two reasons why cell population don't change.<br> | ||
| + | *First, cell population is too small for us to see the significant difference of cell population.<br> | ||
| + | *Second, nutrients in medium don't sufficiently exist for E.coli to grow.<br> | ||
| + | |||
| + | We thought about each reasons and . | ||
| + | |||
| + | ==='''2-1.no feedback model'''=== | ||
| + | We defined these following equations. In defining these equations, we premised the following four things, that is, | ||
| + | *Chitinase in medium isn't decomposed. | ||
| + | *E.coli doesn't digest N-acetylgulcosamin. | ||
| + | *Chitin as substrate of chitinase is sufficient for reaction with chitinase. | ||
| + | *E.coli doesn't grow.<br> | ||
| + | |||
| + | |||
| + | [[File:Modeling_Equation1.png]]<br> | ||
| + | |||
| + | |||
| + | Two under equations of this figure show the production of citinase by E.coli and the decomposition reaction of chitin. In this decompositon reaction, the concentration of chitin isn't related because chitin is solid and don't dissolve in water.<br> | ||
| + | We sought the answers of these equations by followig procedures. | ||
| + | |||
| + | |||
| + | [[File:Modeling_Equation2.png]]<br> | ||
| + | |||
| + | |||
| + | From these answers, we can get this graph.<br> | ||
| + | This graph is the most simply model. In this graph, the each concentration continuously increses by time goes on, and we can easily seek the concrete constants. | ||
| + | |||
| + | |||
| + | [[File:Modeling_Modeling1.jpg]]<br> | ||
| + | |||
| + | ==='''2-2.negative feedback'''=== | ||
| + | |||
| + | We creat anothre graph. In this graph, E.coli digests N-acetylgulcosamin. Therefore, negative feedback occurs on N-acetylglucosmine and the speed of increase of the concentration is lower than no feedback model. In this model, we used the following equation. | ||
| + | |||
| + | |||
| + | [[File:Modeling_Equation3.png]]<br> | ||
| + | |||
| + | |||
| + | |||
| + | [[File:Modeling_Modeling3.jpg]]<br> | ||
| + | |||
| + | =='''3.Exponential state model'''== | ||
| + | |||
| + | We can apply this model when cell population of E.coli exponentially increase. | ||
| + | |||
| + | |||
| + | |||
| + | ==='''3-1.no feed back model'''=== | ||
| + | We defined these following equations. In defining these equations, we premised the following four things, that is, | ||
| + | *chitinase in medium isn't decomposed | ||
| + | *E.coli don't digest N-acetylgulcosamin | ||
| + | *chitin as substrate of chitinase is sufficient for reaction with chitinase | ||
| + | *E.coli exponentially grow<br> | ||
| + | |||
| + | |||
| + | [[File:Modeling_Equation4.png]]<br> | ||
| + | |||
| + | |||
| + | Two under equations of this figure show the production of chitinase by E.coli and the decomposition reaction of chitin. In this decompositon reaction, the concentration of chitin isn't related because chitin is solid and don't dissolve in water.<br> | ||
| + | We sought the answers of these equation by followig procedures. | ||
| + | |||
| + | |||
| + | [[File:Modeling_Equation5.png]]<br> | ||
| + | |||
| + | |||
| + | From these answers, we can get this graph.<br> | ||
| + | |||
| + | |||
| + | [[File:Modeling_Modeling2.jpg]]<br> | ||
| + | |||
| + | ==='''3-2.negative feedback model'''=== | ||
| + | We creat anothre graph. In this graph, E.coli digests N-acetylgulcosamin. Therefore, negative feedback occurs on N-acetylglucosmine and the speed of increase of the concentration is lower than no feedback model. In this model, we used the following equation. | ||
| + | |||
| + | |||
| + | [[File:Modeling_Equation6.png]]<br> | ||
| + | |||
| + | |||
| + | [[File:Modeling_Modeling4.jpg]]<br> | ||
| + | |||
| + | =='''4.Discussion'''== | ||
| + | ==='''4-1.complex model'''=== | ||
| + | In fact, the function of cell population of E.coli seems to be more complex. However, the function can be expressed by the following equation, complex model, because every function will be expressed by the combination of stable state model and exponential state model. | ||
| + | |||
| + | [[File:Digestion_Modeling10.png]] | ||
| + | |||
| + | [[File:Digestion_equation4.png]] | ||
Latest revision as of 04:05, 6 October 2011
Contents |
Digestion Modeling
1.Introduction
We preformed modeling to improve usability of the results of Team Digestion.
The aim of these modeling is the creation of the relationship of time and the cell population of E.coli and the concentration of chitinase and N-acetylglucosamin.
We created two models; Stable state model and exponential state model.
2.Stable state model
We can apply this model when cell population of E.coli don't change. In this case, we can think about two reasons why cell population don't change.
- First, cell population is too small for us to see the significant difference of cell population.
- Second, nutrients in medium don't sufficiently exist for E.coli to grow.
We thought about each reasons and .
2-1.no feedback model
We defined these following equations. In defining these equations, we premised the following four things, that is,
- Chitinase in medium isn't decomposed.
- E.coli doesn't digest N-acetylgulcosamin.
- Chitin as substrate of chitinase is sufficient for reaction with chitinase.
- E.coli doesn't grow.
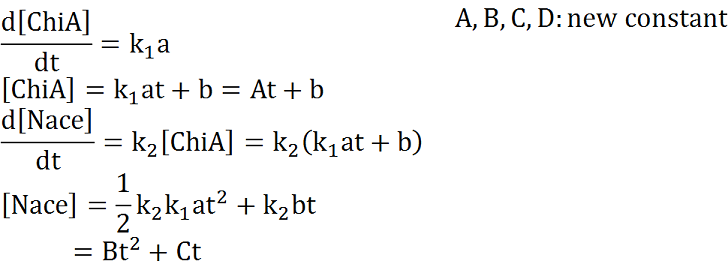
Two under equations of this figure show the production of citinase by E.coli and the decomposition reaction of chitin. In this decompositon reaction, the concentration of chitin isn't related because chitin is solid and don't dissolve in water.
We sought the answers of these equations by followig procedures.
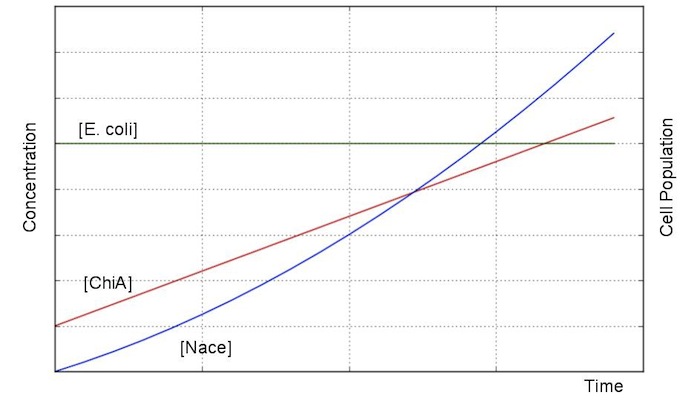
From these answers, we can get this graph.
This graph is the most simply model. In this graph, the each concentration continuously increses by time goes on, and we can easily seek the concrete constants.
2-2.negative feedback
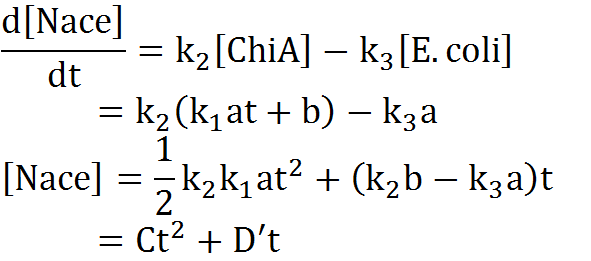
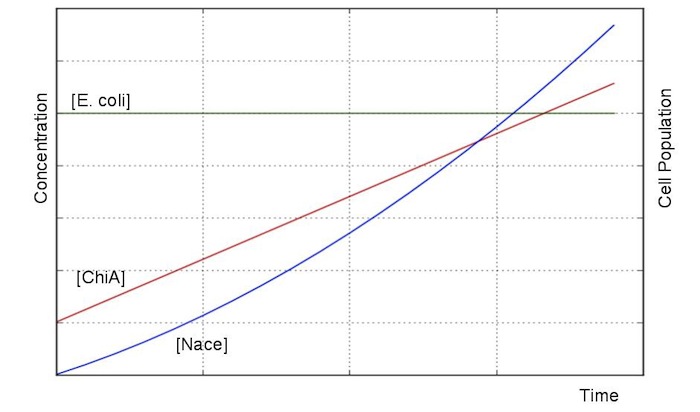
We creat anothre graph. In this graph, E.coli digests N-acetylgulcosamin. Therefore, negative feedback occurs on N-acetylglucosmine and the speed of increase of the concentration is lower than no feedback model. In this model, we used the following equation.
3.Exponential state model
We can apply this model when cell population of E.coli exponentially increase.
3-1.no feed back model
We defined these following equations. In defining these equations, we premised the following four things, that is,
- chitinase in medium isn't decomposed
- E.coli don't digest N-acetylgulcosamin
- chitin as substrate of chitinase is sufficient for reaction with chitinase
- E.coli exponentially grow
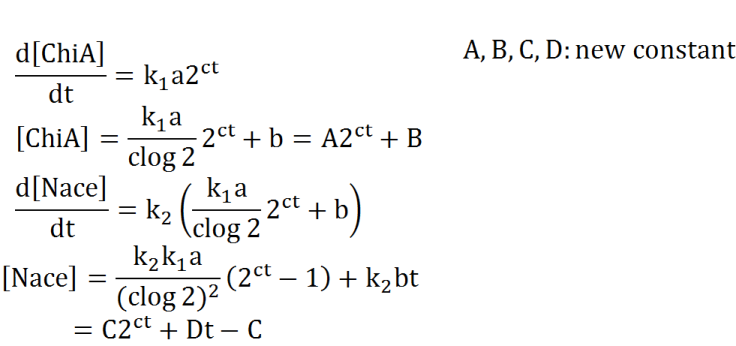
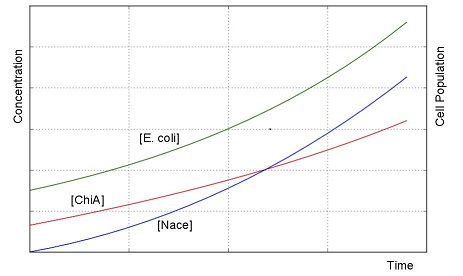
Two under equations of this figure show the production of chitinase by E.coli and the decomposition reaction of chitin. In this decompositon reaction, the concentration of chitin isn't related because chitin is solid and don't dissolve in water.
We sought the answers of these equation by followig procedures.
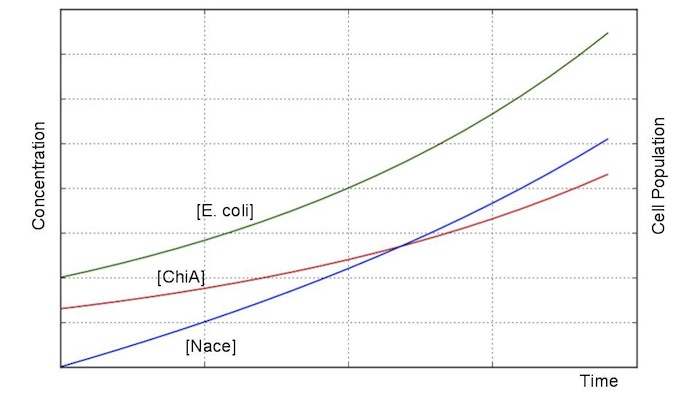
From these answers, we can get this graph.
3-2.negative feedback model
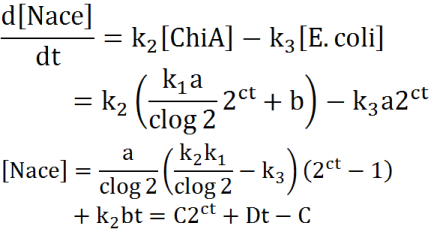
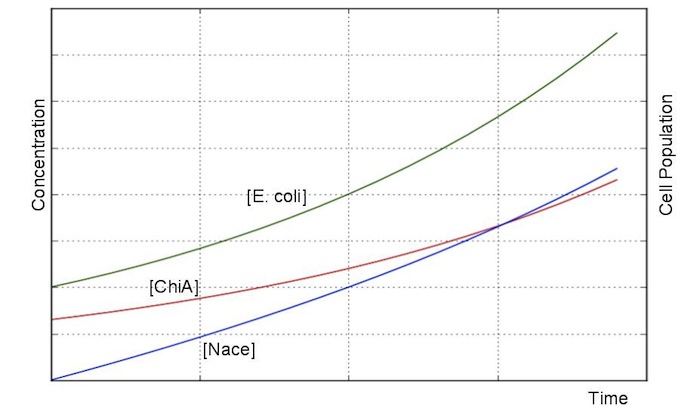
We creat anothre graph. In this graph, E.coli digests N-acetylgulcosamin. Therefore, negative feedback occurs on N-acetylglucosmine and the speed of increase of the concentration is lower than no feedback model. In this model, we used the following equation.
4.Discussion
4-1.complex model
In fact, the function of cell population of E.coli seems to be more complex. However, the function can be expressed by the following equation, complex model, because every function will be expressed by the combination of stable state model and exponential state model.
 "
"


